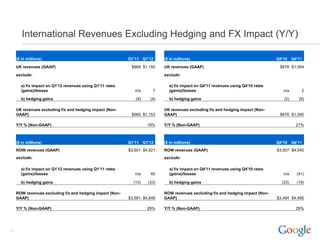
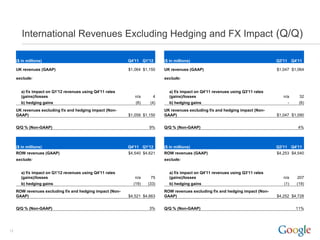
- Google reported revenue growth of 24% year-over-year and 1% quarter-over-quarter for Q1 2012. International revenues reached $5.8 billion.
- Core search and display advertising revenues grew, as did revenues from YouTube, Android, and Chrome. Investments were also made in social, enterprise, and commerce.
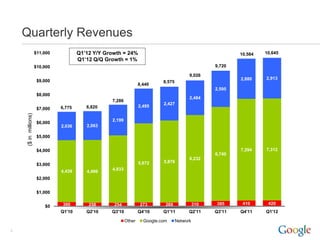
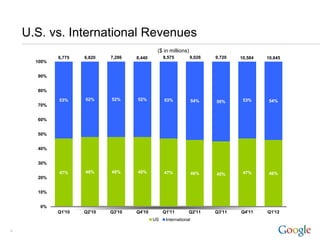
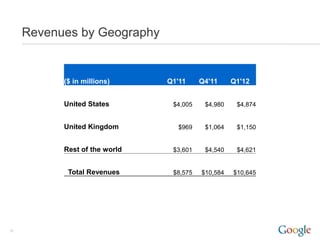
- Revenue increased to $10.6 billion for Q1 2012, up 24% year-over-year. International revenues accounted for 46% of total revenues.