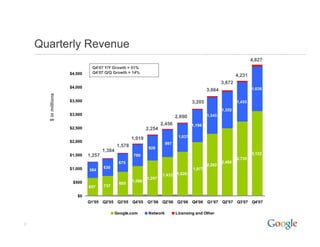
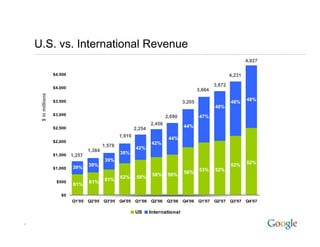
- Google reported strong revenue growth of 51% year-over-year and 14% quarter-over-quarter for Q4 2007, driven by growth in Google properties revenue and network revenues.
- Executing on its Search.Ads.Apps strategy led to improved search quality worldwide and better advertiser control and return on investment. Significant progress was also made in mobile with the launch of Android.
- International revenues grew to $2.3 billion in Q4 2007 and accounted for over half of total revenues, demonstrating Google's strong global performance.
How to get verified on Coinbase Account?_.docxBuy bitget
t's important to note that buying verified Coinbase accounts is not recommended and may violate Coinbase's terms of service. Instead of searching to "buy verified Coinbase accounts," follow the proper steps to verify your own account to ensure compliance and security.
This presentation poster infographic delves into the multifaceted impacts of globalization through the lens of Nike, a prominent global brand. It explores how globalization has reshaped Nike's supply chain, marketing strategies, and cultural influence worldwide, examining both the benefits and challenges associated with its global expansion.
PPrreesseenntteedd bbyy:: GGrroouupp 66
GGlloobbaalliizzaattiioonn
o f
PP
oo
ll
yy
ee
ss
tt
ee
rr
RR
uu
bb
bb
ee
rr
EE
tt
hh
yy
ll
ee
nn
ee
VV
ii
nn
yy
ll
AA
cc
ee
tt
aa
tt
ee
GG
ee
nn
uu
ii
nn
ee
LL
ee
aa
tt
hh
ee
rr
SS
yy
nn
tt
hh
ee
tt
ii
cc
LL
ee
aa
tt
hh
ee
rr
CC
oo
tt
tt
oo
nn
C
o
u
n
t
r
i
e
s
I
n
v
o
l
v
e
d
Ni
k
e
h
a
s
m
o
r
e
t
h
a
n
7
0
0
s
h
o
p
s
i
n
c
o
n
t
r
a
c
t
w
i
t
h
w
o
r
l
d
w
i
d
e,
w
h
e
r
e
i
n
t
h
e
i
r
offi
c
e
s
a
n
d
i
n
d
e
p
e
n
d
e
n
t
fa
c
t
o
r
y
o
u
t
l
e
t
s
a
r
e
fo
u
n
d
w
i
t
h
i
n
t
h
e
p
r
e
m
i
s
e
s
of
ap
p
r
o
x
i
m
a
t
e
l
y
4
5
c
o
u
n
t
r
i
e
s.
AAuussttrraalliiaa
China
India
IInnddoonneessiiaa
TThhaaiillaanndd
TTuurrkkeeyy
USA
VViieettnnaamm
NNiikkee SSuuppppllyy CChhaaiinn
RRuubbbbeerr,, FFaabbrriicc
aanndd ootthheerr rraaww
mmaatteerriiaallss
Shoe
MMaannuuffaaccttuurriinngg
aanndd AAsssseemmbbllyy
MMaarrkkeettiinngg
SSppoorrttiinngg ggooooddss,,
ddeevveellooppmmeenntt
aanndd SShhooee ssttoorreess
OOnnlliinnee,, CCaattaalloogg
aanndd ootthheerr rreettaaiill
NNiikkee bbrraannddeedd
shoes
PPrroodduucctt
ddeevveellooppmmeenntt
CCuussttoommeerr nneeeeddss//wwaannttss ffeeeeddbbaacckk
NNiikk
Nike Supply Chain
Globalization of Nike
Nike Manufacturing Process
Rubber Materials Nike
Ethylene Vinyl Acetate Nike
Genuine Leather Nike
Synthetic Leather Nike
Cotton in Nike Apparel
Nike Shops Worldwide
Nike Manufacturing Countries
Cold Cement Assembly Nike
3D Printing Nike Shoes
Nike Product Development
Nike Marketing Strategies
Nike Customer Feedback
Nike Distribution Centers
Automation in Nike Manufacturing
Nike Consumer Direct Acceleration
Nike Logistics and Transport
What website can I sell pi coins securely.DOT TECH
Currently there are no website or exchange that allow buying or selling of pi coins..
But you can still easily sell pi coins, by reselling it to exchanges/crypto whales interested in holding thousands of pi coins before the mainnet launch.
Who is a pi merchant?
A pi merchant is someone who buys pi coins from miners and resell to these crypto whales and holders of pi..
This is because pi network is not doing any pre-sale. The only way exchanges can get pi is by buying from miners and pi merchants stands in between the miners and the exchanges.
How can I sell my pi coins?
Selling pi coins is really easy, but first you need to migrate to mainnet wallet before you can do that. I will leave the telegram contact of my personal pi merchant to trade with.
Tele-gram.
@Pi_vendor_247
Financial Assets: Debit vs Equity Securities.pptxWrito-Finance
financial assets represent claim for future benefit or cash. Financial assets are formed by establishing contracts between participants. These financial assets are used for collection of huge amounts of money for business purposes.
Two major Types: Debt Securities and Equity Securities.
Debt Securities are Also known as fixed-income securities or instruments. The type of assets is formed by establishing contracts between investor and issuer of the asset.
• The first type of Debit securities is BONDS. Bonds are issued by corporations and government (both local and national government).
• The second important type of Debit security is NOTES. Apart from similarities associated with notes and bonds, notes have shorter term maturity.
• The 3rd important type of Debit security is TRESURY BILLS. These securities have short-term ranging from three months, six months, and one year. Issuer of such securities are governments.
• Above discussed debit securities are mostly issued by governments and corporations. CERTIFICATE OF DEPOSITS CDs are issued by Banks and Financial Institutions. Risk factor associated with CDs gets reduced when issued by reputable institutions or Banks.
Following are the risk attached with debt securities: Credit risk, interest rate risk and currency risk
There are no fixed maturity dates in such securities, and asset’s value is determined by company’s performance. There are two major types of equity securities: common stock and preferred stock.
Common Stock: These are simple equity securities and bear no complexities which the preferred stock bears. Holders of such securities or instrument have the voting rights when it comes to select the company’s board of director or the business decisions to be made.
Preferred Stock: Preferred stocks are sometime referred to as hybrid securities, because it contains elements of both debit security and equity security. Preferred stock confers ownership rights to security holder that is why it is equity instrument
<a href="https://www.writofinance.com/equity-securities-features-types-risk/" >Equity securities </a> as a whole is used for capital funding for companies. Companies have multiple expenses to cover. Potential growth of company is required in competitive market. So, these securities are used for capital generation, and then uses it for company’s growth.
Concluding remarks
Both are employed in business. Businesses are often established through debit securities, then what is the need for equity securities. Companies have to cover multiple expenses and expansion of business. They can also use equity instruments for repayment of debits. So, there are multiple uses for securities. As an investor, you need tools for analysis. Investment decisions are made by carefully analyzing the market. For better analysis of the stock market, investors often employ financial analysis of companies.
The secret way to sell pi coins effortlessly.DOT TECH
Well as we all know pi isn't launched yet. But you can still sell your pi coins effortlessly because some whales in China are interested in holding massive pi coins. And they are willing to pay good money for it. If you are interested in selling I will leave a contact for you. Just telegram this number below. I sold about 3000 pi coins to him and he paid me immediately.
Telegram: @Pi_vendor_247
Abhay Bhutada Leads Poonawalla Fincorp To Record Low NPA And Unprecedented Gr...Vighnesh Shashtri
Under the leadership of Abhay Bhutada, Poonawalla Fincorp has achieved record-low Non-Performing Assets (NPA) and witnessed unprecedented growth. Bhutada's strategic vision and effective management have significantly enhanced the company's financial health, showcasing a robust performance in the financial sector. This achievement underscores the company's resilience and ability to thrive in a competitive market, setting a new benchmark for operational excellence in the industry.
Yes of course, you can easily start mining pi network coin today and sell to legit pi vendors in the United States.
Here the telegram contact of my personal vendor.
@Pi_vendor_247
#pi network #pi coins #legit #passive income
#US
2. Fourth Quarter 2007 Highlights
• Revenue growth of 51% Y/Y and 14% Q/Q
– Google properties revenue growth of 58% Y/Y and 14% Q/Q, driven by strength in
the holiday retail season
– Network revenues increased 37% Y/Y and 12% Q/Q
– Strong international performance, with $2.3 billion in Q4 international revenue
• Executing on Search.Ads.Apps Strategy
– Infrastructure investments in search leading to improved quality
worldwide
– Giving advertisers more control and improving ROI
g p g
– Improving Apps performance and ensuring data portability
– Significant strides in mobile with the launch of Android
• Ongoing focus on growth and profitability
2
6. Costs and Expenses
GAAP
$Millions Q4'06 Q3'07 Q4'07
Cost of Revenues
C f $1,283 $1,663 $1,956
Percent of revenues 40% 39% 41%
Research & Development $387 $549 $631
Percent of revenues 12% 13% 13%
Sales & Marketing $255 $381 $422
Percent of revenues 8% 9% 9%
General & Administrative $220 $321 $377
Percent of revenues 7% 8% 8%
Total Costs & Expenses $2,145 $2,914 $3,386
Percent of revenues 67% 69% 71%
Non GAAP
Non-GAAP
$Millions Q4'06 Q3'07 Q4'07
Cost of Revenues $1,272 $1,659 $1,950
Percent of revenues 40% 39% 40%
Research & Development $305 $418 $470
Percent of revenues 10% 10% 10%
Sales & Marketing $241 $351 $384
Percent of revenues 7% 8% 8%
General & Administrative $193 $288 $337
Percent of revenues 6% 7% 7%
Total Costs & Expenses $2,011 $2,716 $3,141
Percent of revenues 63% 64% 65%
Note: Please refer to supporting Table 1 for reconciliations of non-GAAP costs and
expenses to GAAP costs and expenses
6
7. Profitability
GAAP
$Millions Q4'06 Q3'07 Q4'07
Income from Operations $1,061 $1,318 $1,441
Operating Margin 33% 31% 30%
Net Income $1,031 $1,070 $1,206
EPS (diluted) $3.29 $3.38 $3.79
Non-GAAP
$Millions Q4'06 Q3'07 Q4'07
Income from Operations $1,195 $1,516 $1,686
Operating Margin 37% 36% 35%
Net Income $997
$ $1,237
$ $1,409
$
EPS (diluted) $3.18 $3.91 $4.43
Note: Please refer to supporting Table 2 for reconciliations of non-GAAP results of operations
pp g p
measures to the nearest comparable GAAP measures
7
8. Free Cash Flow
$Millions Q4'06 Q3'07 Q4'07
Net cash provided by
operating activities $911 $1,633 $1,693
Less purchases of property
and equipment
qp ($
($367)
) ($
($553)
) ($
($678)
)
Free cash flow (Non-GAAP) $544 $1,080 $1,015
8
9. Table 1 - Reconciliations of non-GAAP costs and expenses
to GAAP costs and expenses
As a % of As a % of As a % of
Revenues (1) Revenues (1) Revenues (1)
$Millions Q4'06 Q3'07 Q4'07
Cost of Revenues (GAAP) $ 1,283
1 283 40% $ 1,663
1 663 39% $ 1,956
1 956 41%
Less: Stock-based compensation (11) - (4) - (6) -
Cost of Revenues (non-GAAP) $ 1,272 40% $ 1,659 39% $ 1,950 40%
Research and development (GAAP) $ 387 12% $ 549 13% $ 631 13%
Less: Stock-based compensation (82) - (131) - (161) -
Research and development (non-GAAP)
(non GAAP) $ 305 10% $ 418 10% $ 470 10%
Sales and marketing (GAAP) $ 255 8% $ 381 9% $ 422 9%
Less: Stock-based compensation (14) - (30) - (38) -
Sales and marketing (non-GAAP) $ 241 7% $ 351 8% $ 384 8%
General and administrative (GAAP) $ 220 7% $ 321 8% $ 377 8%
Less: Stock-based compensation (27) - (33) - (40) -
General and administrative (non-GAAP) $ 193 6% $ 288 7% $ 337 7%
Total costs and expenses (GAAP) $ 2,145 67% $ 2,914 69% $ 3,386 71%
Less: Stock-based compensation (134) - (198) - (245) -
Total
T t l costs and expenses (non-GAAP)
t d ( GAAP) $ 2,011
2 011 63% $ 2,716
2 716 64% $ 3,141
3 141 65%
(1) Percentages based on GAAP revenues of $3,205 million in Q4 '06, $4,231 million in Q3 '07 and $4,827 million in Q4 '07
9
10. Table 2 - Reconciliations of non-GAAP results of operations
measures to the nearest comparable GAAP measures
Operating Operating Operating
Margin Margin Margin
(1) (1) (1)
Figures in millions except per share amounts Q4'06 Q3'07 Q4'07
Income from operations (GAAP) $ 1,061 33% $ 1,318 31% $ 1,441 30%
Add: Stock-based compensation 134 - 198 245
Income from operations (non GAAP)
(non-GAAP) $ 1,195
1 195 37% $ 1,516
1 516 36% $ 1,686
1 686 35%
Net income (GAAP) $ 1,031 $ 1,070 $ 1,206
Add: Stock-based compensation (net of tax) 99 167 203
Less: Advanced Pricing Agreement and R&D credit (133) - -
Net income (non-GAAP) $ 997 $ 1,237 $ 1,409
Net income per share - diluted (GAAP) $3.29 $3.38 $3.79
Net income per share - diluted (non-GAAP) $3.18 $3.91 $4.43
Shares used in per share calculation - diluted 313 317 318
(1) Percentages based on GAAP revenues of $3,205 million in Q4 '06, $4,231 million in Q3 '07 and $4,827 million in Q4 '07
10