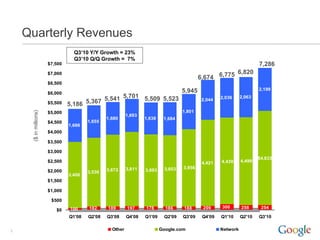
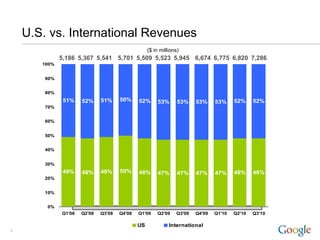
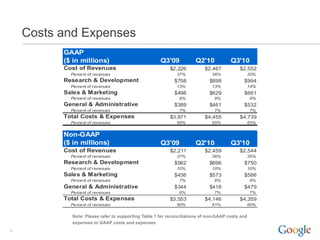
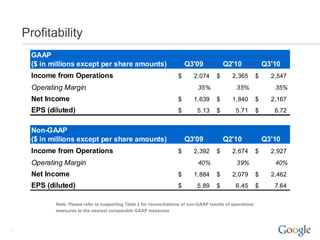
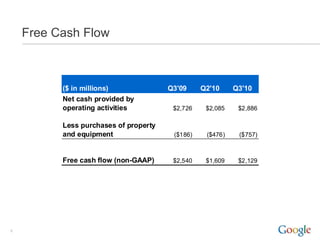
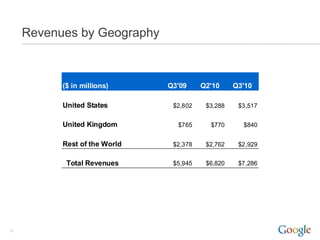
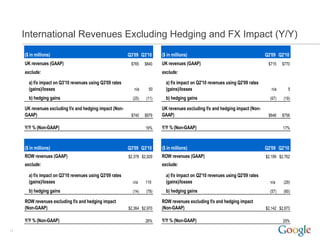
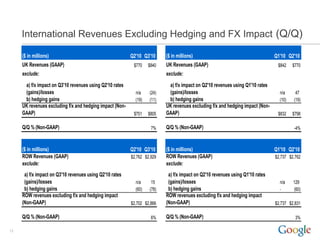
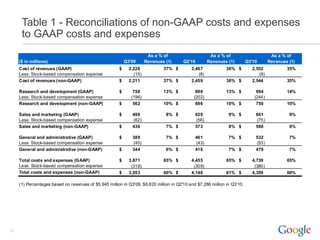
Q3 2010
Quarterly Earnings
    Summary
Third Quarter 2010 Highlights
    • Revenue growth of 23% Y/Y and 7% Q/Q
      –   Google properties revenue increased 22% Y/Y and 7% Q/Q
      –   Network revenues increased 22% Y/Y and 7% Q/Q
      –   International revenues were $3.8 billion


    • Operational Highlights
      –   Strong financial metrics: revenue growth, profitability and cash flow

      –   Continuing to invest heavily in our growth agenda

          •    Investing in People -- to attract, retain, and reward the best talent

          •    Investing in Products -- to leverage computer science to solve big problems


2
Quarterly Revenues
                                  Q3’10 Y/Y Growth = 23%
                                  Q3’10 Q/Q Growth = 7%
                       $7,500                                                                                          7,286
                       $7,000                                                                           6,820
                                                                                            6,674 6,775
                       $6,500
                                                                                    5,945                              2,199
                       $6,000
                                                  5,701 5,509 5,523                                  2,036     2,063
                       $5,500   5,186 5,367 5,541                                            2,044

                       $5,000                                                       1,801
     ($ in millions)


                                                          1,693
                                                1,680             1,638    1,684
                       $4,500           1,655
                                1,686
                       $4,000

                       $3,500

                       $3,000
                                                                                                                       $4,833
                       $2,500                                                                4,421   4,439     4,499
                                                          3,811             3,653   3,956
                       $2,000           3,530   3,672             3,693
                                3,400
                       $1,500

                       $1,000

                        $500
                                100     182     189       197     178       186     188      209     300       258      254
                          $0
                                Q1'08   Q2'08   Q3'08     Q4'08   Q1'09    Q2'09    Q3'09    Q4'09   Q1'10     Q2'10   Q3'10


3                                                 Other                   Google.com                 Network
U.S. vs. International Revenues
                                                   ($ in millions)
              5,186 5,367 5,541 5,701 5,509 5,523 5,945 6,674 6,775 6,820 7,286
       100%


        90%


        80%
               51%    52%     51%     50%     52%       53%      53%    53%     53%     52%     52%
        70%


        60%


        50%


        40%


        30%
               49%    48%     49%     50%     48%       47%      47%    47%     47%     48%     48%
        20%


        10%


        0%
              Q1'08   Q2'08   Q3'08   Q4'08   Q1'09    Q2'09    Q3'09   Q4'09   Q1'10   Q2'10   Q3'10

                                              US             International
4
Traffic Acquisition Costs
                       $1,900                                                                     40%
                       $1,800
                       $1,700
                       $1,600                                                                     35%
                       $1,500
                       $1,400
                       $1,300 29.2% 28.4%                                                         30%
                       $1,200             27.9%
                                                26.9% 26.9% 27.2% 27.1% 26.6% 26.4% 26.4%
     ($ in millions)


                       $1,100                                                             25.7%
                       $1,000
                                                                                                  25%
                        $900                                                              1,805
                                                                        1,721 1,711 1,732
                        $800                                      1,559
                              1,486 1,474 1,495 1,483 1,436 1,453
                        $700
                        $600                                                                      20%
                        $500
                        $400
                        $300                                                                      15%
                        $200
                        $100
                           $0                                                                     10%
                              Q1'08 Q2'08 Q3'08 Q4'08 Q1'09 Q2'09 Q3'09 Q4'09 Q1'10 Q2'10 Q3'10

                                                TAC          TAC as % of Advertising Revenues
5
Costs and Expenses
          GAAP
          ($ in millions)                            Q3'09           Q2'10            Q3'10
          Cost of Revenues                               $2,226           $2,467          $2,552
            Percent of revenues                              37%             36%                 35%
          Research & Development                           $758             $898            $994
            Percent of revenues                              13%             13%                 14%
          Sales & Marketing                                $498             $629            $661
            Percent of revenues                               8%              9%                 9%
          General & Administrative                         $389             $461            $532
            Percent of revenues                               7%              7%                 7%
          Total Costs & Expenses                         $3,871           $4,455          $4,739
            Percent of revenues                              65%             65%                 65%


          Non-GAAP
          ($ in millions)                            Q3'09           Q2'10            Q3'10
          Cost of Revenues                               $2,211           $2,459          $2,544
            Percent of revenues                              37%             36%                 35%
          Research & Development                           $562             $696            $750
            Percent of revenues                              10%             10%                 10%
          Sales & Marketing                                $436             $573            $586
            Percent of revenues                               7%              8%                 8%
          General & Administrative                         $344             $418            $479
            Percent of revenues                               6%              7%                 7%
          Total Costs & Expenses                         $3,553           $4,146          $4,359
            Percent of revenues                              60%             61%                 60%

            Note: Please refer to supporting Table 1 for reconciliations of non-GAAP costs and
            expenses to GAAP costs and expenses
6
Profitability
      GAAP
      ($ in millions except per share amounts)                             Q3'09             Q2'10                Q3'10
      Income from Operations                                           $      2,074      $      2,365         $     2,547
      Operating Margin                                                          35%               35%                35%
      Net Income                                                       $      1,639      $      1,840         $     2,167
      EPS (diluted)                                                    $        5.13     $        5.71        $      6.72


      Non-GAAP
      ($ in millions except per share amounts)                             Q3'09             Q2'10                Q3'10
      Income from Operations                                           $      2,392      $      2,674         $     2,927
      Operating Margin                                                          40%               39%                40%
      Net Income                                                       $      1,884      $      2,079         $     2,462
      EPS (diluted)                                                    $        5.89     $        6.45        $      7.64

             Note: Please refer to supporting Table 2 for reconciliations of non-GAAP results of operations
             measures to the nearest comparable GAAP measures


7
Free Cash Flow


          ($ in millions)              Q3'09     Q2'10     Q3'10
          Net cash provided by
          operating activities          $2,726    $2,085    $2,886

          Less purchases of property
          and equipment                 ($186)    ($476)    ($757)


          Free cash flow (non-GAAP)     $2,540    $1,609    $2,129


8
Overview of Q3 2010 OI&E and FX

    In Interest and Other Income (Expense), Net, we recognized net income of
    $167M for Q3
    • In Q3, we recognized $172M of interest income earned on our investments and $62M in
    realized gains.

    • We expensed $60M related to our FX cash flow hedging program.

    • Excluding gains related to our FX cash flow hedging program, had foreign exchange rates
    remained constant from Q2 2010 through Q3 2010, our revenue in Q3 2010 would have
    been $9M lower. Excluding gains related to our FX cash flow hedging program, had foreign
    exchange rates remained constant from Q3 2009 through Q3 2010, our revenue in Q3 2010
    would have been $169M higher.

    • In addition, our FX cash flow hedging program allowed us to recognize a benefit of
    approximately $89M to international revenue this quarter.


9
Revenues by Geography


           ($ in millions)     Q3'09     Q2'10     Q3'10

           United States        $2,802    $3,288    $3,517


           United Kingdom        $765      $770      $840


           Rest of the World    $2,378    $2,762    $2,929


            Total Revenues      $5,945    $6,820    $7,286


10
International Revenues Excluding Hedging and FX Impact (Y/Y)
     ($ in millions)                                       Q3'09 Q3'10     ($ in millions)                                       Q2'09 Q2'10
     UK revenues (GAAP)                                     $765    $840   UK revenues (GAAP)                                     $715    $770
     exclude:                                                              exclude:

       a) f/x impact on Q3'10 revenues using Q3'09 rates                     a) f/x impact on Q2'10 revenues using Q2'09 rates
       (gains)/losses                                         n/a     50     (gains)/losses                                         n/a      5
       b) hedging gains                                      (25)   (11)     b) hedging gains                                      (67)   (19)

     UK revenues excluding f/x and hedging impact (Non-                    UK revenues excluding f/x and hedging impact (Non-
     GAAP)                                                  $740    $879   GAAP)                                                  $648    $756

     Y/Y % (Non-GAAP)                                               19%    Y/Y % (Non-GAAP)                                               17%


     ($ in millions)                                       Q3'09 Q3'10     ($ in millions)                                       Q2'09 Q2'10
     ROW revenues (GAAP)                                   $2,378 $2,929   ROW revenues (GAAP)                                   $2,199 $2,762
     exclude:                                                              exclude:

       a) f/x impact on Q3'10 revenues using Q3'09 rates                     a) f/x impact on Q2'10 revenues using Q2'09 rates
       (gains)/losses                                        n/a    119      (gains)/losses                                        n/a    (29)
       b) hedging gains                                      (14)   (78)     b) hedging gains                                      (57)   (60)

     ROW revenues excluding f/x and hedging impact                         ROW revenues excluding f/x and hedging impact
     (Non-GAAP)                                            $2,364 $2,970   (Non-GAAP)                                            $2,142 $2,673

     Y/Y % (Non-GAAP)                                               26%    Y/Y % (Non-GAAP)                                               25%

11
International Revenues Excluding Hedging and FX Impact (Q/Q)

     ($ in millions)                                      Q2'10 Q3'10     ($ in millions)                                      Q1'10 Q2'10
     UK Revenues (GAAP)                                    $770    $840   UK Revenues (GAAP)                                    $842    $770
     exclude:                                                             exclude:
      a) f/x impact on Q3'10 revenues using Q2'10 rates                    a) f/x impact on Q2'10 revenues using Q1'10 rates
      (gains)/losses                                        n/a    (24)    (gains)/losses                                        n/a     47
      b) hedging gains                                      (19)   (11)    b) hedging gains                                      (10)   (19)
     UK revenues excluding f/x and hedging impact (Non-                   UK revenues excluding f/x and hedging impact (Non-
     GAAP)                                                 $751    $805   GAAP)                                                 $832    $798

     Q/Q % (Non-GAAP)                                               7%    Q/Q % (Non-GAAP)                                              -4%


     ($ in millions)                                      Q2'10 Q3'10     ($ in millions)                                      Q1'10 Q2'10
     ROW Revenues (GAAP)                                  $2,762 $2,929   ROW Revenues (GAAP)                                  $2,737 $2,762
     exclude:                                                             exclude:
      a) f/x impact on Q3'10 revenues using Q2'10 rates                    a) f/x impact on Q2'10 revenues using Q1'10 rates
      (gains)/losses                                        n/a     15     (gains)/losses                                        n/a    129
      b) hedging gains                                      (60)   (78)    b) hedging gains                                      -      (60)
     ROW revenues excluding f/x and hedging impact                        ROW revenues excluding f/x and hedging impact
     (Non-GAAP)                                           $2,702 $2,866   (Non-GAAP)                                           $2,737 $2,831

     Q/Q % (Non-GAAP)                                               6%    Q/Q % (Non-GAAP)                                               3%

12
Table 1 - Reconciliations of non-GAAP costs and expenses
      to GAAP costs and expenses
                                                                       As a % of                      As a % of                       As a % of
     ($ in millions)                                       Q3'09      Revenues (1)      Q2'10        Revenues (1)         Q3'10      Revenues (1)
     Cost of revenues (GAAP)                           $     2,226            37% $         2,467             36% $         2,552            35%
     Less: Stock-based compensation expense                    (15)                            (8)                             (8)
     Cost of revenues (non-GAAP)                       $     2,211            37% $         2,459             36% $         2,544            35%

     Research and development (GAAP)                   $       758            13% $           898             13% $           994            14%
     Less: Stock-based compensation expense                   (196)                          (202)                           (244)
     Research and development (non-GAAP)               $       562            10% $           696             10% $           750            10%

     Sales and marketing (GAAP)                        $      498              8% $           629              9% $           661             9%
     Less: Stock-based compensation expense                   (62)                            (56)                            (75)
     Sales and marketing (non-GAAP)                    $      436              7% $           573              8% $           586             8%

     General and administrative (GAAP)                 $      389              7% $           461              7% $           532             7%
     Less: Stock-based compensation expense                   (45)                            (43)                            (53)
     General and administrative (non-GAAP)             $      344              6% $           418              7% $           479             7%

     Total costs and expenses (GAAP)                   $     3,871            65% $         4,455             65% $         4,739            65%
     Less: Stock-based compensation expense                   (318)                          (309)                           (380)
     Total costs and expenses (non-GAAP)               $     3,553            60% $         4,146             61% $         4,359            60%

     (1) Percentages based on revenues of $5,945 million in Q3'09, $6,820 million in Q2'10 and $7,286 million in Q3'10.


13
Table 2 - Reconciliations of non-GAAP results of operations
      measures to the nearest comparable GAAP measures


                                                                           Operating                     Operating                   Operating
 ($ in millions except per share amounts)                       Q3'09      Margin (1)        Q2'10       Margin (1)       Q3'10      Margin (1)
 Income from operations (GAAP)                              $     2,074            35% $       2,365             35% $       2,547          35%
 Add: Stock-based compensation expense                              318                          309                           380
 Income from operations (non-GAAP)                          $     2,392            40% $       2,674             39% $       2,927          40%

 Net income (GAAP)                                          $     1,639                  $     1,840                  $      2,167
 Add: Stock-based compensation expense (net of tax)                 245                          239                           295
 Net income (non-GAAP)                                      $     1,884                  $     2,079                  $      2,462

 Net income per share - diluted (GAAP)                      $      5.13                  $      5.71                  $       6.72
 Net income per share - diluted (non-GAAP)                  $      5.89                  $      6.45                  $       7.64
 Shares used in per share calculation - diluted                     320                         322                           322

 (1) Percentages based on revenues of $5,945 million in Q3'09, $6,820 million in Q2'10 and $7,286 million in Q3'10.


14
Q3 2010
Quarterly Earnings
    Summary

39348363 google-earnings-slides-q3-2010

  • 1.
  • 2.
    Third Quarter 2010Highlights • Revenue growth of 23% Y/Y and 7% Q/Q – Google properties revenue increased 22% Y/Y and 7% Q/Q – Network revenues increased 22% Y/Y and 7% Q/Q – International revenues were $3.8 billion • Operational Highlights – Strong financial metrics: revenue growth, profitability and cash flow – Continuing to invest heavily in our growth agenda • Investing in People -- to attract, retain, and reward the best talent • Investing in Products -- to leverage computer science to solve big problems 2
  • 3.
    Quarterly Revenues Q3’10 Y/Y Growth = 23% Q3’10 Q/Q Growth = 7% $7,500 7,286 $7,000 6,820 6,674 6,775 $6,500 5,945 2,199 $6,000 5,701 5,509 5,523 2,036 2,063 $5,500 5,186 5,367 5,541 2,044 $5,000 1,801 ($ in millions) 1,693 1,680 1,638 1,684 $4,500 1,655 1,686 $4,000 $3,500 $3,000 $4,833 $2,500 4,421 4,439 4,499 3,811 3,653 3,956 $2,000 3,530 3,672 3,693 3,400 $1,500 $1,000 $500 100 182 189 197 178 186 188 209 300 258 254 $0 Q1'08 Q2'08 Q3'08 Q4'08 Q1'09 Q2'09 Q3'09 Q4'09 Q1'10 Q2'10 Q3'10 3 Other Google.com Network
  • 4.
    U.S. vs. InternationalRevenues ($ in millions) 5,186 5,367 5,541 5,701 5,509 5,523 5,945 6,674 6,775 6,820 7,286 100% 90% 80% 51% 52% 51% 50% 52% 53% 53% 53% 53% 52% 52% 70% 60% 50% 40% 30% 49% 48% 49% 50% 48% 47% 47% 47% 47% 48% 48% 20% 10% 0% Q1'08 Q2'08 Q3'08 Q4'08 Q1'09 Q2'09 Q3'09 Q4'09 Q1'10 Q2'10 Q3'10 US International 4
  • 5.
    Traffic Acquisition Costs $1,900 40% $1,800 $1,700 $1,600 35% $1,500 $1,400 $1,300 29.2% 28.4% 30% $1,200 27.9% 26.9% 26.9% 27.2% 27.1% 26.6% 26.4% 26.4% ($ in millions) $1,100 25.7% $1,000 25% $900 1,805 1,721 1,711 1,732 $800 1,559 1,486 1,474 1,495 1,483 1,436 1,453 $700 $600 20% $500 $400 $300 15% $200 $100 $0 10% Q1'08 Q2'08 Q3'08 Q4'08 Q1'09 Q2'09 Q3'09 Q4'09 Q1'10 Q2'10 Q3'10 TAC TAC as % of Advertising Revenues 5
  • 6.
    Costs and Expenses GAAP ($ in millions) Q3'09 Q2'10 Q3'10 Cost of Revenues $2,226 $2,467 $2,552 Percent of revenues 37% 36% 35% Research & Development $758 $898 $994 Percent of revenues 13% 13% 14% Sales & Marketing $498 $629 $661 Percent of revenues 8% 9% 9% General & Administrative $389 $461 $532 Percent of revenues 7% 7% 7% Total Costs & Expenses $3,871 $4,455 $4,739 Percent of revenues 65% 65% 65% Non-GAAP ($ in millions) Q3'09 Q2'10 Q3'10 Cost of Revenues $2,211 $2,459 $2,544 Percent of revenues 37% 36% 35% Research & Development $562 $696 $750 Percent of revenues 10% 10% 10% Sales & Marketing $436 $573 $586 Percent of revenues 7% 8% 8% General & Administrative $344 $418 $479 Percent of revenues 6% 7% 7% Total Costs & Expenses $3,553 $4,146 $4,359 Percent of revenues 60% 61% 60% Note: Please refer to supporting Table 1 for reconciliations of non-GAAP costs and expenses to GAAP costs and expenses 6
  • 7.
    Profitability GAAP ($ in millions except per share amounts) Q3'09 Q2'10 Q3'10 Income from Operations $ 2,074 $ 2,365 $ 2,547 Operating Margin 35% 35% 35% Net Income $ 1,639 $ 1,840 $ 2,167 EPS (diluted) $ 5.13 $ 5.71 $ 6.72 Non-GAAP ($ in millions except per share amounts) Q3'09 Q2'10 Q3'10 Income from Operations $ 2,392 $ 2,674 $ 2,927 Operating Margin 40% 39% 40% Net Income $ 1,884 $ 2,079 $ 2,462 EPS (diluted) $ 5.89 $ 6.45 $ 7.64 Note: Please refer to supporting Table 2 for reconciliations of non-GAAP results of operations measures to the nearest comparable GAAP measures 7
  • 8.
    Free Cash Flow ($ in millions) Q3'09 Q2'10 Q3'10 Net cash provided by operating activities $2,726 $2,085 $2,886 Less purchases of property and equipment ($186) ($476) ($757) Free cash flow (non-GAAP) $2,540 $1,609 $2,129 8
  • 9.
    Overview of Q32010 OI&E and FX In Interest and Other Income (Expense), Net, we recognized net income of $167M for Q3 • In Q3, we recognized $172M of interest income earned on our investments and $62M in realized gains. • We expensed $60M related to our FX cash flow hedging program. • Excluding gains related to our FX cash flow hedging program, had foreign exchange rates remained constant from Q2 2010 through Q3 2010, our revenue in Q3 2010 would have been $9M lower. Excluding gains related to our FX cash flow hedging program, had foreign exchange rates remained constant from Q3 2009 through Q3 2010, our revenue in Q3 2010 would have been $169M higher. • In addition, our FX cash flow hedging program allowed us to recognize a benefit of approximately $89M to international revenue this quarter. 9
  • 10.
    Revenues by Geography ($ in millions) Q3'09 Q2'10 Q3'10 United States $2,802 $3,288 $3,517 United Kingdom $765 $770 $840 Rest of the World $2,378 $2,762 $2,929 Total Revenues $5,945 $6,820 $7,286 10
  • 11.
    International Revenues ExcludingHedging and FX Impact (Y/Y) ($ in millions) Q3'09 Q3'10 ($ in millions) Q2'09 Q2'10 UK revenues (GAAP) $765 $840 UK revenues (GAAP) $715 $770 exclude: exclude: a) f/x impact on Q3'10 revenues using Q3'09 rates a) f/x impact on Q2'10 revenues using Q2'09 rates (gains)/losses n/a 50 (gains)/losses n/a 5 b) hedging gains (25) (11) b) hedging gains (67) (19) UK revenues excluding f/x and hedging impact (Non- UK revenues excluding f/x and hedging impact (Non- GAAP) $740 $879 GAAP) $648 $756 Y/Y % (Non-GAAP) 19% Y/Y % (Non-GAAP) 17% ($ in millions) Q3'09 Q3'10 ($ in millions) Q2'09 Q2'10 ROW revenues (GAAP) $2,378 $2,929 ROW revenues (GAAP) $2,199 $2,762 exclude: exclude: a) f/x impact on Q3'10 revenues using Q3'09 rates a) f/x impact on Q2'10 revenues using Q2'09 rates (gains)/losses n/a 119 (gains)/losses n/a (29) b) hedging gains (14) (78) b) hedging gains (57) (60) ROW revenues excluding f/x and hedging impact ROW revenues excluding f/x and hedging impact (Non-GAAP) $2,364 $2,970 (Non-GAAP) $2,142 $2,673 Y/Y % (Non-GAAP) 26% Y/Y % (Non-GAAP) 25% 11
  • 12.
    International Revenues ExcludingHedging and FX Impact (Q/Q) ($ in millions) Q2'10 Q3'10 ($ in millions) Q1'10 Q2'10 UK Revenues (GAAP) $770 $840 UK Revenues (GAAP) $842 $770 exclude: exclude: a) f/x impact on Q3'10 revenues using Q2'10 rates a) f/x impact on Q2'10 revenues using Q1'10 rates (gains)/losses n/a (24) (gains)/losses n/a 47 b) hedging gains (19) (11) b) hedging gains (10) (19) UK revenues excluding f/x and hedging impact (Non- UK revenues excluding f/x and hedging impact (Non- GAAP) $751 $805 GAAP) $832 $798 Q/Q % (Non-GAAP) 7% Q/Q % (Non-GAAP) -4% ($ in millions) Q2'10 Q3'10 ($ in millions) Q1'10 Q2'10 ROW Revenues (GAAP) $2,762 $2,929 ROW Revenues (GAAP) $2,737 $2,762 exclude: exclude: a) f/x impact on Q3'10 revenues using Q2'10 rates a) f/x impact on Q2'10 revenues using Q1'10 rates (gains)/losses n/a 15 (gains)/losses n/a 129 b) hedging gains (60) (78) b) hedging gains - (60) ROW revenues excluding f/x and hedging impact ROW revenues excluding f/x and hedging impact (Non-GAAP) $2,702 $2,866 (Non-GAAP) $2,737 $2,831 Q/Q % (Non-GAAP) 6% Q/Q % (Non-GAAP) 3% 12
  • 13.
    Table 1 -Reconciliations of non-GAAP costs and expenses to GAAP costs and expenses As a % of As a % of As a % of ($ in millions) Q3'09 Revenues (1) Q2'10 Revenues (1) Q3'10 Revenues (1) Cost of revenues (GAAP) $ 2,226 37% $ 2,467 36% $ 2,552 35% Less: Stock-based compensation expense (15) (8) (8) Cost of revenues (non-GAAP) $ 2,211 37% $ 2,459 36% $ 2,544 35% Research and development (GAAP) $ 758 13% $ 898 13% $ 994 14% Less: Stock-based compensation expense (196) (202) (244) Research and development (non-GAAP) $ 562 10% $ 696 10% $ 750 10% Sales and marketing (GAAP) $ 498 8% $ 629 9% $ 661 9% Less: Stock-based compensation expense (62) (56) (75) Sales and marketing (non-GAAP) $ 436 7% $ 573 8% $ 586 8% General and administrative (GAAP) $ 389 7% $ 461 7% $ 532 7% Less: Stock-based compensation expense (45) (43) (53) General and administrative (non-GAAP) $ 344 6% $ 418 7% $ 479 7% Total costs and expenses (GAAP) $ 3,871 65% $ 4,455 65% $ 4,739 65% Less: Stock-based compensation expense (318) (309) (380) Total costs and expenses (non-GAAP) $ 3,553 60% $ 4,146 61% $ 4,359 60% (1) Percentages based on revenues of $5,945 million in Q3'09, $6,820 million in Q2'10 and $7,286 million in Q3'10. 13
  • 14.
    Table 2 -Reconciliations of non-GAAP results of operations measures to the nearest comparable GAAP measures Operating Operating Operating ($ in millions except per share amounts) Q3'09 Margin (1) Q2'10 Margin (1) Q3'10 Margin (1) Income from operations (GAAP) $ 2,074 35% $ 2,365 35% $ 2,547 35% Add: Stock-based compensation expense 318 309 380 Income from operations (non-GAAP) $ 2,392 40% $ 2,674 39% $ 2,927 40% Net income (GAAP) $ 1,639 $ 1,840 $ 2,167 Add: Stock-based compensation expense (net of tax) 245 239 295 Net income (non-GAAP) $ 1,884 $ 2,079 $ 2,462 Net income per share - diluted (GAAP) $ 5.13 $ 5.71 $ 6.72 Net income per share - diluted (non-GAAP) $ 5.89 $ 6.45 $ 7.64 Shares used in per share calculation - diluted 320 322 322 (1) Percentages based on revenues of $5,945 million in Q3'09, $6,820 million in Q2'10 and $7,286 million in Q3'10. 14
  • 15.