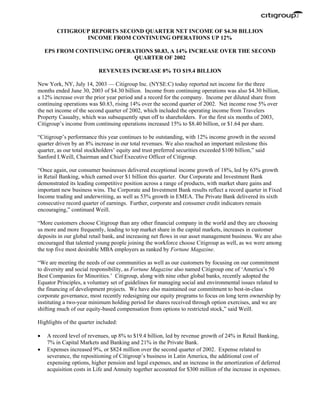
Citigroup reported strong financial results for the second quarter of 2003, with net income of $4.30 billion, up 12% from the previous year. Income per share was $0.83, rising 14% over 2002. Several business lines saw significant income growth, including Retail Banking income up 63% and the Private Bank's sixth consecutive record quarter. However, some international operations struggled, with income down 24% in Japan. Overall, Citigroup achieved record revenues of $19.4 billion for the quarter, up 8% from the prior year, demonstrating continued strong performance.
JPMORGAN CHASE REPORTS THIRD-QUARTER 2013 NET LOSS OF $0.4 BILLION, OR $(0.17) PER SHARE, ON REVENUE1 OF $23.9 BILLION
THIRD-QUARTER 2013 NET INCOME OF $5.8 BILLION, OR $1.42 PER SHARE, EXCLUDING LITIGATION EXPENSE AND RESERVE RELEASES1
Similar to citigroup July 14, 2003 - Second Quarter Press Release (20)
The Evolution of Non-Banking Financial Companies (NBFCs) in India: Challenges...beulahfernandes8
Role in Financial System
NBFCs are critical in bridging the financial inclusion gap.
They provide specialized financial services that cater to segments often neglected by traditional banks.
Economic Impact
NBFCs contribute significantly to India's GDP.
They support sectors like micro, small, and medium enterprises (MSMEs), housing finance, and personal loans.
BYD SWOT Analysis and In-Depth Insights 2024.pptxmikemetalprod
Indepth analysis of the BYD 2024
BYD (Build Your Dreams) is a Chinese automaker and battery manufacturer that has snowballed over the past two decades to become a significant player in electric vehicles and global clean energy technology.
This SWOT analysis examines BYD's strengths, weaknesses, opportunities, and threats as it competes in the fast-changing automotive and energy storage industries.
Founded in 1995 and headquartered in Shenzhen, BYD started as a battery company before expanding into automobiles in the early 2000s.
Initially manufacturing gasoline-powered vehicles, BYD focused on plug-in hybrid and fully electric vehicles, leveraging its expertise in battery technology.
Today, BYD is the world’s largest electric vehicle manufacturer, delivering over 1.2 million electric cars globally. The company also produces electric buses, trucks, forklifts, and rail transit.
On the energy side, BYD is a major supplier of rechargeable batteries for cell phones, laptops, electric vehicles, and energy storage systems.
The secret way to sell pi coins effortlessly.DOT TECH
Well as we all know pi isn't launched yet. But you can still sell your pi coins effortlessly because some whales in China are interested in holding massive pi coins. And they are willing to pay good money for it. If you are interested in selling I will leave a contact for you. Just telegram this number below. I sold about 3000 pi coins to him and he paid me immediately.
Telegram: @Pi_vendor_247
Poonawalla Fincorp and IndusInd Bank Introduce New Co-Branded Credit Cardnickysharmasucks
The unveiling of the IndusInd Bank Poonawalla Fincorp eLITE RuPay Platinum Credit Card marks a notable milestone in the Indian financial landscape, showcasing a successful partnership between two leading institutions, Poonawalla Fincorp and IndusInd Bank. This co-branded credit card not only offers users a plethora of benefits but also reflects a commitment to innovation and adaptation. With a focus on providing value-driven and customer-centric solutions, this launch represents more than just a new product—it signifies a step towards redefining the banking experience for millions. Promising convenience, rewards, and a touch of luxury in everyday financial transactions, this collaboration aims to cater to the evolving needs of customers and set new standards in the industry.
how to sell pi coins effectively (from 50 - 100k pi)DOT TECH
Anywhere in the world, including Africa, America, and Europe, you can sell Pi Network Coins online and receive cash through online payment options.
Pi has not yet been launched on any exchange because we are currently using the confined Mainnet. The planned launch date for Pi is June 28, 2026.
Reselling to investors who want to hold until the mainnet launch in 2026 is currently the sole way to sell.
Consequently, right now. All you need to do is select the right pi network provider.
Who is a pi merchant?
An individual who buys coins from miners on the pi network and resells them to investors hoping to hang onto them until the mainnet is launched is known as a pi merchant.
debuts.
I'll provide you the Telegram username
@Pi_vendor_247
what is the best method to sell pi coins in 2024DOT TECH
The best way to sell your pi coins safely is trading with an exchange..but since pi is not launched in any exchange, and second option is through a VERIFIED pi merchant.
Who is a pi merchant?
A pi merchant is someone who buys pi coins from miners and pioneers and resell them to Investors looking forward to hold massive amounts before mainnet launch in 2026.
I will leave the telegram contact of my personal pi merchant to trade pi coins with.
@Pi_vendor_247
Currently pi network is not tradable on binance or any other exchange because we are still in the enclosed mainnet.
Right now the only way to sell pi coins is by trading with a verified merchant.
What is a pi merchant?
A pi merchant is someone verified by pi network team and allowed to barter pi coins for goods and services.
Since pi network is not doing any pre-sale The only way exchanges like binance/huobi or crypto whales can get pi is by buying from miners. And a merchant stands in between the exchanges and the miners.
I will leave the telegram contact of my personal pi merchant. I and my friends has traded more than 6000pi coins successfully
Tele-gram
@Pi_vendor_247
what is the future of Pi Network currency.DOT TECH
The future of the Pi cryptocurrency is uncertain, and its success will depend on several factors. Pi is a relatively new cryptocurrency that aims to be user-friendly and accessible to a wide audience. Here are a few key considerations for its future:
Message: @Pi_vendor_247 on telegram if u want to sell PI COINS.
1. Mainnet Launch: As of my last knowledge update in January 2022, Pi was still in the testnet phase. Its success will depend on a successful transition to a mainnet, where actual transactions can take place.
2. User Adoption: Pi's success will be closely tied to user adoption. The more users who join the network and actively participate, the stronger the ecosystem can become.
3. Utility and Use Cases: For a cryptocurrency to thrive, it must offer utility and practical use cases. The Pi team has talked about various applications, including peer-to-peer transactions, smart contracts, and more. The development and implementation of these features will be essential.
4. Regulatory Environment: The regulatory environment for cryptocurrencies is evolving globally. How Pi navigates and complies with regulations in various jurisdictions will significantly impact its future.
5. Technology Development: The Pi network must continue to develop and improve its technology, security, and scalability to compete with established cryptocurrencies.
6. Community Engagement: The Pi community plays a critical role in its future. Engaged users can help build trust and grow the network.
7. Monetization and Sustainability: The Pi team's monetization strategy, such as fees, partnerships, or other revenue sources, will affect its long-term sustainability.
It's essential to approach Pi or any new cryptocurrency with caution and conduct due diligence. Cryptocurrency investments involve risks, and potential rewards can be uncertain. The success and future of Pi will depend on the collective efforts of its team, community, and the broader cryptocurrency market dynamics. It's advisable to stay updated on Pi's development and follow any updates from the official Pi Network website or announcements from the team.
The European Unemployment Puzzle: implications from population agingGRAPE
We study the link between the evolving age structure of the working population and unemployment. We build a large new Keynesian OLG model with a realistic age structure, labor market frictions, sticky prices, and aggregate shocks. Once calibrated to the European economy, we quantify the extent to which demographic changes over the last three decades have contributed to the decline of the unemployment rate. Our findings yield important implications for the future evolution of unemployment given the anticipated further aging of the working population in Europe. We also quantify the implications for optimal monetary policy: lowering inflation volatility becomes less costly in terms of GDP and unemployment volatility, which hints that optimal monetary policy may be more hawkish in an aging society. Finally, our results also propose a partial reversal of the European-US unemployment puzzle due to the fact that the share of young workers is expected to remain robust in the US.
Empowering the Unbanked: The Vital Role of NBFCs in Promoting Financial Inclu...Vighnesh Shashtri
In India, financial inclusion remains a critical challenge, with a significant portion of the population still unbanked. Non-Banking Financial Companies (NBFCs) have emerged as key players in bridging this gap by providing financial services to those often overlooked by traditional banking institutions. This article delves into how NBFCs are fostering financial inclusion and empowering the unbanked.
how to swap pi coins to foreign currency withdrawable.DOT TECH
As of my last update, Pi is still in the testing phase and is not tradable on any exchanges.
However, Pi Network has announced plans to launch its Testnet and Mainnet in the future, which may include listing Pi on exchanges.
The current method for selling pi coins involves exchanging them with a pi vendor who purchases pi coins for investment reasons.
If you want to sell your pi coins, reach out to a pi vendor and sell them to anyone looking to sell pi coins from any country around the globe.
Below is the contact information for my personal pi vendor.
Telegram: @Pi_vendor_247
when will pi network coin be available on crypto exchange.DOT TECH
There is no set date for when Pi coins will enter the market.
However, the developers are working hard to get them released as soon as possible.
Once they are available, users will be able to exchange other cryptocurrencies for Pi coins on designated exchanges.
But for now the only way to sell your pi coins is through verified pi vendor.
Here is the telegram contact of my personal pi vendor
@Pi_vendor_247
Financial Assets: Debit vs Equity Securities.pptxWrito-Finance
financial assets represent claim for future benefit or cash. Financial assets are formed by establishing contracts between participants. These financial assets are used for collection of huge amounts of money for business purposes.
Two major Types: Debt Securities and Equity Securities.
Debt Securities are Also known as fixed-income securities or instruments. The type of assets is formed by establishing contracts between investor and issuer of the asset.
• The first type of Debit securities is BONDS. Bonds are issued by corporations and government (both local and national government).
• The second important type of Debit security is NOTES. Apart from similarities associated with notes and bonds, notes have shorter term maturity.
• The 3rd important type of Debit security is TRESURY BILLS. These securities have short-term ranging from three months, six months, and one year. Issuer of such securities are governments.
• Above discussed debit securities are mostly issued by governments and corporations. CERTIFICATE OF DEPOSITS CDs are issued by Banks and Financial Institutions. Risk factor associated with CDs gets reduced when issued by reputable institutions or Banks.
Following are the risk attached with debt securities: Credit risk, interest rate risk and currency risk
There are no fixed maturity dates in such securities, and asset’s value is determined by company’s performance. There are two major types of equity securities: common stock and preferred stock.
Common Stock: These are simple equity securities and bear no complexities which the preferred stock bears. Holders of such securities or instrument have the voting rights when it comes to select the company’s board of director or the business decisions to be made.
Preferred Stock: Preferred stocks are sometime referred to as hybrid securities, because it contains elements of both debit security and equity security. Preferred stock confers ownership rights to security holder that is why it is equity instrument
<a href="https://www.writofinance.com/equity-securities-features-types-risk/" >Equity securities </a> as a whole is used for capital funding for companies. Companies have multiple expenses to cover. Potential growth of company is required in competitive market. So, these securities are used for capital generation, and then uses it for company’s growth.
Concluding remarks
Both are employed in business. Businesses are often established through debit securities, then what is the need for equity securities. Companies have to cover multiple expenses and expansion of business. They can also use equity instruments for repayment of debits. So, there are multiple uses for securities. As an investor, you need tools for analysis. Investment decisions are made by carefully analyzing the market. For better analysis of the stock market, investors often employ financial analysis of companies.
USDA Loans in California: A Comprehensive Overview.pptxmarketing367770
USDA Loans in California: A Comprehensive Overview
If you're dreaming of owning a home in California's rural or suburban areas, a USDA loan might be the perfect solution. The U.S. Department of Agriculture (USDA) offers these loans to help low-to-moderate-income individuals and families achieve homeownership.
Key Features of USDA Loans:
Zero Down Payment: USDA loans require no down payment, making homeownership more accessible.
Competitive Interest Rates: These loans often come with lower interest rates compared to conventional loans.
Flexible Credit Requirements: USDA loans have more lenient credit score requirements, helping those with less-than-perfect credit.
Guaranteed Loan Program: The USDA guarantees a portion of the loan, reducing risk for lenders and expanding borrowing options.
Eligibility Criteria:
Location: The property must be located in a USDA-designated rural or suburban area. Many areas in California qualify.
Income Limits: Applicants must meet income guidelines, which vary by region and household size.
Primary Residence: The home must be used as the borrower's primary residence.
Application Process:
Find a USDA-Approved Lender: Not all lenders offer USDA loans, so it's essential to choose one approved by the USDA.
Pre-Qualification: Determine your eligibility and the amount you can borrow.
Property Search: Look for properties in eligible rural or suburban areas.
Loan Application: Submit your application, including financial and personal information.
Processing and Approval: The lender and USDA will review your application. If approved, you can proceed to closing.
USDA loans are an excellent option for those looking to buy a home in California's rural and suburban areas. With no down payment and flexible requirements, these loans make homeownership more attainable for many families. Explore your eligibility today and take the first step toward owning your dream home.
citigroup July 14, 2003 - Second Quarter Press Release
1. CITIGROUP REPORTS SECOND QUARTER NET INCOME OF $4.30 BILLION
INCOME FROM CONTINUING OPERATIONS UP 12%
EPS FROM CONTINUING OPERATIONS $0.83, A 14% INCREASE OVER THE SECOND
QUARTER OF 2002
REVENUES INCREASE 8% TO $19.4 BILLION
New York, NY, July 14, 2003 — Citigroup Inc. (NYSE:C) today reported net income for the three
months ended June 30, 2003 of $4.30 billion. Income from continuing operations was also $4.30 billion,
a 12% increase over the prior year period and a record for the company. Income per diluted share from
continuing operations was $0.83, rising 14% over the second quarter of 2002. Net income rose 5% over
the net income of the second quarter of 2002, which included the operating income from Travelers
Property Casualty, which was subsequently spun off to shareholders. For the first six months of 2003,
Citigroup’s income from continuing operations increased 15% to $8.40 billion, or $1.64 per share.
“Citigroup’s performance this year continues to be outstanding, with 12% income growth in the second
quarter driven by an 8% increase in our total revenues. We also reached an important milestone this
quarter, as our total stockholders’ equity and trust preferred securities exceeded $100 billion,” said
Sanford I.Weill, Chairman and Chief Executive Officer of Citigroup.
“Once again, our consumer businesses delivered exceptional income growth of 18%, led by 63% growth
in Retail Banking, which earned over $1 billion this quarter. Our Corporate and Investment Bank
demonstrated its leading competitive position across a range of products, with market share gains and
important new business wins. The Corporate and Investment Bank results reflect a record quarter in Fixed
Income trading and underwriting, as well as 53% growth in EMEA. The Private Bank delivered its sixth
consecutive record quarter of earnings. Further, corporate and consumer credit indicators remain
encouraging,” continued Weill.
“More customers choose Citigroup than any other financial company in the world and they are choosing
us more and more frequently, leading to top market share in the capital markets, increases in customer
deposits in our global retail bank, and increasing net flows in our asset management business. We are also
encouraged that talented young people joining the workforce choose Citigroup as well, as we were among
the top five most desirable MBA employers as ranked by Fortune Magazine.
“We are meeting the needs of our communities as well as our customers by focusing on our commitment
to diversity and social responsibility, as Fortune Magazine also named Citigroup one of ‘America’s 50
Best Companies for Minorities.’ Citigroup, along with nine other global banks, recently adopted the
Equator Principles, a voluntary set of guidelines for managing social and environmental issues related to
the financing of development projects. We have also maintained our commitment to best-in-class
corporate governance, most recently redesigning our equity programs to focus on long term ownership by
instituting a two-year minimum holding period for shares received through option exercises, and we are
shifting much of our equity-based compensation from options to restricted stock,” said Weill.
Highlights of the quarter included:
• A record level of revenues, up 8% to $19.4 billion, led by revenue growth of 24% in Retail Banking,
7% in Capital Markets and Banking and 21% in the Private Bank.
• Expenses increased 9%, or $824 million over the second quarter of 2002. Expense related to
severance, the repositioning of Citigroup’s business in Latin America, the additional cost of
expensing options, higher pension and legal expenses, and an increase in the amortization of deferred
acquisition costs in Life and Annuity together accounted for $300 million of the increase in expenses.
2. • Citigroup’s Global Corporate and Investment Bank maintained its number one ranking in Global Debt
and Equity for the seventh consecutive quarter and continued to rank first in Disclosed Fees and
Investment Grade Debt, as well as posting strong positions in High Yield, Global Equities and
Announced M&A.
• Credit quality indicators have remained stable for both the consumer and corporate portfolios.
Citigroup’s provision for credit losses was $2.19 billion in the second quarter. Loss rates in the
Global Consumer managed loan portfolio increased by 12 basis points, to 3.26%, reflecting the
seasonal nature of US card losses as well as higher losses in Germany and Japan. Consumer managed
delinquencies, as measured by loans 90 days past due, were down slightly from the first quarter. In
the Global Corporate and Investment Bank, the provision for loan losses increased by $182 million
from the prior quarter, as a result of specific reserves being established in the quarter for several
borrowers. Corporate cash basis loans increased modestly from the prior quarter due to the addition
of several merchant energy, airline and telecom-related credits. Citigroup’s reserve for credit losses
was $11.73 billion at the end of the second quarter.
• Citigroup’s stockholders’ equity and trust preferred securities reached $100 billion at June 30, 2003.
The company’s return on equity was 19.2%. Citigroup repurchased 8.9 million shares during the
second quarter, bringing the total number of shares repurchased year to date to 43.2 million.
GLOBAL CONSUMER
Income of $2.30 billion for the second quarter, up 18%. Highlights included:
• Cards income increased 6% to $768 million. North America income grew 9%, as revenue increased
5% driven by 4% growth in average managed receivables. The level of managed receivables reflected
changes in acquisition marketing strategies to improve yields as well as the sale of $1.7 billion in
non-strategic portfolios. Expenses rose 8%, primarily related to marketing and advertising as well as
initial costs for the Home Depot portfolio, which will be acquired in the third quarter. Credit loss
rates improved from the prior year. International Cards income declined 7%, primarily due to a
reserve release in the prior year quarter. Excluding the reserve release, income increased 12%, driven
by strong growth in Asia and EMEA, comparable loss rates and flat expenses.
• Income for Consumer Finance decreased 11%, to $508 million, driven by a 28% decline in
International Consumer Finance income. In North America, income rose 1%, with revenue growth of
7% driven by 13% receivables growth, including the auto finance business of Golden State Bancorp,
partly offset by a decline in insurance revenues. Expenses increased 11%, driven by higher volumes
and the addition of the Golden State portfolio. Loss rates and delinquencies continued to improve
from both the prior year and the first quarter. International Consumer Finance results reflected
continued difficult business conditions in Japan, offsetting strong results in Europe. The portfolios in
Japan contracted in the quarter due to weak loan demand and higher pay-downs and charge-offs.
Credit costs continue to be adversely impacted by rising bankruptcies. International results also
included a $94 million release of a tax reserve related to a settlement with tax authorities.
• Retail Banking income advanced 63% to $1.05 billion. Income for North America increased 67%,
resulting from record earnings in the mortgage business, the addition of Golden State Bancorp and
strong results in Mexico. Mortgage originations in the company’s Consumer Assets Division doubled
to $23.5 billion and customer deposits in Citibanking North America rose 38%, reflecting the addition
of Golden State as well as organic growth. International Retail Banking income increased 52% with
strong performance across most regions, particularly in Asia, which had increased investment product
sales, and the reduction of losses in Argentina.
GLOBAL CORPORATE AND INVESTMENT BANK
Income of $1.34 billion for the second quarter, up 2%. Highlights included:
• Capital Markets and Banking income increased 2% to $1.2 billion, from a strong quarter in the prior
year. Revenue growth of 7% was driven by record performance in fixed income, which offset lower
equities revenues. Expenses rose 15%, reflecting costs associated with the repositioning of the
company’s business in Latin America, increased incentive compensation expense and higher legal
fees. The provision for credit losses, at $286 million, increased by $24 million from the prior year.
2
3. • Income for Transaction Services, which includes Cash, Trade, Treasury Services, and Global
Securities Services, was $187 million, a 13% decrease from the second quarter of 2002. Revenues
fell 6%, reflecting lower investment gains as well as the continued decline in market values and
interest rates, and a lower level of market activity as compared to the prior year. Expense growth was
held to 1%, reflecting lower headcount and continued efficiency gains. Customer liability balances
increased 14%, to $96 billion, while assets under custody reached $5.6 trillion, a 4% increase over the
prior year.
PRIVATE CLIENT SERVICES
Income of $181 million for the second quarter, down 19%. Difficult equity market conditions continued
to impact results. Total expenses declined 4%, and the business continued to produce an industry-leading
pre-tax margin of 20%. Income rose 15% from the first quarter of 2003 as major market indexes
increased during the second quarter, driving higher transaction volumes. Revenue per Financial
Consultant was $467,000, declining 3% from the prior year, but up 9% from the first quarter. Client assets
totaled $959 billion at the end of the second quarter, and balances in Smith Barney’s bank deposit
program were $42 billion. Net flows in the quarter were $9 billion, unchanged from the prior year period
and an 80% increase from the first quarter.
GLOBAL INVESTMENT MANAGEMENT
Income of $432 million for the second quarter, up 16%. Highlights included:
• Life Insurance and Annuities income of $190 million represented a 39% increase over the prior year,
which included significant realized investment losses. Income for Travelers Life and Annuity
increased 97%, reflecting lower net realized losses and higher business volumes partially offset by
lower net investment yields as well as higher amortization of deferred acquisition costs. Both
individual and group annuity balances increased 5% over the prior year, while life insurance account
balances rose 16%. International Insurance Manufacturing income fell by $32 million.
• The Private Bank’s income was $138 million, increasing 22% over the prior year, the sixth
consecutive record income quarter. Revenues rose 21% on the strength of higher sales volumes of
alternative investment products as well as increased client trading activity and lending. Regionally,
results were strong in the US, Asia, Japan and Latin America. Client business volumes were $180
billion, a 10% increase over the second quarter of 2002.
• Income for Asset Management, which includes Retirement Services, was $104 million, declining 14%
from the second quarter of 2002. Revenues fell 13%, as the impact of positive net flows was offset
by weakness in global equity markets as compared to a year ago and the impact of product mix
changes. Continued rigorous expense management led to an 11% decline in total expenses, resulting
in a pre-tax margin of 36%. Assets under management increased 12% to $493 billion, boosted by
cumulative net inflows of $12 billion, positive market action in the second quarter, and the inclusion
of the investment portfolio of Travelers Property Casualty, which Citigroup manages on a third party
basis. Citigroup Asset Management’s share of proprietary distribution channels was 73% in
Primerica Financial Services, 26% in Smith Barney, and 40% in Citibanking North America.
CITIGROUP INTERNATIONAL
Income for Citigroup’s international operations increased 8% to $1.33 billion from the second quarter of
2002. Results for the quarter, which are fully reflected in the product disclosures above, included:
Europe, Middle East and Africa (EMEA) income of $517 million advanced 36% over the prior year.
•
Income from the corporate and investment bank rose 53% reflecting a continued positive environment
for fixed income trading and underwriting and improved investment banking results combined with
tight cost controls. Consumer income rose 16% to $169 million on the strength of 25% loan growth
across the region.
Asia’s income totaled $429 million, a 10% increase over the prior year. Consumer income rose 25%
•
on the strength of 13% revenue growth, with strong growth in cards and retail banking, led by
investment product sales. Corporate and investment bank income declined 6%.
3
4. • Japan’s income fell 24% from the second quarter of 2002, to $204 million driven primarily by the
declining results from the company’s consumer finance business there, where both loan volumes and
yields have continued to contract while the provision for loan losses increased. Results for the quarter
included a $94 million release of a tax reserve related to settlement with tax authorities.
• Latin America generated income of $178 million, representing a 3% decline from the prior year.
Results included costs associated with the repositioning of the company’s businesses in the region.
Consumer results rebounded from a loss in the second quarter of 2002, as the prior year’s results
reflected the devaluation and ensuing credit losses in Argentina. Income for the corporate and
investment bank decreased 10% due to a very strong quarter the prior year in sales and trading.
PROPRIETARY INVESTMENT ACTIVITIES AND CORPORATE/OTHER
For the second quarter of 2003, Citigroup’s Proprietary Investment Activities recorded income of $27
million, reflecting both realized gains and higher public market valuations in the US partly offset by
writedowns in the emerging markets portfolios. Corporate/other income was $25 million in the quarter, a
$16 million decline from the prior year. Treasury results continue to benefit from low interest rates and a
steep yield curve.
Citigroup (NYSE: C), the preeminent global financial services company with some 200 million customer accounts in more than 100 countries,
provides consumers, corporations, governments and institutions with a broad range of financial products and services, including consumer
banking and credit, corporate and investment banking, insurance, securities brokerage, and asset management. Major brand names under
Citigroup’s trademark red umbrella include Citibank, CitiFinancial, Primerica, Smith Barney, Banamex, and Travelers Life and Annuity.
Additional information may be found at: www.citigroup.com
A financial summary follows. Additional financial, statistical and business-related information, as well as business and segment trends, is
included in a Financial Supplement. Both the earnings release and the Financial Supplement are available on Citigroup’s web site
(http://www.citigroup.com). This document can also be obtained by calling 1-800-853-1754 within the United States or 732-935-2771 outside
the United States.
Certain statements in this document are “forward-looking statements” within the meaning of the Private Securities Litigation Reform Act. These
statements are based on management’s current expectations and are subject to uncertainty and changes in circumstances. Actual results may
differ materially from those included in these statements due to a variety of factors. More information about these factors is contained in
Citigroup’s filings with the Securities and Exchange Commission.
Contacts:
Press: Leah Johnson (212) 559-9446
Shannon Bell (212) 793-6206
Investors: Sheri Ptashek (212) 559-2718
Fixed Income Investors: John Randel (212) 559-5091
4
5. Citigroup Net Income - Product View Second Quarter Six Months
% %
2003 2003
2002 Change 2002 Change
(In Millions of Dollars, except per share data)
Global Consumer
Cards……………...……………………………………………………… $ 768 $ 722 6 $ 1,503 $ 1,301 16
508 993
Consumer Finance………………………………………………………… 568 (11) 1,098 (10)
1,049 2,023
Retail Banking……………….. ………………………………………… 645 63 1,307 55
Other……………………………………………………………………… (31) 11 NM (47) (9) NM
Total Global Consumer……………………………………………………… 2,294 4,472
1,946 18 3,697 21
Global Corporate and Investment Bank
Capital Markets and Banking…………………………………………… 1,163 1,136 2 2,357 2,195 7
187 384
Transaction Services……………………………………………………… 216 (13) 305 26
Other……………………………………………………………………… (10) (34) 71 (2) (57) 96
Total Global Corporate and Investment Bank…………………………… 1,340 2,739
1,318 2 2,443 12
Private Client Services……………………………………………………… 181 338
223 (19) 440 (23)
Global Investment Management
191 429
Life Insurance and Annuities (LIA)……………………………………… 255 (25) 459 (7)
(1) (3)
LIA Realized Insurance Investment Portfolio Gains / (Losses).………… (118) 99 (108) 97
Private Bank..…………………………………………………………… 138 113 22 263 224 17
104 209
Asset Management……….……………………………………………… 121 (14) 220 (5)
Total Global Investment Management……………………………………… 432 371 16 898 795 13
Proprietary Investment Activities…………………………………………… 27 27
(70) NM (35) NM
Corporate / Other…………………………………………………………… 25 41 (39) (72) (27) NM
Income From Continuing Operations……………………………………… 4,299 8,402
3,829 12 7,313 15
- -
Discontinued Operations, After-tax (A)……………………………………… 255 - 1,661 -
- -
Cumulative Effect of Accounting Change (B)………………………………… - - (47) -
Net Income…………………………………………………………………… $ 4,299 $ 4,084 5 $ 8,402 $ 8,927 (6)
Diluted Earnings Per Share:
Income From Continuing Operations……………………………………… $ 0.83 $ $ 1.62
0.73 14 $ 1.40 16
Net Income ……………………………………………………………………$ 0.83 $ 0.78 6 $ 1.62 $ 1.71 (5)
(A) Travelers Property Casualty Corp. (TPC) (a wholly-owned subsidiary of Citigroup on December 31, 2001) sold
231,000,000 shares of its class A common stock at $18.50 per share in an initial public offering (IPO) on March 27,
2002. Citigroup made a tax-free distribution to its stockholders of a portion of its ownership interest in TPC on
August 20, 2002. Discontinued Operations includes the operations of TPC, the $1.270 billion gain on the IPO
($1.061 billion after-tax recognized in the 2002 first quarter and $97 million after-tax recognized in the 2002
third quarter) and income taxes on the operations and IPO gain. Citigroup remains a holder of approximately 9.9%
of TPC's common equity.
(B) Accounting Change refers to the 2002 first quarter adoption of the remaining provisions of SFAS No. 142,
quot;Goodwill and Other Intangible Assetsquot; (SFAS 142).
NM Not meaningful
Reclassified to conform to the current period's presentation.
5
6. Citigroup Net Income - Regional View Second Quarter Six Months
% %
2003 2003
2002 Change 2002 Change
(In Millions of Dollars)
North America (excluding Mexico) (1)
Consumer………………………………………………………………… $ $ 1,297 17 $ 2,569 17
1,520 $ 2,999
Corporate………………………………………………………………… 602 (8) 1,276 (7)
552 1,191
Private Client Services…………………………………………………… 181 223 (19) 338 440 (23)
Investment Management……..…………………………………………… 299 218 37 650 570 14
2,340 9 4,855 7
Total North America (excluding Mexico)…………………………………… 2,552 5,178
Mexico
Consumer………………………………………………………………… 214 114 88 378 160 NM
Corporate………………………………………………………………… 110 (24) 304 (33)
84 204
Investment Management……..…………………………………………… 70 (1) 118 14
69 134
294 25 582 23
Total Mexico.. ………………………………………………………………… 367 716
Europe, Middle East and Africa (EMEA)
Consumer………………………………………………………………… 146 16 294 13
169 331
Corporate………………………………………………………………… 346 226 53 603 371 63
Investment Management……..…………………………………………… 2 8 (75) (1) 4 NM
Total EMEA.. ……………………………………………………………… 517 380 36 933 669 39
Japan
Consumer………………………………………………………………… 256 (30) 483 (30)
179 337
Corporate………………………………………………………………… 5 (3) NM 37 20 85
Investment Management……..…………………………………………… 20 16 25 37 31 19
Total Japan.. ………………………………………………………………… 204 269 (24) 411 534 (23)
Asia (excluding Japan)
Consumer………………………………………………………………… 204 163 25 397 321 24
Corporate………………………………………………………………… 200 (6) 393 (7)
188 367
Investment Management……..…………………………………………… 28 32 55 22
37 67
Total Asia (excluding Japan).. ……………………………………………… 429 391 10 831 769 8
Latin America
Consumer………………………………………………………………… (30) NM (130) NM
8 30
Corporate………………………………………………………………… 165 183 (10) 337 79 NM
Investment Management……..…………………………………………… 5 31 (84) 11 17 (35)
Total Latin America.. ……………………………………………………… 178 184 (3) 378 (34) NM
Proprietary Investment Activities…………………………………………… 27 (70) NM 27 (35) NM
Corporate / Other…………………………………………………………… 25 41 (39) (72) (27) NM
$ 3,829 12 $ 7,313 15
Income From Continuing Operations……………………………………… $ 4,299 $ 8,402
Discontinued Operations, After-tax (A)……………………………………… - 255 - - 1,661 -
Cumulative Effect of Accounting Changes (B)……………………………… - - - - (47) -
$ 4,084 5 $ 8,927 (6)
Net Income…………………………………………………………………… $ 4,299 $ 8,402
(1) Excludes Proprietary Investment Activities and Corporate / Other.
NM Not meaningful
Reclassified to conform to the current period's presentation.
6
7. Citigroup Segment Revenue - Product View Second Quarter Six Months
% %
2003 2003
2002 Change 2002 Change
(In Millions of Dollars)
Global Consumer
Cards……………...…………………………………………………………….. $ 3,207 3 $ 6,328 5
$ 3,309 $ 6,642
Consumer Finance…………………………………………………………………… 2,431 2,449 (1) 4,963 4,781 4
Retail Banking……………….. ……………………………………………………… 4,243 3,409 24 8,204 6,932 18
Other…………………………………………………………………………… 134 (43) 184 (14)
77 158
Total Global Consumer…………………………………………………………. 10,060 9,199 9 19,967 18,225 10
Global Corporate and Investment Bank
Capital Markets and Banking………………………………………………………… 4,531 4,219 7 8,711 8,597 1
Transaction Services……………………………………………………………… 908 962 (6) 1,821 1,819 0
Other…………………………………………………………………………. (104) 90 (203) 90
(10) (20)
Total Global Corporate and Investment Bank……………………………………… 5,429 5,077 7 10,512 10,213 3
1,551 (7) 3,058 (9)
Private Client Services………………………………………………………………… 1,449 2,776
Global Investment Management
Life Insurance and Annuities (LIA)………………………………………………… 1,164 1,034 13 2,297 2,052 12
Private Bank..…………………………………………………………………….. 428 21 851 15
519 980
Asset Management……….………………………………………………………… 411 475 (13) 811 945 (14)
Total Global Investment Management……………………………………….. 2,094 1,937 8 4,088 3,848 6
(49) NM 62 NM
Proprietary Investment Activities…………………………………………………… 168 262
278 (45) 385 (26)
Corporate / Other…………………………………………………………………. 154 285
$ 17,993 8 37,890 $ 35,791 6
Total Revenues, Net of Interest Expense…………………………………………… $ 19,354 $
NM Not meaningful
Reclassified to conform to the current period's presentation.
7