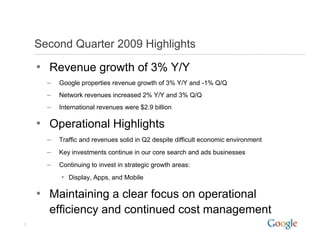
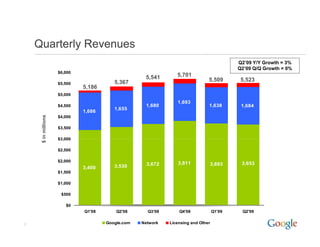
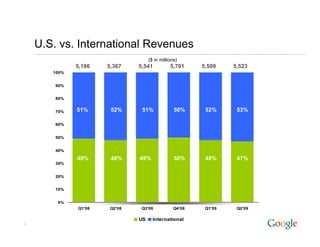
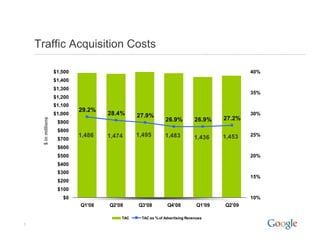
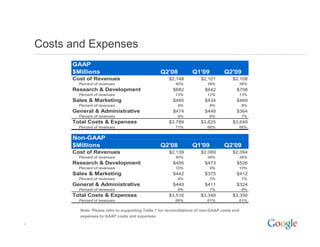
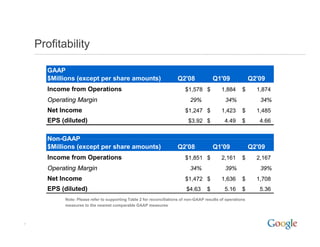
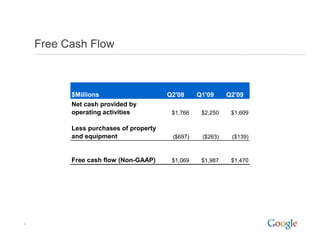
Q2 2009
Quarterly Earnings
    Summary
Second Quarter 2009 Highlights

    • Revenue growth of 3% Y/Y
      –   Google properties revenue growth of 3% Y/Y and -1% Q/Q
      –   Network revenues increased 2% Y/Y and 3% Q/Q
      –   International revenues were $2 9 billion
                                      $2.9

    • Operational Highlights
      –   Traffic and revenues solid in Q2 despite difficult economic environment
      –   Key investments continue in our core search and ads businesses
      –   Continuing to invest in strategic growth areas:
          • Display, Apps, and Mobile

    • Maintaining a clear focus on operational
      efficiency and continued cost management
2
Quarterly Revenues
                                                                                           Q2’09 Y/Y Growth = 3%
                                                                                           Q2’09 Q/Q Growth = 0%
                     $6,000
                                                    5,541
                                                    5 541       5,701
                                         5,367                                 5,509        5,523
                     $5,500
                              5,186
                     $5,000
                                                                1,693
                     $4,500                         1,680                      1,638        1,684
                                                                                             ,
                                         1,655
                                         1 655
                              1,686
     $ in millions


                     $4,000

                     $3,500

                     $3,000
                     $3 000

                     $2,500

                     $2,000
                                                     3,672      3,811          3,693        3,653
                              3,400      3,530
                     $1,500

                     $1,000

                      $500

                        $0
                              Q1'08       Q2'08      Q3'08       Q4'08             Q1'09    Q2'09


3                                     Google.com   Network   Licensing and Other
U.S. vs.
    U S vs International Revenues
                                    ($ in millions)
              5,186   5,367    5,541           5,701     5,509    5,523
       100%


       90%


       80%


       70%    51%      52%      51%              50%      52%      53%

       60%


       50%


       40%

              49%      48%     49%               50%      48%      47%
       30%


       20%


       10%


        0%
              Q1'08    Q2'08    Q3'08            Q4'08    Q1'09    Q2'09

                               US     International
4
Traffic Acquisition Costs

                     $1,500                                                                   40%
                     $1,400
                     $1,300
                                                                                              35%
                     $1,200
                     $1,100
                              29.2%
                              29 2%
                     $1,000           28.4%     27.9%                                         30%
                                                                                      27.2%
     $ in millions


                      $900                                   26.9%           26.9%
                      $800
                              1,486   1,474     1,495        1,483           1,436    1,453
                                                                                       ,      25%
        n


                      $700
                      $600
                      $500                                                                    20%
                      $400
                      $300
                                                                                              15%
                      $200
                      $100
                        $0                                                                    10%
                              Q1'08   Q2'08     Q3'08         Q4'08           Q1'09   Q2'09

                                          TAC    TAC as % of Advertising Revenues
5
Costs and Expenses
          GAAP
          $Millions                                  Q2'08           Q1'09            Q2'09
          Cost of Revenues
          C     f                                        $2,148           $2,101          $2,108
            Percent of revenues                              40%             38%             38%
          Research & Development                           $682             $642            $708
            Percent of revenues                              13%             12%             13%
          Sales & Marketing                                $485             $434            $469
            Percent of revenues                               9%              8%                 8%
          General & Administrative                         $474             $448            $364
            Percent of revenues                               9%              8%                 7%
          Total Costs & Expenses                         $3,789           $3,625          $3,649
            Percent of revenues                              71%             66%             66%


          Non GAAP
          Non-GAAP
          $Millions                                  Q2'08           Q1'09            Q2'09
          Cost of Revenues                               $2,139           $2,089          $2,094
            Percent of revenues                              40%             38%             38%
          Research & Development                           $495             $473            $526
            Percent of revenues                              10%              9%             10%
          Sales & Marketing                                $442             $375            $412
            Percent of revenues                               8%              7%                 7%
          General & Administrative                         $440             $411            $324
            Percent of revenues                               8%              7%                 6%
          Total Costs & Expenses                         $3,516           $3,348          $3,356
            Percent of revenues                              66%             61%             61%

            Note: Please refer to supporting Table 1 for reconciliations of non-GAAP costs and
            expenses to GAAP costs and expenses
6
Profitability

       GAAP
       $Millions (except per share amounts)
       $Milli    (     t      h         t )                           Q2'08               Q1'09              Q2'09
       Income from Operations                                             $1,578 $           1,884      $      1,874
       Operating Margin                                                      29%               34%              34%
       Net Income
       N tI                                                               $1,247 $           1,423      $      1,485
       EPS (diluted)                                                        $3.92 $            4.49     $       4.66


       Non-GAAP
       $Millions (except per share amounts)                           Q2'08               Q1'09              Q2'09
       Income from Operations                                             $1,851 $           2,161      $      2,167
       Operating Margin                                                      34%               39%              39%
       Net Income                                                         $1,472 $           1,636      $      1,708
       EPS (diluted)                                                       $4.63      $        5.16     $       5.36
            Note: Please refer to supporting Table 2 for reconciliations of non-GAAP results of operations
                                    pp     g                                                     p
            measures to the nearest comparable GAAP measures


7
Free Cash Flow


          $Millions                    Q2'08     Q1'09     Q2'09
          Net cash provided by
          operating activities          $1,766    $2,250    $1,609

          Less purchases of property
          and equipment
               q p                      ($
                                        ($697)
                                             )    ($
                                                  ($263)
                                                       )    ($
                                                            ($139)
                                                                 )


          Free cash flow (Non-GAAP)     $1,069    $1,987    $1,470


8
Table 1 - Reconciliations of non-GAAP costs and expenses
     to GAAP costs and expenses
                                                                       As a % of                        As a % of                     As a % of
    $Millions                                              Q2'08      Revenues (1)      Q1'09          Revenues (1)    Q2'09         Revenues (1)
    Cost of Revenues (GAAP)                            $     2,148
                                                             2 148            40% $         2,101
                                                                                            2 101              38% $        2,108
                                                                                                                            2 108            38%
    Less: Stock-based compensation                              (9)                           (12)                            (14)
    Cost of Revenues (non-GAAP)                        $     2,139            40% $         2,089              38% $        2,094            38%

    Research and development (GAAP)                    $       682            13% $           642              12% $          708            13%
    Less: Stock-based compensation                            (187)                          (169)                           (182)
    Research and development (non GAAP)
                              (non-GAAP)               $       495            10% $           473               9% $          526            10%

    Sales and marketing (GAAP)                         $      485              9% $             434             8% $         469              8%
    Less: Stock-based compensation                            (43)                              (59)                         (57)
    Sales and marketing (non-GAAP)                     $      442              8% $             375             7% $         412              7%

    General and administrative (GAAP)                  $      474              9% $             448             8% $         364              7%
    Less: Stock-based compensation                            (34)                              (37)                         (40)
    General and administrative (non-GAAP)              $      440              8% $             411             7% $         324              6%

    Total costs and expenses (GAAP)                    $     3,789            71% $         3,625              66% $        3,649            66%
    Less: Stock-based compensation                            (273)                          (277)                           (293)
    Total
    T t l costs and expenses (non-GAAP)
             t    d          (     GAAP)               $     3,516
                                                             3 516            66% $         3,348
                                                                                            3 348              61% $        3,356
                                                                                                                            3 356            61%

    (1) Percentages based on revenues of $5,367 million in Q2 '08, $5,509 million in Q1 '09 and $5,523 million in Q2 '09.


9
Table 2 - Reconciliations of non-GAAP results of operations
         measures to the nearest comparable GAAP measures


                                                                                 Operating                     Operating                  Operating
                                                                                  Margin                        Margin                     Margin
$ millions except per share amounts                                   Q2'08         (1)            Q1'09          (1)          Q2'09         (1)
Income from operations (GAAP)                                     $     1,578            29% $       1,884             34% $      1,874         34%
Add: Stock-based compensation
Add S k b      d          i                                               273                          277                          293
Income from operations (non-GAAP)                                 $     1,851            34% $       2,161             39% $      2,167         39%

Net income (GAAP)                                                 $     1,247                  $     1,423                 $      1,485
Add: Stock-based compensation (net of tax)                                225                          213                          223
Net income (non GAAP)
           (non-GAAP)                                             $     1,472                  $     1,636                 $      1,708

Net income per share - diluted (GAAP)                             $      3.92                  $      4.49                 $       4.66
Net income per share - diluted (non-GAAP)                         $      4.63                  $      5.16                 $       5.36
Shares used in per share calculation - diluted                            318                         317                          319

(1) Percentages based on revenues of $5 367 million in Q2 '08 $5 509 million in Q1 '09 and $5 523 million in Q2 '09
                                     $5,367                08, $5,509               09     $5,523                09.


  10
Q2 2009
Quarterly Earnings
    Summary

Google Earnings Slides 2009 Q2

  • 1.
  • 2.
    Second Quarter 2009Highlights • Revenue growth of 3% Y/Y – Google properties revenue growth of 3% Y/Y and -1% Q/Q – Network revenues increased 2% Y/Y and 3% Q/Q – International revenues were $2 9 billion $2.9 • Operational Highlights – Traffic and revenues solid in Q2 despite difficult economic environment – Key investments continue in our core search and ads businesses – Continuing to invest in strategic growth areas: • Display, Apps, and Mobile • Maintaining a clear focus on operational efficiency and continued cost management 2
  • 3.
    Quarterly Revenues Q2’09 Y/Y Growth = 3% Q2’09 Q/Q Growth = 0% $6,000 5,541 5 541 5,701 5,367 5,509 5,523 $5,500 5,186 $5,000 1,693 $4,500 1,680 1,638 1,684 , 1,655 1 655 1,686 $ in millions $4,000 $3,500 $3,000 $3 000 $2,500 $2,000 3,672 3,811 3,693 3,653 3,400 3,530 $1,500 $1,000 $500 $0 Q1'08 Q2'08 Q3'08 Q4'08 Q1'09 Q2'09 3 Google.com Network Licensing and Other
  • 4.
    U.S. vs. U S vs International Revenues ($ in millions) 5,186 5,367 5,541 5,701 5,509 5,523 100% 90% 80% 70% 51% 52% 51% 50% 52% 53% 60% 50% 40% 49% 48% 49% 50% 48% 47% 30% 20% 10% 0% Q1'08 Q2'08 Q3'08 Q4'08 Q1'09 Q2'09 US International 4
  • 5.
    Traffic Acquisition Costs $1,500 40% $1,400 $1,300 35% $1,200 $1,100 29.2% 29 2% $1,000 28.4% 27.9% 30% 27.2% $ in millions $900 26.9% 26.9% $800 1,486 1,474 1,495 1,483 1,436 1,453 , 25% n $700 $600 $500 20% $400 $300 15% $200 $100 $0 10% Q1'08 Q2'08 Q3'08 Q4'08 Q1'09 Q2'09 TAC TAC as % of Advertising Revenues 5
  • 6.
    Costs and Expenses GAAP $Millions Q2'08 Q1'09 Q2'09 Cost of Revenues C f $2,148 $2,101 $2,108 Percent of revenues 40% 38% 38% Research & Development $682 $642 $708 Percent of revenues 13% 12% 13% Sales & Marketing $485 $434 $469 Percent of revenues 9% 8% 8% General & Administrative $474 $448 $364 Percent of revenues 9% 8% 7% Total Costs & Expenses $3,789 $3,625 $3,649 Percent of revenues 71% 66% 66% Non GAAP Non-GAAP $Millions Q2'08 Q1'09 Q2'09 Cost of Revenues $2,139 $2,089 $2,094 Percent of revenues 40% 38% 38% Research & Development $495 $473 $526 Percent of revenues 10% 9% 10% Sales & Marketing $442 $375 $412 Percent of revenues 8% 7% 7% General & Administrative $440 $411 $324 Percent of revenues 8% 7% 6% Total Costs & Expenses $3,516 $3,348 $3,356 Percent of revenues 66% 61% 61% Note: Please refer to supporting Table 1 for reconciliations of non-GAAP costs and expenses to GAAP costs and expenses 6
  • 7.
    Profitability GAAP $Millions (except per share amounts) $Milli ( t h t ) Q2'08 Q1'09 Q2'09 Income from Operations $1,578 $ 1,884 $ 1,874 Operating Margin 29% 34% 34% Net Income N tI $1,247 $ 1,423 $ 1,485 EPS (diluted) $3.92 $ 4.49 $ 4.66 Non-GAAP $Millions (except per share amounts) Q2'08 Q1'09 Q2'09 Income from Operations $1,851 $ 2,161 $ 2,167 Operating Margin 34% 39% 39% Net Income $1,472 $ 1,636 $ 1,708 EPS (diluted) $4.63 $ 5.16 $ 5.36 Note: Please refer to supporting Table 2 for reconciliations of non-GAAP results of operations pp g p measures to the nearest comparable GAAP measures 7
  • 8.
    Free Cash Flow $Millions Q2'08 Q1'09 Q2'09 Net cash provided by operating activities $1,766 $2,250 $1,609 Less purchases of property and equipment q p ($ ($697) ) ($ ($263) ) ($ ($139) ) Free cash flow (Non-GAAP) $1,069 $1,987 $1,470 8
  • 9.
    Table 1 -Reconciliations of non-GAAP costs and expenses to GAAP costs and expenses As a % of As a % of As a % of $Millions Q2'08 Revenues (1) Q1'09 Revenues (1) Q2'09 Revenues (1) Cost of Revenues (GAAP) $ 2,148 2 148 40% $ 2,101 2 101 38% $ 2,108 2 108 38% Less: Stock-based compensation (9) (12) (14) Cost of Revenues (non-GAAP) $ 2,139 40% $ 2,089 38% $ 2,094 38% Research and development (GAAP) $ 682 13% $ 642 12% $ 708 13% Less: Stock-based compensation (187) (169) (182) Research and development (non GAAP) (non-GAAP) $ 495 10% $ 473 9% $ 526 10% Sales and marketing (GAAP) $ 485 9% $ 434 8% $ 469 8% Less: Stock-based compensation (43) (59) (57) Sales and marketing (non-GAAP) $ 442 8% $ 375 7% $ 412 7% General and administrative (GAAP) $ 474 9% $ 448 8% $ 364 7% Less: Stock-based compensation (34) (37) (40) General and administrative (non-GAAP) $ 440 8% $ 411 7% $ 324 6% Total costs and expenses (GAAP) $ 3,789 71% $ 3,625 66% $ 3,649 66% Less: Stock-based compensation (273) (277) (293) Total T t l costs and expenses (non-GAAP) t d ( GAAP) $ 3,516 3 516 66% $ 3,348 3 348 61% $ 3,356 3 356 61% (1) Percentages based on revenues of $5,367 million in Q2 '08, $5,509 million in Q1 '09 and $5,523 million in Q2 '09. 9
  • 10.
    Table 2 -Reconciliations of non-GAAP results of operations measures to the nearest comparable GAAP measures Operating Operating Operating Margin Margin Margin $ millions except per share amounts Q2'08 (1) Q1'09 (1) Q2'09 (1) Income from operations (GAAP) $ 1,578 29% $ 1,884 34% $ 1,874 34% Add: Stock-based compensation Add S k b d i 273 277 293 Income from operations (non-GAAP) $ 1,851 34% $ 2,161 39% $ 2,167 39% Net income (GAAP) $ 1,247 $ 1,423 $ 1,485 Add: Stock-based compensation (net of tax) 225 213 223 Net income (non GAAP) (non-GAAP) $ 1,472 $ 1,636 $ 1,708 Net income per share - diluted (GAAP) $ 3.92 $ 4.49 $ 4.66 Net income per share - diluted (non-GAAP) $ 4.63 $ 5.16 $ 5.36 Shares used in per share calculation - diluted 318 317 319 (1) Percentages based on revenues of $5 367 million in Q2 '08 $5 509 million in Q1 '09 and $5 523 million in Q2 '09 $5,367 08, $5,509 09 $5,523 09. 10
  • 11.