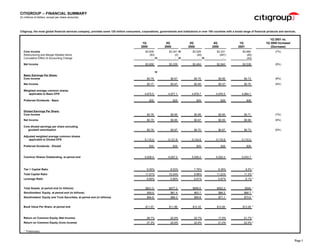
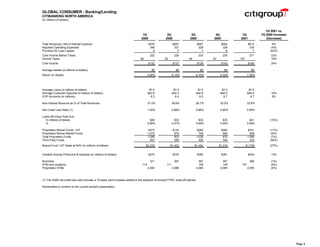
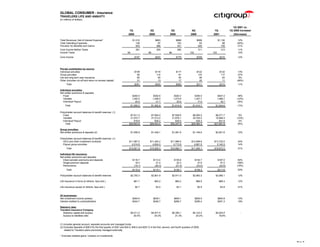
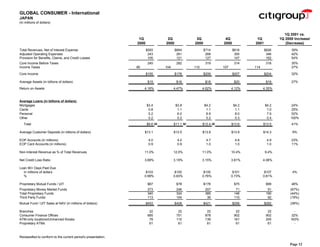
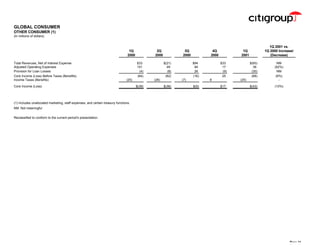
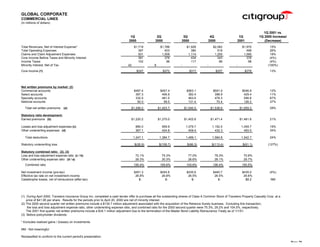
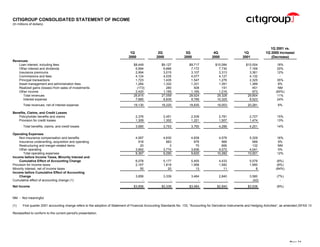
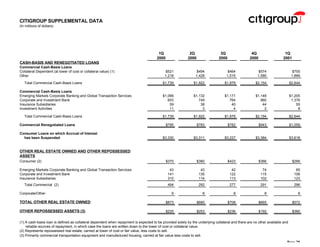
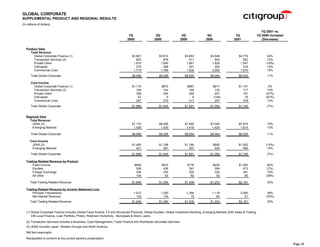
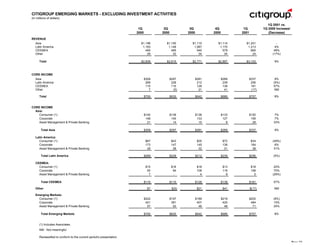
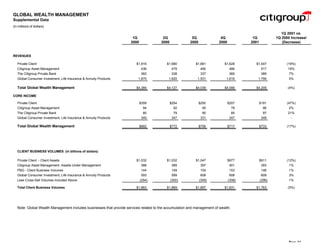
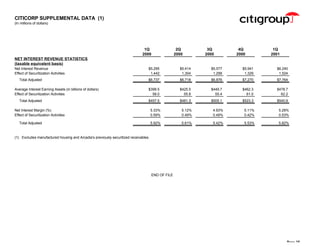
Citigroup, the largest global financial services company, reported quarterly financial results. Core income decreased 7% year-over-year to $3.66 billion, while net income decreased 8% to $3.54 billion. Revenues increased 6% to $21.05 billion driven by strong growth in North America Cards, Corporate Finance, and emerging markets. Citibanking North America revenues increased 6% to $613 million with core income before taxes up 24% to $271 million.
Falcon stands out as a top-tier P2P Invoice Discounting platform in India, bridging esteemed blue-chip companies and eager investors. Our goal is to transform the investment landscape in India by establishing a comprehensive destination for borrowers and investors with diverse profiles and needs, all while minimizing risk. What sets Falcon apart is the elimination of intermediaries such as commercial banks and depository institutions, allowing investors to enjoy higher yields.
What website can I sell pi coins securely.DOT TECH
Currently there are no website or exchange that allow buying or selling of pi coins..
But you can still easily sell pi coins, by reselling it to exchanges/crypto whales interested in holding thousands of pi coins before the mainnet launch.
Who is a pi merchant?
A pi merchant is someone who buys pi coins from miners and resell to these crypto whales and holders of pi..
This is because pi network is not doing any pre-sale. The only way exchanges can get pi is by buying from miners and pi merchants stands in between the miners and the exchanges.
How can I sell my pi coins?
Selling pi coins is really easy, but first you need to migrate to mainnet wallet before you can do that. I will leave the telegram contact of my personal pi merchant to trade with.
Tele-gram.
@Pi_vendor_247
US Economic Outlook - Being Decided - M Capital Group August 2021.pdfpchutichetpong
The U.S. economy is continuing its impressive recovery from the COVID-19 pandemic and not slowing down despite re-occurring bumps. The U.S. savings rate reached its highest ever recorded level at 34% in April 2020 and Americans seem ready to spend. The sectors that had been hurt the most by the pandemic specifically reduced consumer spending, like retail, leisure, hospitality, and travel, are now experiencing massive growth in revenue and job openings.
Could this growth lead to a “Roaring Twenties”? As quickly as the U.S. economy contracted, experiencing a 9.1% drop in economic output relative to the business cycle in Q2 2020, the largest in recorded history, it has rebounded beyond expectations. This surprising growth seems to be fueled by the U.S. government’s aggressive fiscal and monetary policies, and an increase in consumer spending as mobility restrictions are lifted. Unemployment rates between June 2020 and June 2021 decreased by 5.2%, while the demand for labor is increasing, coupled with increasing wages to incentivize Americans to rejoin the labor force. Schools and businesses are expected to fully reopen soon. In parallel, vaccination rates across the country and the world continue to rise, with full vaccination rates of 50% and 14.8% respectively.
However, it is not completely smooth sailing from here. According to M Capital Group, the main risks that threaten the continued growth of the U.S. economy are inflation, unsettled trade relations, and another wave of Covid-19 mutations that could shut down the world again. Have we learned from the past year of COVID-19 and adapted our economy accordingly?
“In order for the U.S. economy to continue growing, whether there is another wave or not, the U.S. needs to focus on diversifying supply chains, supporting business investment, and maintaining consumer spending,” says Grace Feeley, a research analyst at M Capital Group.
While the economic indicators are positive, the risks are coming closer to manifesting and threatening such growth. The new variants spreading throughout the world, Delta, Lambda, and Gamma, are vaccine-resistant and muddy the predictions made about the economy and health of the country. These variants bring back the feeling of uncertainty that has wreaked havoc not only on the stock market but the mindset of people around the world. MCG provides unique insight on how to mitigate these risks to possibly ensure a bright economic future.
What price will pi network be listed on exchangesDOT TECH
The rate at which pi will be listed is practically unknown. But due to speculations surrounding it the predicted rate is tends to be from 30$ — 50$.
So if you are interested in selling your pi network coins at a high rate tho. Or you can't wait till the mainnet launch in 2026. You can easily trade your pi coins with a merchant.
A merchant is someone who buys pi coins from miners and resell them to Investors looking forward to hold massive quantities till mainnet launch.
I will leave the telegram contact of my personal pi vendor to trade with.
@Pi_vendor_247
Resume
• Real GDP growth slowed down due to problems with access to electricity caused by the destruction of manoeuvrable electricity generation by Russian drones and missiles.
• Exports and imports continued growing due to better logistics through the Ukrainian sea corridor and road. Polish farmers and drivers stopped blocking borders at the end of April.
• In April, both the Tax and Customs Services over-executed the revenue plan. Moreover, the NBU transferred twice the planned profit to the budget.
• The European side approved the Ukraine Plan, which the government adopted to determine indicators for the Ukraine Facility. That approval will allow Ukraine to receive a EUR 1.9 bn loan from the EU in May. At the same time, the EU provided Ukraine with a EUR 1.5 bn loan in April, as the government fulfilled five indicators under the Ukraine Plan.
• The USA has finally approved an aid package for Ukraine, which includes USD 7.8 bn of budget support; however, the conditions and timing of the assistance are still unknown.
• As in March, annual consumer inflation amounted to 3.2% yoy in April.
• At the April monetary policy meeting, the NBU again reduced the key policy rate from 14.5% to 13.5% per annum.
• Over the past four weeks, the hryvnia exchange rate has stabilized in the UAH 39-40 per USD range.
Poonawalla Fincorp and IndusInd Bank Introduce New Co-Branded Credit Cardnickysharmasucks
The unveiling of the IndusInd Bank Poonawalla Fincorp eLITE RuPay Platinum Credit Card marks a notable milestone in the Indian financial landscape, showcasing a successful partnership between two leading institutions, Poonawalla Fincorp and IndusInd Bank. This co-branded credit card not only offers users a plethora of benefits but also reflects a commitment to innovation and adaptation. With a focus on providing value-driven and customer-centric solutions, this launch represents more than just a new product—it signifies a step towards redefining the banking experience for millions. Promising convenience, rewards, and a touch of luxury in everyday financial transactions, this collaboration aims to cater to the evolving needs of customers and set new standards in the industry.
Latino Buying Power - May 2024 Presentation for Latino CaucusDanay Escanaverino
Unlock the potential of Latino Buying Power with this in-depth SlideShare presentation. Explore how the Latino consumer market is transforming the American economy, driven by their significant buying power, entrepreneurial contributions, and growing influence across various sectors.
**Key Sections Covered:**
1. **Economic Impact:** Understand the profound economic impact of Latino consumers on the U.S. economy. Discover how their increasing purchasing power is fueling growth in key industries and contributing to national economic prosperity.
2. **Buying Power:** Dive into detailed analyses of Latino buying power, including its growth trends, key drivers, and projections for the future. Learn how this influential group’s spending habits are shaping market dynamics and creating opportunities for businesses.
3. **Entrepreneurial Contributions:** Explore the entrepreneurial spirit within the Latino community. Examine how Latino-owned businesses are thriving and contributing to job creation, innovation, and economic diversification.
4. **Workforce Statistics:** Gain insights into the role of Latino workers in the American labor market. Review statistics on employment rates, occupational distribution, and the economic contributions of Latino professionals across various industries.
5. **Media Consumption:** Understand the media consumption habits of Latino audiences. Discover their preferences for digital platforms, television, radio, and social media. Learn how these consumption patterns are influencing advertising strategies and media content.
6. **Education:** Examine the educational achievements and challenges within the Latino community. Review statistics on enrollment, graduation rates, and fields of study. Understand the implications of education on economic mobility and workforce readiness.
7. **Home Ownership:** Explore trends in Latino home ownership. Understand the factors driving home buying decisions, the challenges faced by Latino homeowners, and the impact of home ownership on community stability and economic growth.
This SlideShare provides valuable insights for marketers, business owners, policymakers, and anyone interested in the economic influence of the Latino community. By understanding the various facets of Latino buying power, you can effectively engage with this dynamic and growing market segment.
Equip yourself with the knowledge to leverage Latino buying power, tap into their entrepreneurial spirit, and connect with their unique cultural and consumer preferences. Drive your business success by embracing the economic potential of Latino consumers.
**Keywords:** Latino buying power, economic impact, entrepreneurial contributions, workforce statistics, media consumption, education, home ownership, Latino market, Hispanic buying power, Latino purchasing power.
NO1 Uk Rohani Baba In Karachi Bangali Baba Karachi Online Amil Baba WorldWide...Amil baba
Contact with Dawood Bhai Just call on +92322-6382012 and we'll help you. We'll solve all your problems within 12 to 24 hours and with 101% guarantee and with astrology systematic. If you want to take any personal or professional advice then also you can call us on +92322-6382012 , ONLINE LOVE PROBLEM & Other all types of Daily Life Problem's.Then CALL or WHATSAPP us on +92322-6382012 and Get all these problems solutions here by Amil Baba DAWOOD BANGALI
#vashikaranspecialist #astrologer #palmistry #amliyaat #taweez #manpasandshadi #horoscope #spiritual #lovelife #lovespell #marriagespell#aamilbabainpakistan #amilbabainkarachi #powerfullblackmagicspell #kalajadumantarspecialist #realamilbaba #AmilbabainPakistan #astrologerincanada #astrologerindubai #lovespellsmaster #kalajaduspecialist #lovespellsthatwork #aamilbabainlahore#blackmagicformarriage #aamilbaba #kalajadu #kalailam #taweez #wazifaexpert #jadumantar #vashikaranspecialist #astrologer #palmistry #amliyaat #taweez #manpasandshadi #horoscope #spiritual #lovelife #lovespell #marriagespell#aamilbabainpakistan #amilbabainkarachi #powerfullblackmagicspell #kalajadumantarspecialist #realamilbaba #AmilbabainPakistan #astrologerincanada #astrologerindubai #lovespellsmaster #kalajaduspecialist #lovespellsthatwork #aamilbabainlahore #blackmagicforlove #blackmagicformarriage #aamilbaba #kalajadu #kalailam #taweez #wazifaexpert #jadumantar #vashikaranspecialist #astrologer #palmistry #amliyaat #taweez #manpasandshadi #horoscope #spiritual #lovelife #lovespell #marriagespell#aamilbabainpakistan #amilbabainkarachi #powerfullblackmagicspell #kalajadumantarspecialist #realamilbaba #AmilbabainPakistan #astrologerincanada #astrologerindubai #lovespellsmaster #kalajaduspecialist #lovespellsthatwork #aamilbabainlahore #Amilbabainuk #amilbabainspain #amilbabaindubai #Amilbabainnorway #amilbabainkrachi #amilbabainlahore #amilbabaingujranwalan #amilbabainislamabad
NO1 Uk Divorce problem uk all amil baba in karachi,lahore,pakistan talaq ka m...Amil Baba Dawood bangali
Contact with Dawood Bhai Just call on +92322-6382012 and we'll help you. We'll solve all your problems within 12 to 24 hours and with 101% guarantee and with astrology systematic. If you want to take any personal or professional advice then also you can call us on +92322-6382012 , ONLINE LOVE PROBLEM & Other all types of Daily Life Problem's.Then CALL or WHATSAPP us on +92322-6382012 and Get all these problems solutions here by Amil Baba DAWOOD BANGALI
#vashikaranspecialist #astrologer #palmistry #amliyaat #taweez #manpasandshadi #horoscope #spiritual #lovelife #lovespell #marriagespell#aamilbabainpakistan #amilbabainkarachi #powerfullblackmagicspell #kalajadumantarspecialist #realamilbaba #AmilbabainPakistan #astrologerincanada #astrologerindubai #lovespellsmaster #kalajaduspecialist #lovespellsthatwork #aamilbabainlahore#blackmagicformarriage #aamilbaba #kalajadu #kalailam #taweez #wazifaexpert #jadumantar #vashikaranspecialist #astrologer #palmistry #amliyaat #taweez #manpasandshadi #horoscope #spiritual #lovelife #lovespell #marriagespell#aamilbabainpakistan #amilbabainkarachi #powerfullblackmagicspell #kalajadumantarspecialist #realamilbaba #AmilbabainPakistan #astrologerincanada #astrologerindubai #lovespellsmaster #kalajaduspecialist #lovespellsthatwork #aamilbabainlahore #blackmagicforlove #blackmagicformarriage #aamilbaba #kalajadu #kalailam #taweez #wazifaexpert #jadumantar #vashikaranspecialist #astrologer #palmistry #amliyaat #taweez #manpasandshadi #horoscope #spiritual #lovelife #lovespell #marriagespell#aamilbabainpakistan #amilbabainkarachi #powerfullblackmagicspell #kalajadumantarspecialist #realamilbaba #AmilbabainPakistan #astrologerincanada #astrologerindubai #lovespellsmaster #kalajaduspecialist #lovespellsthatwork #aamilbabainlahore #Amilbabainuk #amilbabainspain #amilbabaindubai #Amilbabainnorway #amilbabainkrachi #amilbabainlahore #amilbabaingujranwalan #amilbabainislamabad
what is the future of Pi Network currency.DOT TECH
The future of the Pi cryptocurrency is uncertain, and its success will depend on several factors. Pi is a relatively new cryptocurrency that aims to be user-friendly and accessible to a wide audience. Here are a few key considerations for its future:
Message: @Pi_vendor_247 on telegram if u want to sell PI COINS.
1. Mainnet Launch: As of my last knowledge update in January 2022, Pi was still in the testnet phase. Its success will depend on a successful transition to a mainnet, where actual transactions can take place.
2. User Adoption: Pi's success will be closely tied to user adoption. The more users who join the network and actively participate, the stronger the ecosystem can become.
3. Utility and Use Cases: For a cryptocurrency to thrive, it must offer utility and practical use cases. The Pi team has talked about various applications, including peer-to-peer transactions, smart contracts, and more. The development and implementation of these features will be essential.
4. Regulatory Environment: The regulatory environment for cryptocurrencies is evolving globally. How Pi navigates and complies with regulations in various jurisdictions will significantly impact its future.
5. Technology Development: The Pi network must continue to develop and improve its technology, security, and scalability to compete with established cryptocurrencies.
6. Community Engagement: The Pi community plays a critical role in its future. Engaged users can help build trust and grow the network.
7. Monetization and Sustainability: The Pi team's monetization strategy, such as fees, partnerships, or other revenue sources, will affect its long-term sustainability.
It's essential to approach Pi or any new cryptocurrency with caution and conduct due diligence. Cryptocurrency investments involve risks, and potential rewards can be uncertain. The success and future of Pi will depend on the collective efforts of its team, community, and the broader cryptocurrency market dynamics. It's advisable to stay updated on Pi's development and follow any updates from the official Pi Network website or announcements from the team.
how to sell pi coins at high rate quickly.DOT TECH
Where can I sell my pi coins at a high rate.
Pi is not launched yet on any exchange. But one can easily sell his or her pi coins to investors who want to hold pi till mainnet launch.
This means crypto whales want to hold pi. And you can get a good rate for selling pi to them. I will leave the telegram contact of my personal pi vendor below.
A vendor is someone who buys from a miner and resell it to a holder or crypto whale.
Here is the telegram contact of my vendor:
@Pi_vendor_247
Even tho Pi network is not listed on any exchange yet.
Buying/Selling or investing in pi network coins is highly possible through the help of vendors. You can buy from vendors[ buy directly from the pi network miners and resell it]. I will leave the telegram contact of my personal vendor.
@Pi_vendor_247
how can I sell my pi coins for cash in a pi APPDOT TECH
You can't sell your pi coins in the pi network app. because it is not listed yet on any exchange.
The only way you can sell is by trading your pi coins with an investor (a person looking forward to hold massive amounts of pi coins before mainnet launch) .
You don't need to meet the investor directly all the trades are done with a pi vendor/merchant (a person that buys the pi coins from miners and resell it to investors)
I Will leave The telegram contact of my personal pi vendor, if you are finding a legitimate one.
@Pi_vendor_247
#pi network
#pi coins
#money
how to sell pi coins in South Korea profitably.DOT TECH
Yes. You can sell your pi network coins in South Korea or any other country, by finding a verified pi merchant
What is a verified pi merchant?
Since pi network is not launched yet on any exchange, the only way you can sell pi coins is by selling to a verified pi merchant, and this is because pi network is not launched yet on any exchange and no pre-sale or ico offerings Is done on pi.
Since there is no pre-sale, the only way exchanges can get pi is by buying from miners. So a pi merchant facilitates these transactions by acting as a bridge for both transactions.
How can i find a pi vendor/merchant?
Well for those who haven't traded with a pi merchant or who don't already have one. I will leave the telegram id of my personal pi merchant who i trade pi with.
Tele gram: @Pi_vendor_247
#pi #sell #nigeria #pinetwork #picoins #sellpi #Nigerian #tradepi #pinetworkcoins #sellmypi
If you are looking for a pi coin investor. Then look no further because I have the right one he is a pi vendor (he buy and resell to whales in China). I met him on a crypto conference and ever since I and my friends have sold more than 10k pi coins to him And he bought all and still want more. I will drop his telegram handle below just send him a message.
@Pi_vendor_247
1. CITIGROUP - QUARTERLY FINANCIAL DATA SUPPLEMENT
Page Number
Citigroup Consolidated
Financial Summary 1
Segment Net Revenues 2
Segment Core Income 3
Segment Detail
Global Consumer:
Banking / Lending
4
Citibanking North America
Mortgage Banking 5
North America Cards 6
CitiFinancial 7
Insurance
Travelers Life and Annuity 8
Primerica Financial Services 9
Personal Lines 10
International
Western Europe 11
Japan 12
Asia 13
Latin America 14
Central & Eastern Europe, Middle East & Africa 15
Other Consumer 16
Global Corporate:
Corporate and Investment Bank 17
Salomon Smith Barney 18
Emerging Markets Corporate Banking and Global Transaction Services 19
Commercial Lines 20
Global Investment Management and Private Banking:
Citigroup Asset Management 21
The Citigroup Private Bank 22
Investment Activities 23
Citigroup Supplemental Detail
Consolidated Statement of Income 24
Earnings Analysis - Managed Basis 25
Consumer Loan Delinquency Amounts, Net Credit Losses and Ratios 26
Details of Credit Loss Experience 27
Cash Basis and Renegotiated Loans, Other Real Estate Owned and Assets Pending Disposition 28
Insurance Investment Portfolio 29
Global Cards 30
Global Consumer Finance 31
Global Corporate - Supplemental Product and Regional Results 32
Citigroup Emerging Markets 33
Global Wealth Management 34
Citicorp Supplemental Data 35
2. CITIGROUP -- FINANCIAL SUMMARY
(In millions of dollars, except per share amounts)
Citigroup, the most global financial services company, provides some 120 million consumers, corporations, governments and institutions in over 100 countries with a broad range of financial products and services.
1Q 2001 vs.
1Q 2Q 3Q 4Q 1Q 1Q 2000 Increase/
2000 2000 2000 2000 2001 (Decrease)
Core Income $3,939 $3,341### $3,529 $3,331 $3,660 (7%)
Restructuring and Merger-Related Items (83) (2) (45) (491) (80)
Cumulative Effect of Accounting Change - ### - ### - ### - (42)
Net Income $3,856 $3,339 $3,484 $2,840 $3,538 (8%)
###
Basic Earnings Per Share:
Core Income $0.79 $0.67 $0.70 $0.66 $0.73 (8%)
Net Income $0.77 $0.67 $0.69 $0.57 $0.70 (9%)
Weighted average common shares
applicable to Basic EPS 4,975.5 4,977.1 4,978.7 4,976.5 4,984.7
Preferred Dividends - Basic $30 $29 $29 $28 $28
Diluted Earnings Per Share:
Core Income $0.76 $0.65 $0.68 $0.65 $0.71 (7%)
Net Income $0.75 $0.65 $0.67 $0.55 $0.69 (8%)
Core diluted earnings per share excluding
goodwill amortization $0.78 $0.67 $0.70 $0.67 $0.73 (6%)
Adjusted weighted average common shares
applicable to Diluted EPS 5,115.4 5,121.6 5,134.8 5,116.8 5,110.0
Preferred Dividends - Diluted $30 $29 $29 $28 $28
Common Shares Outstanding, at period end 5,028.4 5,027.2 5,026.2 5,022.2 5,033.7
Tier 1 Capital Ratio 9.00% 8.03% 7.76% 8.38% 8.5% *
Total Capital Ratio 11.47% 10.34% 9.96% 11.23% 11.3% *
Leverage Ratio 6.60% 5.99% 5.91% 5.97% 6.1% *
Total Assets, at period end (in billions) $821.0 $877.2 $896.6 $902.2 $946 *
Stockholders' Equity, at period end (in billions) $59.9 $61.4 $63.7 $66.2 $68.7 *
Stockholders' Equity and Trust Securities, at period end (in billions) $64.8 $66.3 $68.6 $71.1 $73.6 *
Book Value Per Share, at period end $11.57 $11.86 $12.33 $12.84 $13.29 *
Return on Common Equity (Net Income) 26.7% 22.9% 22.7% 17.9% 21.7% *
Return on Common Equity (Core Income) 27.3% 22.9% 22.9% 21.0% 22.5% *
* Preliminary
Page 1
3. CITIGROUP -- SEGMENT NET REVENUES
(In millions of dollars)
1Q 2001 vs.
1Q 2Q 3Q 4Q 1Q 1Q 2000 Increase/
2000 2000 2000 2000 2001 (Decrease)
Global Consumer:
Banking / Lending
Citibanking North America $579 $567 $567 $564 $613 6%
Mortgage Banking 223 226 225 238 242 9%
North America Cards 2,551 2,557 2,737 2,911 3,004 18%
CitiFinancial 1,222 1,269 1,262 1,318 1,339 10%
Total Banking / Lending 4,575 4,619 4,791 5,031 5,198 14%
Insurance
Travelers Life and Annuity 1,010 983 899 999 1,130 12%
Primerica Financial Services 472 479 474 490 490 4%
Personal Lines 1,034 1,050 1,058 1,088 1,080 4%
Total Insurance 2,516 2,512 2,431 2,577 2,700 7%
International
Western Europe 618
### 600
### 579
### 591 622 1%
Japan 593
### 664
### 714
### 816 826 39%
Asia 539
### 519
### 521
### 517 540 -
Latin America 513 466 436 526 471 (8%)
Central & Eastern Europe, Middle East and Africa 100 106 110 117 131 31%
Total Emerging Markets Consumer Banking 1,152 1,091 1,067 1,160 1,142 (1%)
Total International 2,363 2,355 2,360 2,567 2,590 10%
e-Consumer 31 28 76 35 47 52%
Other 33 (21) 94 33 (60) NM
Total Global Consumer 9,518 9,493 9,752 10,243 10,475 10%
Global Corporate:
Corporate Finance 3,086 2,820 2,925 2,752 3,800 23%
Private Client 1,916 1,690 1,681 1,628 1,547 (19%)
CitiCapital 275 288 301 302 316 15%
Corporate and Investment Bank 5,277 4,798 4,907 4,682 5,663 7%
Emerging Markets Corporate Banking and Global Transaction Services 1,600 1,670 1,669 1,720 1,896 19%
Commercial Lines 1,719 1,788 1,928 2,062 1,970 15%
Total Global Corporate 8,596 8,256 8,504 8,464 9,529 11%
Global Investment Management & Private Banking:
Citigroup Asset Management 436 479 490 486 517 19%
The Citigroup Private Bank 362 338 337 369 389 7%
Total Global Investment Management & Private Banking 798 817 827 855 906 14%
Corporate / Other (89) (159) (170) (256) (97) (9%)
Investment Activities 1,016 387 495 347 234 (77%)
Total Adjusted Net Revenues $19,839 $18,794 $19,408 $19,653 $21,047 6%
SUPPLEMENTAL INFORMATION:
Citigroup Emerging Markets - Excl. Investment Activities $2,838 $2,815 $2,771 $2,897 $3,103 9%
Global Wealth Management $4,384 $4,127 $4,039 $4,099 $4,209 (4%)
Global Cards $3,112 $3,157 $3,322 $3,515 $3,598 16%
Global Consumer Finance $1,843 $1,937 $1,967 $2,138 $2,199 19%
NM Not Meaningful
Reclassified to conform to the current period's presentation.
Page 2
4. CITIGROUP -- SEGMENT CORE INCOME
(In millions of dollars)
1Q 2001 vs.
1Q 2Q 3Q 4Q 1Q 1Q 2000 Increase/
2000 2000 2000 2000 2001 (Decrease)
Global Consumer:
Banking / Lending
Citibanking North America $132 $137 $138 $143 $164 24%
Mortgage Banking 66 71 77 84 77 17%
North America Cards 382 390 494 529 469 23%
CitiFinancial 179 205 213 213 212 18%
Total Banking / Lending 759 803 922 969 922 21%
Insurance
Travelers Life and Annuity 187 202 179 209 210 12%
Primerica Financial Services 119 125 124 124 125 5%
Personal Lines 74 82 68 83 87 18%
Total Insurance 380 409 371 416 422 11%
International
Western Europe 97
### 92
### 95
### 108 111 14%
Japan 155
### 178
### 209
### 207 204 32%
Asia 141
### 140
### 140
### 132 149 6%
Latin America 66 41 32 69 32 (52%)
Central & Eastern Europe, Middle East and Africa 15 16 16 14 19 27%
Total Emerging Markets Consumer Banking 222 197 188 215 200 (10%)
Total International 474 467 492 530 515 9%
e-Consumer (68) (46) (43) (46) (39) 43%
Other (39) (36) (9) 17 (43) (10%)
Total Global Consumer 1,506 1,597 1,733 1,886 1,777 18%
Global Corporate:
Corporate Finance 862 643 618 523 804 (7%)
Private Client 359 254 250 207 191 (47%)
CitiCapital 57 9 9 (146) 19 (67%)
Corporate and Investment Bank 1,278 906 877 584 1,014 (21%)
Emerging Markets Corporate Banking and Global Transaction Services 361 371 397 424 454 26%
Commercial Lines 247 272 317 257 278 13%
Total Global Corporate 1,886 1,549 1,591 1,265 1,746 (7%)
Global Investment Management & Private Banking:
Citigroup Asset Management 94 92 95 78 96 2%
The Citigroup Private Bank 80 79 80 85 97 21%
Total Global Investment Management & Private Banking 174 171 175 163 193 11%
Corporate / Other (260) (210) (262) (186) (192) 26%
Investment Activities 633 234 292 203 136 (79%)
Total Core Income $3,939 $3,341 $3,529 $3,331 $3,660 (7%)
SUPPLEMENTAL INFORMATION:
Citigroup Emerging Markets - Excl. Investment Activities $700 $630 $642 $686 $757 8%
Global Wealth Management $882 $772 $756 $717 $733 (17%)
Global Cards $478 $516 $607 $653 $598 25%
Global Consumer Finance $309 $359 $379 $387 $394 28%
Reclassified to conform to the current period's presentation.
Page 3
5. GLOBAL CONSUMER - Banking/Lending
CITIBANKING NORTH AMERICA
(In millions of dollars)
1Q 2001 vs.
1Q 2Q 3Q 4Q 1Q 1Q 2000 Increase/
2000 2000 2000 2000 2001 (Decrease)
Total Revenues, Net of Interest Expense $579 $567 $567 $564 $613 6%
Adjusted Operating Expenses 348 331 328 328 335 (4%)
Provision for Loan Losses 9 7 7 6 7 (22%)
Core Income Before Taxes 222 229 232 230 271 22%
Income Taxes 90 92 94 87 107 19%
Core Income $132 $137 $138 $143 $164 24%
Average Assets (in billions of dollars) $9 $9 $9 $9 $9 -
Return on Assets 5.90% 6.12% 6.10% 6.32% 7.39%
Average Loans (in billions of dollars) $7.0 $7.0 $7.0 $7.0 $7.0 -
Average Customer Deposits (in billions of dollars) $43.6 $44.3 $44.8 $46.0 $48.0 10%
EOP Accounts (in millions) 6.3 6.4 6.5 6.7 6.7 6%
Non-Interest Revenue as % of Total Revenues 27.2% 26.6% 26.7% 25.0% 22.6%
Net Credit Loss Ratio (1) 1.00% 0.88% 0.86% 0.90% 0.85%
Loans 90+Days Past Due:
In millions of dollars $48 $33 $33 $35 $41 (15%)
% 0.68% 0.47% 0.46% 0.48% 0.59%
Proprietary Mutual Funds / UIT $373 $124 $280 $280 $331 (11%)
Proprietary Money Market Funds 1,015 679 748 690 958 (6%)
Total Proprietary Funds 1,388 803 1,028 970 1,289 (7%)
Third Party Funds 947 599 426 346 420 (56%)
Mutual Fund / UIT Sales at NAV (in millions of dollars) $2,335 $1,402 $1,454 $1,316 $1,709 (27%)
Variable Annuity Premiums & Deposits (in millions of dollars) $270 $330 $385 $381 $304 13%
Branches 371 367 367 367 368 (1%)
ATM-only locations 114 111 109 108 107 (6%)
Proprietary ATMs 2,092 2,086 2,080 2,080 2,055 (2%)
(1) The 4Q00 net credit loss ratio includes a 10 basis point increase related to the adoption of revised FFIEC write-off policies.
Reclassified to conform to the current period's presentation.
Page 4
6. GLOBAL CONSUMER - Banking/Lending
MORTGAGE BANKING (1)
(In millions of dollars)
1Q 2001 vs.
1Q 2Q 3Q 4Q 1Q 1Q 2000 Increase/
2000 2000 2000 2000 2001 (Decrease)
Total Revenues, Net of Interest Expense $223 $226 $225 $238 $242 9%
Adjusted Operating Expenses 99 102 92 101 109 10%
Provision for Loan Losses 9 (1) 1 (7) - (100%)
Core Income Before Taxes and Minority Interest 115 125 132 144 133 16%
Income Taxes 44 48 49 55 51 16%
Minority Interest, Net of Tax 5 6 6 5 5 -
Core Income $66 $71 $77 $84 $77 17%
Average Assets (in billions of dollars) $34 $37 $42 $45 $47 38%
Return on Assets 0.78% 0.77% 0.73% 0.74% 0.66%
EOP Accounts Owned and Serviced (in millions):
Student Loans 2.8 3.0 3.3 3.5 3.5 25%
Mortgages 0.7 0.9 0.9 0.9 0.9 29%
Consumer Finance 0.1 0.1 0.1 0.1 0.1 -
Total 3.6 4.0 4.3 4.5 4.5 25%
Total Owned and Serviced Average Loans (in billion of dollars):
Mortgages (2) $20.1 $21.6 $23.7 $25.8 $26.9 34%
Student Loans 11.6 12.3 14.2 15.3 16.8 45%
Consumer Finance 0.4 0.5 0.7 0.9 1.0 150%
Average Loans - On Balance Sheet 32.1 34.4 38.6 42.0 44.7 39%
Other Serviced Loans 54.1 59.9 61.8 62.6 63.8 18%
Total $86.2 $94.3 $100.4 $104.6 $108.5 26%
Mortgage Originations (in billions of dollars) $3.7 $5.1 $6.2 $5.5 $5.9 59%
Student Loan Originations $1.0 $0.7 $1.4 $1.3 $1.5 50%
Consumer Finance Originations $0.2 $0.3 $0.3 $0.3 $0.3 50%
Net Credit Loss Ratio (3) 0.19% 0.08% 0.09% 0.27% 0.06%
Loans 90+ Days Past Due:
In millions of dollars $733 $722 $723 $846 $957 31%
% 2.28% 2.10% 1.88% 2.01% 2.14%
(1) Includes Student Loans.
(2) Includes loans held for sale.
(3) The 4Q00 net credit loss ratio includes a 16 basis point increase related to the adoption of revised FFIEC write-off policies.
Reclassified to conform to the current period's presentation.
Page 5
7. GLOBAL CONSUMER - Banking/Lending
NORTH AMERICA CARDS (1)
(In millions of dollars)
1Q 2001 vs.
1Q 2Q 3Q 4Q 1Q 1Q 2000 Increase/
2000 2000 2000 2000 2001 (Decrease)
Adjusted Revenues, Net of Interest Expense $2,551 $2,557 $2,737 $2,911 $3,004 18%
Adjusted Operating Expenses 954 972 1,002 1,014 1,039 9%
Adjusted Provision for Loan Losses (2) 990 961 957 1,065 1,221 23%
Core Income Before Taxes 607 624 778 832 744 23%
Income Taxes 225 234 284 303 275 22%
Core Income $382 $390 $494 $529 $469 23%
Managed Average Assets (in billions of dollars) $90 $94 $101 $106 $106 18%
Return on Managed Assets 1.71% 1.67% 1.95% 1.99% 1.79%
N.A. CARDS DATA (3):
(in billions of dollars)
Net Interest Revenue (in millions of dollars) (4) $1,956 $1,899 $2,055 $2,198 $2,371 21%
% of Average Managed Loans 9.29% 8.66% 8.62% 8.83% 9.60%
Risk Adjusted Revenue (in millions of dollars) (5) $1,471 $1,516 $1,701 $1,769 $1,699 15%
% of Average Managed Loans 6.99% 6.91% 7.14% 7.11% 6.88%
Adjusted Operating Expenses as % of Average Managed Loans 4.18% 4.13% 3.92% 3.77% 3.88%
End of Period Managed Receivables $86.1 $92.3 $97.7 $103.2 $100.5 17%
Total EOP Open Accounts (in millions) 78.5 83.9 89.4 90.8 91.7 17%
Total Sales $48.4 $55.3 $55.2 $56.8 $51.2 6%
End of Period Loans:
On Balance Sheet $27.9 $33.5 $37.9 $37.0 $32.6 17%
Securitized 54.5 51.6 53.3 57.2 60.1 10%
Held for Sale 3.4 6.5 5.8 8.1 7.0 106%
Total $85.8 $91.6 $97.0 $102.3 $99.7 16%
Average Loans:
On Balance Sheet $26.9 $32.1 $36.9 $36.9 $34.7 29%
Securitized 54.7 51.7 51.1 55.4 58.5 7%
Held for Sale 3.1 4.4 6.8 6.7 7.0 126%
Total $84.7 $88.2 $94.8 $99.0 $100.2 18%
Net Credit Losses (in millions of dollars):
On Balance Sheet $328 $347 $362 $398 $466 42%
Securitized 631 561 524 592 667 6%
Held for Sale 21 40 56 61 63 200%
Total $980 $948 $942 $1,051 $1,196 22%
Coincident Net Credit Loss Ratio 4.65% 4.32% 3.95% 4.22% 4.84%
12 Month Lagged Net Credit Loss Ratio 5.11% 4.81% 4.67% 5.16% 5.72%
Loans 90+ Days Past Due:
In millions of dollars $1,424 $1,320 $1,463 $1,573 $1,994 40%
% 1.65% 1.44% 1.50% 1.54% 2.00%
(1) Includes N.A. Bankcards, Associates Cards and Diners Club.
(2) On a managed basis.
(3) Excludes Diners Club
(4) Includes delinquency and other risk-based charges.
(5) Risk Adjusted Revenue is adjusted revenues less net credit losses.
Reclassified to conform to the current period's presentation.
Page 6
8. GLOBAL CONSUMER - Banking/Lending
CITIFINANCIAL
(In millions of dollars)
1Q 2001 vs.
1Q 2Q 3Q 4Q 1Q 1Q 2000 Increase/
2000 2000 2000 2000 2001 (Decrease)
Total Revenues, Net of Interest Expense* $1,222 $1,269
### $1,262 $1,318 $1,339 10%
Adjusted Operating Expenses 536 571 568 581 569 6%
Provision for Benefits, Claims, and Credit Losses 404 373 362 407 429 6%
Core Income Before Taxes 282 325 332 330 341 21%
Income Taxes 103 120 119 117 129 25%
Core Income $179 $205 $213 $213 $212 18%
Average Assets (in billions of dollars) $51 $55 $58 $61 $63 24%
Return on Assets 1.41% 1.50% 1.46% 1.39% 1.36%
Net receivables (in billions of dollars):
Real estate-secured loans (1) $33.7 $35.5 $36.7 $38.1 $40.3 20%
Personal loans (2) 9.8 9.7 9.7 9.9 9.8 -
Auto 3.0 3.8 4.2 4.6 5.2 73%
Sales finance and other 2.8 2.6 2.6 2.7 2.4 (14%)
Total of unearned finance charges
net $49.3 $51.6 $53.2 $55.3 $57.7 17%
Number of offices 2,767 2,738 2,699 2,720 2,430 (12%)
Average yield (3) 14.26% 14.16% 14.11% 14.03% 13.93%
Average net interest margin (3) 8.21% 7.84% 7.61% 7.55% 7.70%
Net credit loss ratio (3) 2.92% 2.49% 2.33% 2.57% 2.57%
Loans 90+ Days Past Due:
In millions of dollars $1,044 $1,033 $1,084 $1,272 $1,599 53%
% 2.11% 1.98% 2.00% 2.23% 2.77%
(1) Includes fully secured $.M.A.R.T. receivables,
as follows: $4,106.1 $4,415.7 $4,695.7 $5,170.3 $5,613.3 37%
(2) Includes $.A.F.E. and partially secured $.M.A.R.T.
receivables, as follows: $319.1 $315.7 $311.6 $309.3 $296.5 (7%)
(3) Includes loans held for sale
* Excludes realized gains / (losses) on investments.
Page 7
9. GLOBAL CONSUMER - Insurance
TRAVELERS LIFE AND ANNUITY
(In millions of dollars)
1Q 2001 vs.
1Q 2Q 3Q 4Q 1Q 1Q 2000 Increase/
2000 2000 2000 2000 2001 (Decrease)
Total Revenues, Net of Interest Expense* $1,010 $983 $899 $999 $1,130 12%
Total Operating Expenses 126 97 103 83 88 (30%)
Provision for Benefits and Claims 603 586 531 605 729 21%
Core Income Before Taxes 281 300 265 311 313 11%
Income Taxes 94 98 86 102 103 10%
Core Income $187 $202 $179 $209 $210 12%
Pre-tax contribution by source:
Individual annuities $108 $118 $117 $122 $122 13%
Group annuities 92 114 91 123 117 27%
Life and long term care insurance 60 55 40 46 63 5%
Other (includes run-off and return on excess capital) 21 13 17 20 11 (48%)
Total $281 $300 $265 $311 $313 11%
Individual annuities:
Net written premiums & deposits:
Fixed $293.5 $302.6 $320.3 $350.0 $427.2 46%
Variable 1,245.0 1,258.5 1,273.6 1,247.7 1,098.7 (12%)
Individual Payout 20.5 21.7 20.6 17.0 18.7 (9%)
Total $1,559.0 $1,582.8 $1,614.5 $1,614.7 $1,544.6 (1%)
Policyholder account balances & benefit reserves: (1)
Fixed $7,911.3 $7,904.0 $7,939.8 $8,050.0 $8,271.7 5%
Variable 21,072.7 21,013.2 21,678.1 20,704.0 18,948.3 (10%)
Individual Payout 619.6 626.2 630.0 630.3 631.9 2%
Total $29,603.6 $29,543.4 $30,247.9 $29,384.3 $27,851.9 (6%)
Group annuities:
Net written premiums & deposits (2) $1,456.9 $1,439.1 $1,481.8 $1,149.9 $2,501.6 72%
Policyholder account balances & benefit reserves: (1)
GICs and other investment contracts $11,087.0 $11,204.2 $11,966.9 $12,598.6 $13,732.0 24%
Payout group annuities 4,514.9 4,624.0 4,713.8 4,861.5 5,140.5 14%
Total $15,601.9 $15,828.2 $16,680.7 $17,460.1 $18,872.5 21%
Individual life insurance:
Net written premiums and deposits:
Direct periodic premiums and deposits $116.7 $113.4 $135.8 $144.7 $187.0 60%
Single premium deposits 18.3 21.0 22.3 37.6 47.2 158%
Reinsurance (19.1) (20.3) (21.4) (23.0) (22.6) (18%)
Total $115.9 $114.1 $136.7 $159.3 $211.6 83%
Policyholder account balances & benefit reserves $2,755.3 $2,801.9 $2,911.0 $2,983.3 $3,085.1 12%
Life insurance in force (in billions, face amt.) $61.7 $63.2 $65.2 $66.9 $69.4 12%
Life insurance issued (in billions, face amt.) $2.7 $3.0 $3.1 $2.9 $3.8 41%
All businesses:
Net investment income (pretax) $594.9 $639.1 $609.1 $655.9 $654.9 10%
Interest credited to contractholders $244.7 $248.7 $266.7 $290.4 $291.3 19%
Statutory data:
Travelers Insurance Company
Statutory capital and surplus $5,011.2 $4,977.4 $5,355.1 $5,123.4 $5,024.5 -
Surplus to liabilities ratio 20.5% 20.3% 21.3% 20.2% 18.8%
(1) Includes general account, separate accounts and managed funds.
(2) Excludes deposits of $28.0 for the first quarter of 2001 and $24.0, $45.0 and $251.0 in the first, second, and fourth quarters of 2000,
related to Travelers plans previously managed externally.
* Excludes realized gains / (losses) on investments.
Page 8
10. GLOBAL CONSUMER - Insurance
PRIMERICA FINANCIAL SERVICES
(In millions of dollars)
1Q 2001 vs.
1Q 2Q 3Q 4Q 1Q 1Q 2000 Increase/
2000 2000 2000 2000 2001 (Decrease)
Total Revenues, Net of Interest Expense* $472 $479 $474 $490 $490 4%
Total Operating Expenses 162 159 177 161 169 4%
Provision for Benefits and Claims 125 126 106 139 128 2%
Core Income Before Taxes 185 194 191 190 193 4%
Income Taxes 66 69 67 66 68 3%
Core Income $119 $125 $124 $124 $125 5%
Life Insurance
Face value (in billions) of:
Life insurance issued $15.0 $18.5 $16.8 $17.1 $16.3 9%
Life insurance in force $397.8 $403.6 $408.4 $412.7 $415.4 4%
Annualized issued premiums $44.1 $54.1 $49.5 $50.0 $47.4 7%
Direct premiums $324.5 $330.9 $333.3 $337.6 $340.4 5%
Earned premiums $270.6 $277.4 $275.0 $282.6 $284.0 5%
Other Products
Mutual fund sales at NAV:
Proprietary $465.0 $468.7 $448.5 $428.9 $479.9 3%
Other funds 497.1 552.5 397.8 368.5 330.1 (34%)
Total U.S. mutual fund sales 962.1 1,021.2 846.3 797.4 810.0 (16%)
Mutual fund sales - Canada 228.8 128.1 117.4 119.0 183.8 (20%)
Total mutual fund sales $1,190.9 $1,149.3 $963.7 $916.4 $993.8 (17%)
Cash advanced on $.M.A.R.T. and $.A.F.E. loans (1) $492.0 $475.6 $457.2 $667.5 $694.5 41%
Variable annuity net written premiums and deposits $249.9 $248.0 $270.6 $288.2 $247.6 (1%)
Agents licensed for:
Life insurance 79,818 82,288 85,183 86,900 88,907 11%
Mutual funds 25,570 25,968 27,300 27,961 27,671 8%
$.M.A.R.T. / $.A.F.E. loans 93,055 99,481 105,640 116,491 125,450 35%
Variable annuities 16,453 16,692 17,281 17,777 18,665 13%
Long term care 8,010 7,785 9,612 10,134 10,869 36%
Home & auto insurance 13,238 13,038 12,194 11,647 11,275 (15%)
Financial Needs Analyses submitted 110,900 109,451 108,838 108,705 114,991 4%
(1) The $.M.A.R.T. and $.A.F.E. loan products are marketed by PFS; the receivables are reflected in the assets of CitiFinancial.
* Excludes realized gains / (losses) on investments.
Page 9
11. GLOBAL CONSUMER - Insurance
PERSONAL LINES
(In millions of dollars)
1Q 2001 vs.
1Q 2Q 3Q 4Q 1Q 1Q 2000 Increase/
2000 2000 2000 2000 2001 (Decrease)
Total Revenues, Net of Interest Expense* $1,034 $1,050 $1,058 $1,088 $1,080 4%
Total Operating Expenses 250 256 246 250 267 7%
Claims and Claim Adjustment Expenses 659 673 717 718 688 4%
Core Income Before Taxes and Minority Interest 125 121 95 120 125 -
Income Taxes 38 36 27 37 38 -
Minority Interest, Net of Tax 13 3 - - - (100%)
Core Income (1) $74 $82 $68 $83 $87 18%
Net written premiums by product line:
Auto $588.7 $614.7 $608.7 $596.1 $639.1 9%
Homeowners and other 307.9 378.6 397.1 372.5 322.7 5%
Total net written premiums (a) $896.6 $993.3 $1,005.8 $968.6 $961.8 7%
Net written premiums by distribution channel:
Independent agents $523.0 $592.8 $612.3 $578.8 $561.8 7%
Strategic distribution group 147.3 165.1 176.2 172.2 165.7 12%
Domestics 168.9 177.0 166.9 171.3 187.3 11%
Other 57.4 58.4 50.4 46.3 47.0 (18%)
Total net written premiums (a) $896.6 $993.3 $1,005.8 $968.6 $961.8 7%
Statutory ratio development:
Earned premiums (b) $917.2 $927.7 $937.8 $972.5 $957.9 4%
Losses and loss adjustment expenses (c) 661.5 674.0 719.3 721.0 688.5 4%
Other underwriting expenses (d) 242.1 254.3 260.3 245.3 254.6 5%
Total deductions 903.6 928.3 979.6 966.3 943.1 4%
Statutory underwriting gain/(loss) $13.6 $(0.6) $(41.8) $6.2 $14.8 9%
Statutory combined ratio:
Loss and loss adjustment expense ratio (c / b) 72.1% 72.7% 76.7% 74.1% 71.9%
Other underwriting expense ratio (d / a) 27.0% 25.6% 25.9% 25.3% 26.5%
Combined ratio 99.1% 98.3% 102.6% 99.4% 98.4%
Net investment income (pre-tax) $113.1 $115.2 $113.0 $107.7 $114.1 1%
Effective tax rate on net investment income 29.3% 29.5% 29.4% 29.2% 29.2%
Catastrophe losses, net of reinsurance (after-tax) $30.4 $17.2 $1.9 $4.1 $- (100%)
(1) During April 2000, Travelers Insurance Group Inc. completed a cash tender offer to purchase all the outstanding shares of Class A Common Stock of Travelers Property Casualty Corp. at a
price of $41.95 per share. Results for the periods prior to April 20, 2000 are net of minority interest.
* Excludes realized gains / (losses) on investments.
Reclassified to conform to the current period's presentation.
Page 10
12. GLOBAL CONSUMER - International
WESTERN EUROPE
(In millions of dollars)
1Q 2001 vs.
1Q 2Q 3Q 4Q 1Q 1Q 2000 Increase/
2000 2000 2000 2000 2001 (Decrease)
Total Revenues, Net of Interest Expense $618 $600 $579 $591 $622 1%
Adjusted Operating Expenses 360 363 331 333 347 (4%)
Provision for Benefits, Claims, and Credit Losses 104 92 97 97 99 (5%)
Core Income Before Taxes 154 145 151 161 176 14%
Income Taxes 57 53 56 53 65 14%
Core Income $97 $92 $95 $108 $111 14%
Average Assets (in billions of dollars) $22 $21 $21 $21 $21 (5%)
Return on Assets 1.77% 1.76% 1.80% 2.05% 2.14%
Average Loans (in billions of dollars)
Cards $2.3 $2.2 $2.2 $2.2 $2.0 (13%)
Mortgages 2.1 2.1 2.1 2.1 2.2 5%
Auto 1.3 1.4 1.4 1.5 1.6 23%
Personal 10.1 10.0 9.9 9.9 10.4 3%
Other 1.1 1.1 1.1 1.0 1.1 -
Total $16.9 $16.8 $16.7 $16.7 $17.3 2%
Average Customer Deposits (in billions of dollars) $13.0 $12.5 $12.1 $12.0 $12.9 (1%)
EOP Accounts (in millions) 9.8 9.9 10.0 10.1 9.8 -
EOP Card Accounts (in millions) 2.4 2.5 2.5 2.6 2.1 (13%)
Non-Interest Revenue as % of Total Revenues 32.3% 30.7% 30.8% 31.5% 28.9%
Net Credit Loss Ratio (1) 1.88% 1.84% 2.01% 2.40% 1.92%
Loan 90+ Days Past Due:
In millions of dollars $899 $892 $829 $835 $785 (13%)
% 5.31% 5.18% 5.09% 4.78% 4.68%
Proprietary Mutual Funds / UIT $356 $367 $225 $228 $196 (45%)
Proprietary Money Market Funds 193 109 98 104 154 (20%)
Total Proprietary Funds 549 476 323 332 350 (36%)
Third Party Funds 469 326 436 337 322 (31%)
Mutual Fund / UIT Sales at NAV (in millions of dollars) $1,018 $802 $759 $669 $672 (34%)
Branches 434 434 437 436 432 -
Consumer Finance Offices 128 131 132 130 130 2%
ATM-only locations 33 34 36 33 45 36%
Proprietary ATMs 839 859 875 883 888 6%
(1) The 4Q00 net credit loss ratio includes a 24 basis point increase related to the adoption of revised FFIEC write-off policies.
Reclassified to conform to the current period's presentation.
Page 11
13. GLOBAL CONSUMER - International
JAPAN
(In millions of dollars)
1Q 2001 vs.
1Q 2Q 3Q 4Q 1Q 1Q 2000 Increase/
2000 2000 2000 2000 2001 (Decrease)
Total Revenues, Net of Interest Expense $593 $664 $714 $816 $826 39%
Adjusted Operating Expenses 243 261 268 355 346 42%
Provision for Benefits, Claims, and Credit Losses 105 121 127 147 162 54%
Core Income Before Taxes 245 282 319 314 318 30%
Income Taxes 90 104 110 107 114 27%
Core Income $155 $178 $209 $207 $204 32%
Average Assets (in billions of dollars) $15 $16 $18 $20 $19 27%
Return on Assets 4.16% 4.47% 4.62% 4.12% 4.35%
Average Loans (in billions of dollars)
Mortgages $3.4 $3.8 $4.2 $4.2 $4.2 24%
Cards 0.8 1.1 1.1 1.1 1.0 25%
Personal 5.2 6.0 6.9 8.0 7.9 52%
Other 0.2 0.2 0.2 0.3 0.4 100%
Total $9.6
### $11.1
### $12.4
### $13.6 $13.5 41%
Average Customer Deposits (in billions of dollars) $13.1 $13.5 $13.9 $13.9 $14.3 9%
EOP Accounts (in millions) 4.0 4.2 4.7 4.8 4.9 23%
EOP Card Accounts (in millions) 0.9 0.9 1.0 1.0 1.0 11%
Non-Interest Revenue as % of Total Revenues 11.0% 12.0% 11.0% 10.4% 9.4%
Net Credit Loss Ratio 3.68% 3.19% 3.15% 3.81% 4.06%
Loan 90+ Days Past Due:
In millions of dollars $103 $100 $105 $101 $107 4%
% 0.99% 0.83% 0.76% 0.73% 0.81%
Proprietary Mutual Funds / UIT $67 $78 $178 $75 $99 48%
Proprietary Money Market Funds 273 246 207 71 91 (67%)
Total Proprietary Funds 340 324 385 146 190 (44%)
Third Party Funds 113 104 36 110 92 (19%)
Mutual Fund / UIT Sales at NAV (in millions of dollars) $453 $428 $421 $256 $282 (38%)
Branches 22 22 22 22 22 -
Consumer Finance Offices 685 751 878 902 902 32%
ATM-only locations/Unmanned Kiosks 78 110 139 161 205 163%
Proprietary ATMs 61 61 61 61 61 -
Reclassified to conform to the current period's presentation.
Page 12
14. GLOBAL CONSUMER - International
ASIA (Excluding Japan)
(In millions of dollars)
1Q 2001 vs.
1Q 2Q 3Q 4Q 1Q 1Q 2000 Increase/
2000 2000 2000 2000 2001 (Decrease)
Total Revenues, Net of Interest Expense $539 $519 $521 $517 $540 -
Adjusted Operating Expenses 245 240 233 246 242 (1%)
Provision for Benefits, Claims, and Credit Losses 74 62 71 66 62 (16%)
Core Income Before Taxes 220 217 217 205 236 7%
Income Taxes 79 77 77 73 87 10%
Core Income $141 $140 $140 $132 $149 6%
Average Assets (in billions of dollars) $27 $26 $27 $26 $25 (7%)
Return on Assets 2.10% 2.17% 2.06% 2.02% 2.42%
Average Loans (in billions of dollars)
Mortgages $12.5 $12.2 $12.0 $11.6 $11.5 (8%)
Cards 4.7 4.7 4.8 4.8 4.8 2%
Auto 2.3 2.3 2.4 2.4 2.5 9%
Personal 1.2 1.2 1.3 1.3 1.3 8%
Other 1.9 1.8 1.8 1.7 1.6 (16%)
Total $22.6 $22.2 $22.3 $21.8 $21.7 (4%)
Average Customer Deposits (in billions of dollars) $33.3 $33.5 $34.2 $34.2 $35.1 5%
EOP Accounts (in millions) 7.3 7.5 7.8 8.1 8.4 15%
EOP Card Accounts (in millions) 4.4 4.5 4.7 4.9 5.1 16%
Non-Interest Revenue as % of Total Revenues 34.5% 31.1% 32.4% 30.7% 31.5%
Net Credit Loss Ratio 1.24% 1.07% 1.14% 1.18% 1.14%
Loans 90+ Days Past Due:
In millions of dollars $433 $396 $350 $335 $334 (23%)
% 1.92% 1.75% 1.57% 1.51% 1.58%
Proprietary Mutual Funds / UIT $115 $126 $149 $215 $121 5%
Proprietary Money Market Funds 67 60 49 97 90 34%
Total Proprietary Funds 182 186 198 312 211 16%
Third Party Funds 1,823 825 953 970 812 (55%)
Mutual Fund / UIT Sales at NAV (in millions of dollars) $2,005 $1,011 $1,151 $1,282 $1,023 (49%)
Branches 71 73 76 77 77 8%
ATM-only locations 79 75 74 73 77 (3%)
Proprietary ATMs 300 300 301 303 303 1%
Reclassified to conform to the current period's presentation.
Page 13
15. GLOBAL CONSUMER - International
LATIN AMERICA
(In millions of dollars)
1Q 2001 vs.
1Q 2Q 3Q 4Q 1Q 1Q 2000 Increase/
2000 2000 2000 2000 2001 (Decrease)
Total Revenues, Net of Interest Expense (1) $513 $466 $436 $526 $471 (8%)
Adjusted Operating Expenses 323 327 318 339 337 4%
Provision for Benefits, Claims, and Credit Losses (1) 90 76 69 100 89 (1%)
Core Income Before Taxes 100 63 49 87 45 (55%)
Income Taxes 34 22 17 18 13 (62%)
Core Income $66 $41 $32 $69 $32 (52%)
Average Assets (in billions of dollars) $14 $12 $11 $11 $13 (7%)
Return on Assets 1.90% 1.37% 1.16% 2.50% 1.00%
Average Loans (in billions of dollars)
Cards $1.8 $1.8 $1.7 $1.7 $1.7 (6%)
Mortgages 2.0 2.0 2.1 2.1 2.1 5%
Auto 1.4 1.0 0.9 0.9 0.8 (43%)
Personal 1.8 1.8 1.8 1.8 1.8 -
Other 0.6 0.6 0.5 0.5 0.4 (33%)
Total $7.6 $7.2 $7.0 $7.0 $6.8 (11%)
Average Customer Deposits (in billions of dollars) $13.8 $13.7 $13.6 $13.5 $13.8 -
EOP Accounts (in millions) 8.9 9.3 9.3 9.3 9.4 6%
EOP Card Accounts (in millions) 2.0 1.9 1.9 2.0 2.0 -
Non-Interest Revenue as % of Total Revenues 36.7% 37.4% 39.8% 45.9% 39.6%
Net Credit Loss Ratio (2) 4.77% 4.25% 3.89% 5.58% 4.24%
Loan 90+ Days Past Due:
In millions of dollars $333 $323 $319 $250 $318 (5%)
% 4.58% 4.52% 4.55% 3.66% 4.76%
Proprietary Mutual Funds/UIT Funds $357 $193 $294 $185 $459 29%
Proprietary Money Market Funds 1,174 1,167 939 996 826 (30%)
Total Proprietary Funds $1,531 $1,360 $1,233 $1,181 $1,285 (16%)
Third Party Funds 218 146 126 129 148 (32%)
Mutual Fund / UIT Sales at NAV (in millions of dollars) $1,749 $1,506 $1,359 $1,310 $1,433 (18%)
Branches 453 447 404 406 404 (11%)
Consumer Finance Offices 101 101 101 110 120 19%
ATM-only locations 84 84 89 85 86 2%
Proprietary ATMs 749 753 730 718 727 (3%)
(1) Includes a fourth quarter 2000 year-to-date reclassification which increased both Revenues and Provision for Benefits, Claims, and Credit Losses by $26 million.
(2) The 4Q00 net credit loss ratio includes a 232 basis point increase related to the adoption of revised FFIEC write-off policies.
Reclassified to conform to the current period's presentation.
Page 14
16. GLOBAL CONSUMER - International
CENTRAL & EASTERN EUROPE, MIDDLE EAST & AFRICA
(In millions of dollars)
1Q 2001 vs.
1Q 2Q 3Q 4Q 1Q 1Q 2000 Increase/
2000 2000 2000 2000 2001 (Decrease)
Total Revenues, Net of Interest Expense $100 $106 $110 $117 $131 31%
Adjusted Operating Expenses 67 72 78 88 92 37%
Provision for Benefits, Claims, and Credit Losses 10 8 7 8 9 (10%)
Core Income Before Taxes 23 26 25 21 30 30%
Income Taxes 8 10 9 7 11 38%
Core Income $15 $16 $16 $14 $19 27%
Average Assets (in billions of dollars) $3 $3 $3 $4 $4 33%
Return on Assets 2.01% 2.15% 2.12% 1.39% 1.93%
Average Loans (in billions of dollars)
Cards $0.5 $0.5 $0.6 $0.6 $0.6 20%
Mortgages 0.2 0.2 0.2 0.2 0.2 -
Auto 0.3 0.3 0.3 0.3 0.4 33%
Personal 0.4 0.4 0.4 0.5 0.5 25%
Other 0.5 0.5 0.4 0.4 0.5 -
Total $1.9 $1.9 $1.9 $2.0 $2.2 16%
Average Customer Deposits (in billions of dollars) $3.6 $3.7 $3.9 $4.2 $5.6 56%
EOP Accounts (in millions) 2.2 2.4 2.7 2.8 3.3 50%
EOP Card Accounts (in millions) 1.5 1.6 1.7 1.8 1.9 27%
Non-Interest Revenue as % of Total Revenues 42.3% 42.5% 40.1% 40.8% 39.1% (8%)
Net Credit Loss Ratio (1) 2.60% 1.66% 1.45% 2.10% 1.66%
Loans 90+ Days Past Due:
In millions of dollars $40 $38 $34 $32 $33 (18%)
% 2.16% 1.95% 1.73% 1.37% 1.40%
Proprietary Mutual Funds / UIT $8 $19 $11 $9 $4 (50%)
Proprietary Money Market Funds - - 1 - - -
Total Proprietary Funds 8 19 12 9 4 (50%)
Third Party Funds 154 118 72 36 91 (41%)
Mutual Fund / UIT Sales at NAV (in millions of dollars) $162 $137 $84 $45 $95 (41%)
Branches 36 41 55 58 169 369%
ATM-only locations 50 53 57 65 76 52%
Proprietary ATMs 112 113 119 129 144 29%
(1) The 4Q00 net credit loss ratio includes a 59 basis point increase related to the adoption of revised FFIEC write-off policies.
Reclassified to conform to the current period's presentation.
Page 15
17. GLOBAL CONSUMER
OTHER CONSUMER (1)
(In millions of dollars)
1Q 2001 vs.
1Q 2Q 3Q 4Q 1Q 1Q 2000 Increase/
2000 2000 2000 2000 2001 (Decrease)
Total Revenues, Net of Interest Expense $33 $(21) $94 $33 $(60) NM
Adjusted Operating Expenses 101 49 84 17 38 (62%)
Provision for Loan Losses (4) (8) 26 (9) (30) NM
Core Income (Loss) Before Taxes (Benefits) (64) (62) (16) 25 (68) (6%)
Income Taxes (Benefits) (25) (26) (7) 8 (25) -
Core Income (Loss) $(39) $(36) $(9) $17 $(43) (10%)
(1) Includes unallocated marketing, staff expenses, and certain treasury functions.
NM Not meaningful
Reclassified to conform to the current period's presentation.
Page 16
18. GLOBAL CORPORATE
CORPORATE AND INVESTMENT BANK
(In millions of dollars)
1Q 2001 vs.
1Q 2Q 3Q 4Q 1Q 1Q 2000 Increase/
2000 2000 2000 2000 2001 (Decrease)
Revenues:
Commissions and Fees $1,339 $1,049 $1,021 $1,074 $1,045 (22%)
Asset Management and Administration Fees 500 546 551 572 536 7%
Investment Banking 999 964 1,123 1,001 1,235 24%
Principal Transactions 1,289 996 1,115 841 1,561 21%
Other Income 299 315 196 219 294 (2%)
Total Non-Interest Revenues 4,426 3,870 4,006 3,707 4,671 6%
Net Interest and Dividends 851 928 901 975 992 17%
Total Revenues, Net of Interest Expense 5,277 4,798 4,907 4,682 5,663 7%
Non-Interest Expenses:
Compensation and Benefits 2,412 2,415 2,542 2,462 2,895 20%
Communications 223 242 254 276 256 15%
Occupancy and Equipment 166 176 182 194 195 17%
Floor Brokerage and Other Production 162 161 184 182 213 31%
Other Operating and Administrative Expenses 198 283 252 265 301 52%
Total Non-Interest Expenses 3,161 3,277
### 3,414 3,379 3,860 22%
Provision for Credit Losses 90 160 113 392 230 156%
Core Income Before Taxes and Minority Interest 2,026 1,361 1,380 911 1,573 (22%)
Income Taxes and Minority Interest, Net of Tax 748 455 503 327 559 (25%)
Core Income $1,278 $906 $877 $584 $1,014 (21%)
Pre-tax profit margin 38.4% 28.4% 28.1% 19.5% 27.8%
Non-Compensation Expenses as a Percent of
Net Revenues 14.2% 18.0% 17.8% 19.6% 17.0%
Reclassified to conform to the current period's presentation.
Page 17