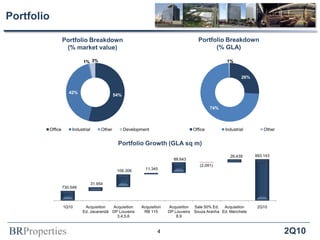
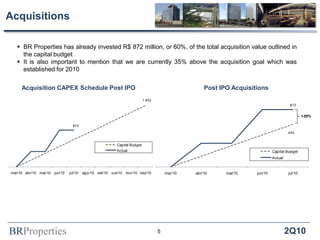
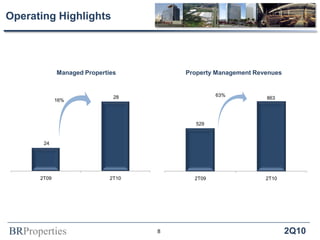
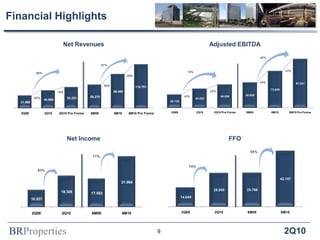
2Q10 Earnings Release
August 12th, 2010
BRProperties
BRProperties 2Q10
Highlights
2
Financial
Highlights
Operating
Highlights
 We have reached 60% of the acquisition goal proposed in the capital budget in just 4 months after
the Company’s IPO. During the period, we acquired the following properties: CBOP – Ed.
Jacarandá, DP Louveira 3, 4, 5, 6, 8 & 9, RB 115 and Ed. Manchete for a total investment value of
R$ 872 million
 At the end of 2Q10, our portfolio had 993.143 sq m of gross leasable area (GLA), a 36% increase
compared to the same period of 2009
 Increase in the number of managed properties, from 24 in 2Q09 to 28 in 2Q10
 Our property management revenues increased by 63% in 2Q10 compared to 2Q09
 Consolidation of the financing strategy utilizing real estate financing, which represents 92% of our
total debt; R$ 168 million in new financing was raised during the quarter
 2Q10 gross revenues increased by 39% compared to 2Q09
 Adjusted EBITDA, excluding stock option plan expenses and bonus provision, of R$ 35.5 million at
the end of 2Q10, an increase of 43% over 2Q09
 2Q10 adjusted EBITDA pro-forma of R$ 46,5 million, with an 87% EBITDA margin
 Net income of R$ 19,3 million, an 83% increase over 2Q09
 Consolidated FFO totaled R$ 25,5 million, with a 57% FFO margin
BRProperties 2Q10
Recent Acquisitions
 On June 2nd 2010, we acquired the commercial office building RB 115,
located in the downtown region of Rio de Janeiro/RJ for R$ 94,1 million
Property Overview:
GLA: 11.345 sq m
% Acquired: 90%
# floors: 20
Complete retrofit under way
 On June 17th 2010, we acquired, for R$ 157 million, 2 warehouses
located in the logistics complex DP Louveira, where the Company
already owned 6 other properties
Property Overview:
GLA: 88.643 sq m
% Acquired 100%
# warehouses: 2
92% leased
 On June 30th 2010, we acquired, for R$ 260 million, the Manchete office
building in the Flamengo region of Rio de Janeiro/RJ
Property Overview:
GLA: 26.439 sq m
% Acquired: 100%
# floors: 12
Complete retrofit under way
Edifício RB 115
DP Louveira 8 & 9
Edifício Manchete
3
BRProperties 2Q10
Portfolio
Portfolio Growth (GLA sq m)
Portfolio Breakdown
(% market value)
Portfolio Breakdown
(% GLA)
4
54%
42%
1% 3%
Office Industrial Other Development
26%
74%
1%
Office Industrial Other
730.548
993.143
31.954
106.306 11.345
88.643
(2.091)
26.439
1Q10 Acquisition
Ed. Jacarandá
Acquisition
DP Louveira
3,4,5,6
Acquisition
RB 115
Acquisition
DP Louveira
8,9
Sale 50% Ed.
Souza Aranha
Acquisition
Ed. Manchete
2Q10
BRProperties 2Q10
 BR Properties has already invested R$ 872 million, or 60%, of the total acquisition value outlined in
the capital budget
 It is also important to mention that we are currently 35% above the acquisition goal which was
established for 2010
Acquisitions
Acquisition CAPEX Schedule Post IPO Post IPO Acquisitions
5
872
mar/10 abr/10 mai/10 jun/10 jul/10 ago/10 set/10 out/10 nov/10 dez/10
Capital Budget
Actual
1.452
645
872
mar/10 abr/10 mai/10 jun/10 jul/10
Capital Budget
Actual
+35%
BRProperties 2Q10
 Our financial vacancy was 10.4% in the period; Excluding Ed. Jacarandá, of which we only paid an
advance of 18%, and TNU, which is currently under retrofit, our financial vacancy is currently 3.0%
Operating Highlights
Vacancy Breakdown
 Despite the recent increase in our portfolio vacancy, the lease-up outlook for the vacant areas is
very positive given the increased demand and most importantly the high quality of our properties
 We expect the portfolio vacancy to return to its historic levels in the short term
Vacancy per Property
6
6,0%
6,6%
3,7%
8,3%
10,4%
3,0%
1Q10 2Q10 2Q10 Ex CBOP & TNU
Physical
Financial
4,1%
3,3%
1,0%
0,9%
0,6%
0,3%
0,2%0,1%
Castelo Branco Office Park
TNU
Piraporinha
Cond.Ind.São José dos
Campos
DP Louveira 9
Raja Hills
Plaza Centenário
BRProperties 2Q10
% Revenues
% GLA
% GLA
2% 5%
6% 37%
49%
2010 2011 2012 2013 >2013
1% 7%
9%
34%
51%
2010 2011 2012 2013 >2013
% Revenues
20%
41%
24%
13%
1%
2010 2011 2012 2013 >2013
19%
47%
24%
9% 1%
2010 2011 2012 2013 >2013
Lease Contract 3 Year Market Alignment Schedule
Lease Contract Expiration Schedule
7
Operating Highlights
BRProperties 2Q10
Managed Properties Property Management Revenues
24
28
2T09 2T10
16%
529
863
2T09 2T10
63%
8
Operating Highlights
BRProperties 2Q10
Net Revenues Adjusted EBITDA
Net Income FFO
9
Financial Highlights
31.989
44.889
53.223 59.270
86.489
110.701
2Q09 2Q10 2Q10 Pro Forma 6M09 6M10 6M10 Pro Forma
40%
19%
66%
46%
28%
87%
26.735
38.202
46.536 50.995
73.639
97.851
2Q09 2Q10 2Q10 Pro Forma 6M09 6M10 6M10 Pro Forma
43%
22%
44%
33%74%
92%
10.537
19.305 17.553
31.064
2Q09 2Q10 6M09 6M10
83%
77%
14.649
25.550 25.786
42.187
2Q09 2Q10 6M09 6M10
74%
64%
BRProperties 2Q10
Pro-Forma Estimates
Additional Pro-forma Gross Revenues
(non audited)
Adjusted EBITDA
(non audited)
Methodology
 Considers that the in place revenues for the
properties acquired throughout 2010 were incurred
since the beginning of the year
Results
 2Q10 adjusted EBITDA pro-forma totaled R$46,5
million, 22% above 2Q10 adjusted EBITDA
 6M10 adjusted EBITDA pro-forma 6M10 totaled
R$97,8 million, 33% above 6M10 adjusted EBITDA
 Adjusted EBITDA pro-forma margin of 87% and 88%
in 2Q10 and 6M10, respectively
10
49.237
57.987
726
-
675
2.381
1.383
3.585
2Q10 Actual BBP DP
Araucária
TNU Ed.
Jacarandá
Louveira
3-6
Louveira
8-9
2Q10
Pro-forma
38.201
46.536
73.639
97.851
85%
87%
85%
88%
65%
70%
75%
80%
85%
90%
25.000
35.000
45.000
55.000
65.000
75.000
85.000
95.000
105.000
2Q10 Actual 2Q10 Pro-
forma
6M10 Actual 6M10 Pro-
forma
EBITDA Margin
BRProperties 2Q10
Debt
Debt Amortization Schedule
Net Debt 2Q10 Debt Index Breakdown
 Comfortable amortization schedule in the next few years, with low refinancing risk
92%
4%4%
TR
IGPM
CDI
41.886
59.665
75.989 70.399
93.016 89.560 99.408
242.290
59.921 48.411
14.632
1.027
2010 2011 2012 2013 2014 2015 2016 2017 2018 2019 2020 2021
11
112
955
558
59
784 396
STDebt Obligations
for
Acquisitions
LTDebt TotalDebt Cash NetDebt
BRProperties 2Q10
Glossary
EBITDA (Earnings Before Income, Tax, Depreciation and Amortization): a non accounting measure which
measures the Company’s capacity to generate operational revenues, without considering its capital structure.
Measured by excluding the operational expenses from Gross Profit and adding back the depreciation and
amortization expenses for the period
(Gross Profit – General and Administrative Expenses + Depreciation + Amortization)
Adjusted EBITDA: adjustments made to EBITDA by excluding R$ 0.2 million from expenses regarding the
Company stock option plan, along with R$ 1.1 million in employee bonus provisions
FFO (Funds From Operations): non accounting measure, which adds back depreciation to net income in order
to determine, utilizing the income statement, the net cash generated in the period
(Net Income + Depreciation)
Vacancy - Financial: estimated by multiplying the average rent per sqm which could be charged in the buildings
and their respective vacant areas, and then dividing this result by the potential gross revenues of each
property. Indicates the percentage of potential revenue which is lost each month due to vacancy
Vacancy - Physical: estimated by dividing the total vacant area by the total GLA of the portfolio
- 12 -
BRProperties 2Q10
IR Contacts
Investor Relations
Pedro Daltro
CFO & Investor Relations Officer
Leonardo Fernandes
Investor Relations Manager
Marcos Oliveira
Investor Relations Analyst
Phone: (55 11) 3201-1000
Email: ri@brpr.com.br
www.brpr.com.br/ri
13

2 q10 results presentation

  • 1.
    2Q10 Earnings Release August12th, 2010 BRProperties
  • 2.
    BRProperties 2Q10 Highlights 2 Financial Highlights Operating Highlights  Wehave reached 60% of the acquisition goal proposed in the capital budget in just 4 months after the Company’s IPO. During the period, we acquired the following properties: CBOP – Ed. Jacarandá, DP Louveira 3, 4, 5, 6, 8 & 9, RB 115 and Ed. Manchete for a total investment value of R$ 872 million  At the end of 2Q10, our portfolio had 993.143 sq m of gross leasable area (GLA), a 36% increase compared to the same period of 2009  Increase in the number of managed properties, from 24 in 2Q09 to 28 in 2Q10  Our property management revenues increased by 63% in 2Q10 compared to 2Q09  Consolidation of the financing strategy utilizing real estate financing, which represents 92% of our total debt; R$ 168 million in new financing was raised during the quarter  2Q10 gross revenues increased by 39% compared to 2Q09  Adjusted EBITDA, excluding stock option plan expenses and bonus provision, of R$ 35.5 million at the end of 2Q10, an increase of 43% over 2Q09  2Q10 adjusted EBITDA pro-forma of R$ 46,5 million, with an 87% EBITDA margin  Net income of R$ 19,3 million, an 83% increase over 2Q09  Consolidated FFO totaled R$ 25,5 million, with a 57% FFO margin
  • 3.
    BRProperties 2Q10 Recent Acquisitions On June 2nd 2010, we acquired the commercial office building RB 115, located in the downtown region of Rio de Janeiro/RJ for R$ 94,1 million Property Overview: GLA: 11.345 sq m % Acquired: 90% # floors: 20 Complete retrofit under way  On June 17th 2010, we acquired, for R$ 157 million, 2 warehouses located in the logistics complex DP Louveira, where the Company already owned 6 other properties Property Overview: GLA: 88.643 sq m % Acquired 100% # warehouses: 2 92% leased  On June 30th 2010, we acquired, for R$ 260 million, the Manchete office building in the Flamengo region of Rio de Janeiro/RJ Property Overview: GLA: 26.439 sq m % Acquired: 100% # floors: 12 Complete retrofit under way Edifício RB 115 DP Louveira 8 & 9 Edifício Manchete 3
  • 4.
    BRProperties 2Q10 Portfolio Portfolio Growth(GLA sq m) Portfolio Breakdown (% market value) Portfolio Breakdown (% GLA) 4 54% 42% 1% 3% Office Industrial Other Development 26% 74% 1% Office Industrial Other 730.548 993.143 31.954 106.306 11.345 88.643 (2.091) 26.439 1Q10 Acquisition Ed. Jacarandá Acquisition DP Louveira 3,4,5,6 Acquisition RB 115 Acquisition DP Louveira 8,9 Sale 50% Ed. Souza Aranha Acquisition Ed. Manchete 2Q10
  • 5.
    BRProperties 2Q10  BRProperties has already invested R$ 872 million, or 60%, of the total acquisition value outlined in the capital budget  It is also important to mention that we are currently 35% above the acquisition goal which was established for 2010 Acquisitions Acquisition CAPEX Schedule Post IPO Post IPO Acquisitions 5 872 mar/10 abr/10 mai/10 jun/10 jul/10 ago/10 set/10 out/10 nov/10 dez/10 Capital Budget Actual 1.452 645 872 mar/10 abr/10 mai/10 jun/10 jul/10 Capital Budget Actual +35%
  • 6.
    BRProperties 2Q10  Ourfinancial vacancy was 10.4% in the period; Excluding Ed. Jacarandá, of which we only paid an advance of 18%, and TNU, which is currently under retrofit, our financial vacancy is currently 3.0% Operating Highlights Vacancy Breakdown  Despite the recent increase in our portfolio vacancy, the lease-up outlook for the vacant areas is very positive given the increased demand and most importantly the high quality of our properties  We expect the portfolio vacancy to return to its historic levels in the short term Vacancy per Property 6 6,0% 6,6% 3,7% 8,3% 10,4% 3,0% 1Q10 2Q10 2Q10 Ex CBOP & TNU Physical Financial 4,1% 3,3% 1,0% 0,9% 0,6% 0,3% 0,2%0,1% Castelo Branco Office Park TNU Piraporinha Cond.Ind.São José dos Campos DP Louveira 9 Raja Hills Plaza Centenário
  • 7.
    BRProperties 2Q10 % Revenues %GLA % GLA 2% 5% 6% 37% 49% 2010 2011 2012 2013 >2013 1% 7% 9% 34% 51% 2010 2011 2012 2013 >2013 % Revenues 20% 41% 24% 13% 1% 2010 2011 2012 2013 >2013 19% 47% 24% 9% 1% 2010 2011 2012 2013 >2013 Lease Contract 3 Year Market Alignment Schedule Lease Contract Expiration Schedule 7 Operating Highlights
  • 8.
    BRProperties 2Q10 Managed PropertiesProperty Management Revenues 24 28 2T09 2T10 16% 529 863 2T09 2T10 63% 8 Operating Highlights
  • 9.
    BRProperties 2Q10 Net RevenuesAdjusted EBITDA Net Income FFO 9 Financial Highlights 31.989 44.889 53.223 59.270 86.489 110.701 2Q09 2Q10 2Q10 Pro Forma 6M09 6M10 6M10 Pro Forma 40% 19% 66% 46% 28% 87% 26.735 38.202 46.536 50.995 73.639 97.851 2Q09 2Q10 2Q10 Pro Forma 6M09 6M10 6M10 Pro Forma 43% 22% 44% 33%74% 92% 10.537 19.305 17.553 31.064 2Q09 2Q10 6M09 6M10 83% 77% 14.649 25.550 25.786 42.187 2Q09 2Q10 6M09 6M10 74% 64%
  • 10.
    BRProperties 2Q10 Pro-Forma Estimates AdditionalPro-forma Gross Revenues (non audited) Adjusted EBITDA (non audited) Methodology  Considers that the in place revenues for the properties acquired throughout 2010 were incurred since the beginning of the year Results  2Q10 adjusted EBITDA pro-forma totaled R$46,5 million, 22% above 2Q10 adjusted EBITDA  6M10 adjusted EBITDA pro-forma 6M10 totaled R$97,8 million, 33% above 6M10 adjusted EBITDA  Adjusted EBITDA pro-forma margin of 87% and 88% in 2Q10 and 6M10, respectively 10 49.237 57.987 726 - 675 2.381 1.383 3.585 2Q10 Actual BBP DP Araucária TNU Ed. Jacarandá Louveira 3-6 Louveira 8-9 2Q10 Pro-forma 38.201 46.536 73.639 97.851 85% 87% 85% 88% 65% 70% 75% 80% 85% 90% 25.000 35.000 45.000 55.000 65.000 75.000 85.000 95.000 105.000 2Q10 Actual 2Q10 Pro- forma 6M10 Actual 6M10 Pro- forma EBITDA Margin
  • 11.
    BRProperties 2Q10 Debt Debt AmortizationSchedule Net Debt 2Q10 Debt Index Breakdown  Comfortable amortization schedule in the next few years, with low refinancing risk 92% 4%4% TR IGPM CDI 41.886 59.665 75.989 70.399 93.016 89.560 99.408 242.290 59.921 48.411 14.632 1.027 2010 2011 2012 2013 2014 2015 2016 2017 2018 2019 2020 2021 11 112 955 558 59 784 396 STDebt Obligations for Acquisitions LTDebt TotalDebt Cash NetDebt
  • 12.
    BRProperties 2Q10 Glossary EBITDA (EarningsBefore Income, Tax, Depreciation and Amortization): a non accounting measure which measures the Company’s capacity to generate operational revenues, without considering its capital structure. Measured by excluding the operational expenses from Gross Profit and adding back the depreciation and amortization expenses for the period (Gross Profit – General and Administrative Expenses + Depreciation + Amortization) Adjusted EBITDA: adjustments made to EBITDA by excluding R$ 0.2 million from expenses regarding the Company stock option plan, along with R$ 1.1 million in employee bonus provisions FFO (Funds From Operations): non accounting measure, which adds back depreciation to net income in order to determine, utilizing the income statement, the net cash generated in the period (Net Income + Depreciation) Vacancy - Financial: estimated by multiplying the average rent per sqm which could be charged in the buildings and their respective vacant areas, and then dividing this result by the potential gross revenues of each property. Indicates the percentage of potential revenue which is lost each month due to vacancy Vacancy - Physical: estimated by dividing the total vacant area by the total GLA of the portfolio - 12 -
  • 13.
    BRProperties 2Q10 IR Contacts InvestorRelations Pedro Daltro CFO & Investor Relations Officer Leonardo Fernandes Investor Relations Manager Marcos Oliveira Investor Relations Analyst Phone: (55 11) 3201-1000 Email: ri@brpr.com.br www.brpr.com.br/ri 13