The document summarizes the company's 2Q07 results. It discusses the company's profile, activities, 2Q07 highlights and financial results. Key points include:
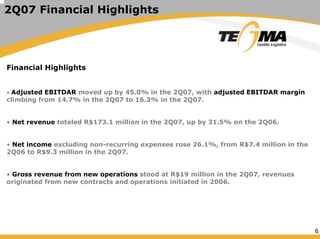
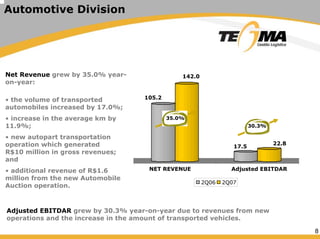
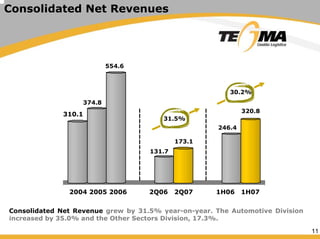
- Net revenue increased 31.5% to R$173.1 million in 2Q07 driven by growth in the automotive and other sectors divisions.
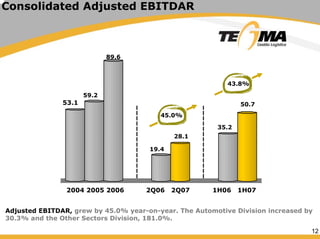
- Adjusted EBITDAR rose 45% to R$28.1 million in 2Q07 with margins expanding from 14.7% to 16.3%.
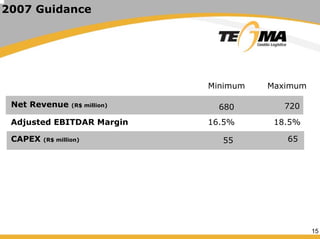
- For 2007, the company expects net revenue between R$680-720 million and adjusted EBITDAR margin of 16.5-18.5%.