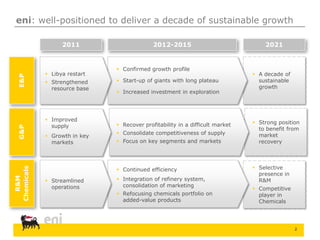
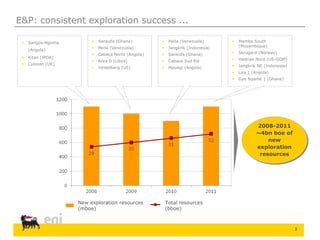
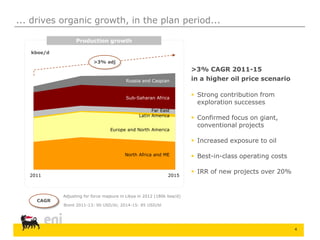
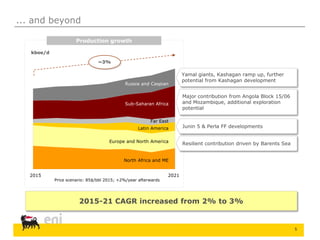
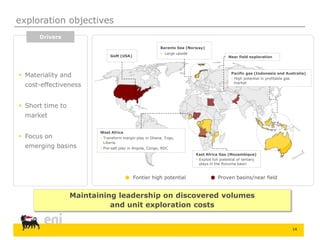
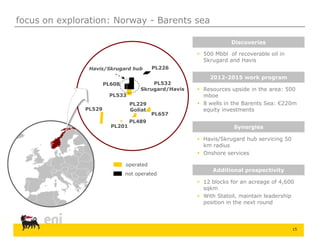
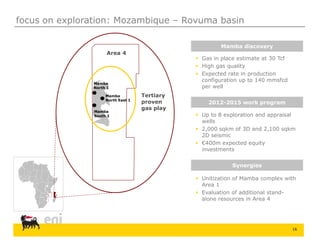
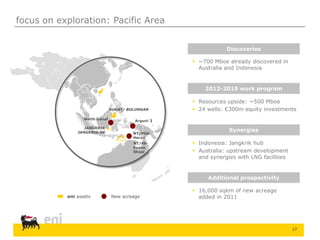
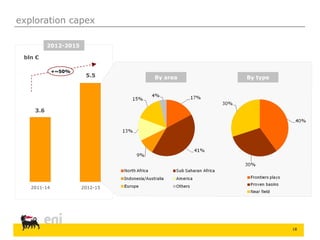
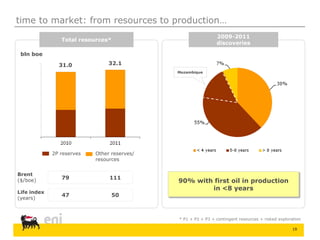
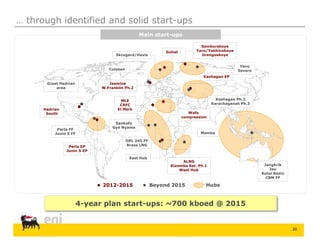
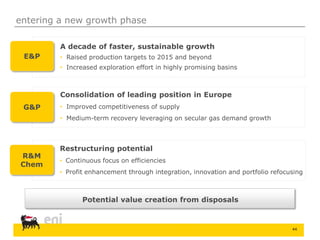
eni.com
2012-2015 Strategy
15 March 2012
2
eni: well-positioned to deliver a decade of sustainable growth
2012-2015 20212011
E&P
 Confirmed growth profile
 Start-up of giants with long plateau
 Increased investment in exploration
 Libya restart
 Strengthened
resource base
 A decade of
sustainable
growth
G&P
 Recover profitability in a difficult market
 Consolidate competitiveness of supply
 Focus on key segments and markets
 Strong position
to benefit from
market
recovery
R&M
Chemicals
 Continued efficiency
 Integration of refinery system,
consolidation of marketing
 Refocusing chemicals portfolio on
added-value products
 Selective
presence in
R&M
 Competitive
player in
Chemicals
 Streamlined
operations
 Improved
supply
 Growth in key
markets
3
E&P: consistent exploration success ...
 Mamba South
(Mozambique)
 Skrugard (Norway)
 Hadrian Nord (US-GOM)
 Jangkrik NE (Indonesia)
 Lira 1 (Angola)
 Gye Nyame 1 (Ghana)
 Sangos-Ngoma
(Angola)
 Kitan (JPDA)
 Culzean (UK)
 Sankofa (Ghana)
 Perla (Venezuela)
 Cabaca Norte (Angola)
 Area D (Libya)
 Heidelberg (US)
 Perla (Venezuela)
 Jangkrik (Indonesia)
 Sankofa (Ghana)
 Cabaca Sud Est
 Mpungi (Angola)
2008-2011
~4bn boe of
new
exploration
resources
New exploration resources
(mboe)
Total resources
(bboe)
4
... drives organic growth, in the plan period...
Adjusting for force majeure in Libya in 2012 (180k boe/d)
CAGR
Brent 2011-13: 90 USD/bl; 2014-15: 85 USD/bl
>3% CAGR 2011-15
in a higher oil price scenario
 Strong contribution from
exploration successes
 Confirmed focus on giant,
conventional projects
 Increased exposure to oil
 Best-in-class operating costs
 IRR of new projects over 20%
2011 2015
kboe/d
Production growth
>3% adj
Russia and Caspian
Sub-Saharan Africa
North Africa and ME
Far East
Latin America
Europe and North America
5
Production growth
kboe/d
Russia and Caspian
Sub-Saharan Africa
North Africa and ME
Far East
Latin America
Europe and North America
~3%
2015 2021
2015-21 CAGR increased from 2% to 3%
Price scenario: 85$/bbl 2015; +2%/year afterwards
Resilient contribution driven by Barents Sea
Junin 5 & Perla FF developments
Major contribution from Angola Block 15/06
and Mozambique, additional exploration
potential
Yamal giants, Kashagan ramp up, further
potential from Kashagan development
... and beyond
6
G&P: positioned to tackle difficult short term scenario...
* Adjusted for outcome of renegotiations and Libya impact
Marketing: facing difficult scenario
 Slower than expected demand
growth
 Spot/LT differential remains
significant in 2012
eni 2012-2015 strategy
 Leverage on more competitive
supply portfolio to grow market
share in Italy and key European
markets
 Further increase exposure to more
resilient retail segment
 Capture benefits of market
volatility through enhanced trading
capabilities
Gradual recovery in
profitability
 TMPC, TTPC, Greenstream, BSPC,
other regulated business
 Stable profitability and cash flow
throughout the plan
Snam
TAG/TENP/Transitgas
Other
G&P
Marketing
Regulated/
Low-risk
business
Asset
disposed/
to be disposed
 TMPC, TTPC, Greenstream, BSPC,
other regulated business
 Stable profitability and cash flow
throughout the plan
2011 EBITDA pro-forma adjusted*
(€ mln)
7
… and capture medium-term recovery opportunities
European demand recovery:
 Strong European market position
 Consolidated brand
 Expertise in innovative offering structure
 Diversified and flexible supply
portfolio
 Competitive cost position in tightened
market
 Increased equity gas supply
 New profit opportunities
 Enhanced LNG presence
 Cross-regional and cross-commodities
synergies in trading
EU 27 (bcm)
-8%
~18%
 Economic growth
 Energy/environmental policies
Tightening supply capacity:
 Increasing Far East demand
 Increasing MENA domestic gas consumption
 Declining European domestic production
 Limited LNG capacity for the Atlantic basin
Long-term scenario
Well positioned to capture
additional growth
8
R&M: increasing efficiency and complexity
 Refining: a cyclical business in a difficult
short term scenario
 Increased focus on complexity and efficiency
to benefit from potential scenario recovery
 EST completion by 2012
 Increased system integration
 Exploit flexibility and asset-backed trading
Optimisation
& efficiency
+ €400m
 Marketing: confirming profitability
 Consolidation of Italian leadership
 Network enhancement and automation
 Expansion of non-oil activities
Italian retail
market share
>30%
9
Chemicals: a new turnaround strategy
More efficient
and integrated  Savings >€200m by 2015
Enhanced
differentation
 Increase revenues from
added value products
from <30% to >40%
International
expansion
 > 10% of revenues from
outside Europe by 2015
 Licensing, production
alliances/JVs
Regaining
competitiveness
within chemicals
business
2015 target
> €400m of EBIT at
constant scenario
10
GalpSnam
Separation by September 2013
Process evaluated on 3 criteria:
 Benefits to eni shareholders
 Protection of the interests of Snam
shareholders
 Consolidation of eni balance sheet
Non-core shareholding
High potential business, with exciting
positions in Brazil, Mozambique
Upside from market value recovery
enhanced value creation opportunities from non-core listed assets
eni.com
Exploration & Production
Claudio Descalzi
12
 Strong focus on exploration strategy and execution
 Fast time-to-market of exploration discoveries
 Rapid and efficient development of project pipeline
 Effective reservoir management and production
optimization activities
 Leading-edge technology to fight depletion of giant fields
 Consolidate and deploy competencies and technology
 Increase direct control of assets through operatorship
 Maintain geographical diversification
 Phase financial exposure in large-scale, complex projects
Organic growth &
value creation
Managing
uncertainties
E&P strategic goals and drivers
13
Drilled wells
HSE results
Lost time injury frequency rate*
* n. of LTI/Mln of worked hours
Company Contractor Global
Avg 2007-2010 2011
0.66
0.77
0.73
0.41 0.42 0.41
2005 2008 2011
0.00 0.000.00
250
327
437
Drilled wells per year
Blow-out frequency
(per thousand)
14
 Materiality and
cost-effectiveness
 Short time to
market
 Focus on
emerging basins
West Africa
 Transform margin play in Ghana, Togo,
Liberia
 Pre-salt play in Angola, Congo, RDC
Near field exploration
East Africa Gas (Mozambique)
 Exploit full potential of tertiary
plays in the Rovuma basin
Barents Sea (Norway)
 Large upside
GoM (USA)
Pacific gas (Indonesia and Australia)
 High potential in profitable gas
market
Maintaining leadership on discovered volumes
and unit exploration costs
Drivers
Fontier high potential Proven basins/near field
exploration objectives
15
focus on exploration: Norway - Barents sea
2012-2015 work program
 Resources upside in the area: 500
mboe
 8 wells in the Barents Sea: €220m
equity investments
Synergies
 Havis/Skrugard hub servicing 50
km radius
 Onshore services
Additional prospectivity
 12 blocks for an acreage of 4,600
sqkm
 With Statoil, maintain leadership
position in the next round
Discoveries
 500 Mbbl of recoverable oil in
Skrugard and Havis
PL226
PL533
PL529
PL201
PL489
PL229
Goliat
PL608 PL532
Skrugard/Havis
PL657
Havis/Skrugard hub
operated
not operated
16
Area 4
Mamba
North 1
Tertiary
proven
gas play
Mamba
North East 1
Mamba
South 1
focus on exploration: Mozambique – Rovuma basin
2012-2015 work program
 Up to 8 exploration and appraisal
wells
 2,000 sqkm of 3D and 2,100 sqkm
2D seismic
 €400m expected equity
investments
Synergies
 Unitization of Mamba complex with
Area 1
 Evaluation of additional stand-
alone resources in Area 4
Mamba discovery
 Gas in place estimate at 30 Tcf
 High gas quality
 Expected rate in production
configuration up to 140 mmsfcd
per well
17
2012-2015 work program
 Resources upside: ~500 Mboe
 24 wells: €300m equity investments
Synergies
 Indonesia: Jangkrik hub
 Australia: upstream development
and synergies with LNG facilities
Additional prospectivity
 16,000 sqkm of new acreage
added in 2011
Discoveries
 ~700 Mboe already discovered in
Australia and Indonesia
eni assets New acreage
BUKAT/ BULUNGAN
North Ganal
JANGKRIK
JANGKRIK NE
Arguni 1
NT/P68-
Heron
NT/48-
Evans
Shoal
focus on exploration: Pacific Area
18
2012-2015
2012-152011-14
bln €
5.5
3.6
+~50%
By area By type
exploration capex
19
* P1 + P2 + P3 + contingent resources + risked exploration
bln boe
Brent
($/boe) 111
Life index
(years)
50
2P reserves Other reserves/
resources
90% with first oil in production
in <8 years
Mozambique
32.131.0
79
47
Total resources*
2009-2011
discoveries
time to market: from resources to production…
20
Main start-ups
4-year plan start-ups: ~700 kboed @ 2015
Samburskoye
Yaro/Yakhinskoye
Urengoskoye
ALNG
Kizomba Sat. Ph.1
West Hub
Perla EP
Junin 5 EP
Jangkrik
Jau
Kutai Basin
CBM FF
Skrugard/Havis
East Hub
Great Hadrian
area
2012-2015 Hubs
Jasmine
W.Franklin Ph.2
Culzean
OPL 245 FF
Brass LNG
Kashagan EP
Goliat
… through identified and solid start-ups
Yevo
Severo
Beyond 2015
Perla FF
Junin 5 FF
MLE
CAFC
El Merk
Wafa
compression
Mamba
Sankofa
Gye Nyame
Hadrian
South
Kashagan Ph.2
Karachaganak Ph.3
21
Yamal Nenets region: new gas giants
 Samburgskoye and Urengoskoye
sanctioned in 2011
 GSA signed with Gazprom
 Samburgskoye start up confirmed 2012
Samburgskoye
UrengoskoyeSevero- Chaselskoye
Yaro-Yakhinskoye
Samburgskoye Production (kboed, equity)
22
Barents Sea: Goliat first oil development
Barents Sea
 First oil development in the Barents Sea
 Subsea templates installation campaign
completed in 2011 and ready for drilling
 FPSO delivery in 2013
Production (kboed, equity)Goliat
23
Kashagan
Karachaganak
 Kashagan EP
 Construction completion and
commissioning ongoing
 Tranches 1&2 progress for KCP:
99%, in line with commercial
production start up within 2012
 Karachaganak
 Previous development phases
currently producing >100 kboed
equity
 Agreed settlement with Republic of
Kazakhstan
Kazakhstan Production (kboed, equity)
Kazakhstan: near-term growth and significant long-term potential
24
Venezuela: super giants with long-term plateau
Junín-5
Perla
 Perla
 Gas Sales Agreement and FID for Phase
1 achieved in 2011
 Phase 1: construction and installation of
three offshore platforms, 60-km pipeline
to shore, onshore processing facility
 Junìn EP
 Finalizing all the major engineering
contracts
 Seeking anticipated early production in
2012, using synergies with PDVSA
existing facilities
Venezuela Production (kboed, equity)
25
Sub-Saharan: legacy area with further growth prospects
 Development of Sangos, Ngoma, Cinguvu
fields (1,250-1,450m water depth)
 16 wells (10 producers, 6 injectors)
 First drilling campaign: ongoing
 FPSO will be delivered in 1Q 2014
* exploration potential excluded
Block 15/06 West Hub Production* (kboed, equity)
26
investment plan
Onshore
Offshore
Deepwater
By type
N. Africa/M. East America
Europe Asia Pacific
Central Asia/Russia West Africa
By area
bln €
Development
Exploration
Other
Capex 2012-2015
Mozambique
44.8
39.1
+14%
1.8
3.6
5.5
1.7
3.1
33.7 37.6
27
Brent
($/boe)
2012/2013 2014/2015 2015
90 85 +2%
>3%
~3%
CAGR
Organic production growth
 Strong production
growth of over 3% a
year to 2015 adjusted
for Libya in 2011
 Resilient to oil price
increases: 2011-2015
CAGR at 100$/bbl ~3%
 Long-term growth target
raised from ~2% to
~3%
our commitment: production
New productionLibya force majeure
28
our commitment: value
Solid cash generation
90
100
110
120
2010 2015
NPV 2P by areas
Sub-Saharan Africa
Europe & America Asia & Pacific
North Africa
CF/boe (%)
Brent avg
($/boe)
Cash flow
85 85
eni.com
Gas & Power
Umberto Vergine
30
European gas market: a difficult short term environment…
Persisting oversupply in Europe in the near term
Spot-LT price differential remains significant
Continuing competitive pressure
Supply Demand
 Weak economic situation in
Europe impacting industrial
clients
 Increased competition in
powergen from renewable
sources
 Relatively stable demand from
residential customers
 Increasing capacity from
Russia (North Stream)
 Availability of lower-priced
make up gas
 No additional LNG capacity
from Qatar
 Continued domestic production
decrease
31
... gradually rebalancing in the medium term
Progressive tightening in European market to 2015
Further market improvement beyond
Americas Pacific Basin
Europe
 Demand escalation in
emerging markets (+89
bcm)
 New high-cost
liquefaction capacity from
Australia (+15 bcm) fully
absorbed in the region
 Premium prices attract
supply from Atlantic
basin
 Demand recovery (+60bcm 2015
vs. 2011)
 Domestic production decline (-17
bcm)
 Marginal shale gas contribution
 Increased interconnectivity opens
new market opportunities (11
new projects)
 North American
production continues to
expand
 Effect of North
American exports
limited and subject to
regulatory uncertainty
 Increasing Latin
American demand for
spot LNG
Mena
 Increasing domestic
consumption in North Africa
 Qatari production at 2011 levels
32
Objective
• Alignment
between eni
cost position
and average
costs of supply
in the market
Implementation
• Negotiation of
market-like
prices in long-
term contract
price revisions
• Improved and
faster
responsiveness
to market
changes
• Reduction of
minimum
volumes,
possibility to
reopen
negotiations if
required
• Foundation for
competitive
positioning in
the market
Price Flexibility
Market
reflectivity
eni strategy: building on a more competitive supply portfolio …
33
… to grow sales to business customers…
Consolidation of leading
position in Europe
+18%
72
85
B2B volume increase
(bcm/y)• Dedicated and capillary direct sales
force to grow position in Italy and key
European countries
• Tailor made offers for different
segments
• Energy intensive customers
 Multi-country approach
 Flexible contractual structures
 Risk management services
 Market reflective pricing
• Small and medium enterprises
 Specific offers to reflect market
segmentation
 High quality post-sale service
34
... and increase exposure to the retail segment
Increasing penetration
into more resilient
customer segments
Retail customers
(mln)
• Larger retail presence in Italy and
Europe
 Organic growth
 Selected M&A opportunities
• Well-proven commercial mix
 Single brand identity
 Distinctive product portfolio
 Customer driven innovation
 Competitive cost to serve
• Well-balanced sales channels
 Agents
 Teleselling
 iweb
 eni energy stores
• Best In Class program ongoing
 Marketing & IT innovation
 Communication & brand awareness
 Customer care operations
+28%
9.4
12
35
gradual recovery in profitability
Marketing
 Supply cost improvement
 Benefit from retroactive
renegotiations in 2012
 Impact of retail tariff revision
in Italy
 Development of integrated
trading activities
International transport
 Resilient profitability despite
disposal of European pipelines
Pro-forma adj. EBITDA
Snam
Marketing & International transport
2.6
Bln €
eni.com
Financial Outlook
Alessandro Bernini, CFO
37
Snam deconsolidation: a resulting strong capital structure
bln €
Net debt
eni D/E 0.46x
Snam deconsolidation 0.30x
Including cash-in <0.20x
bln €
eni
65.3
Snam
15.4
Capital employed
eni ROACE 9.8%
Snam deconsolidation 10.4%
Including cash-in 11.4%
Mkt value of
eni’s stake
6.9
* data at year-end 2011
eni
9.9
Snam
11.2
Mkt value
of eni’s
stake
6.9
38
2012-2015 capex: supporting stronger growth
59.6
44.7
7.2
2.8
2.5
2.3
0.5
6.7
-1.1
53.3
39.1
7.5
2.9
2.4
1.4
E&PG&PR&MSaipemOthers
2011-14
capex plan
Forex
effect
E&P Others 2012-15
capex plan
Mozambique
OPL245
Jangkrik
Skrugard/Havis
Snam
Europe/
North
America
LatamFar
East
North
Africa/ME
Sub
Sahara
Russia/
Caspian
Uncom-
mited
Committed
bln €
Snam
Snam
39
selective capex plan
G&P R&M Chemicals
 Focus on projects for integration, efficiency and energy saving
 Targeted investment to boost organic growth in existing/new
profitable businesses
International
transport
0.1
Snam
6.2
Refining
1.9
Marketing
0.9
Marketing
0.9
Total €7.2 bln Total €2.8 bln Total €1.6 bln
Green
chemical
0.2
New
initiatives
0.8
Stay in
business
0.4
Efficiency
0.2
40
efficiency programme
 Almost €600m of savings achieved in 2011
 4-year target increased by €600m, mainly in
R&M and Chemicals
E&P 11%
G&P 6%
R&M 11%
Chemicals
20%
E&C
3%
Corporate
& others
49%
2004-05
achievements
2006-11
achievements
2012-15
target
bln €
2004-05 2006-11 2004-15
0.3
3.1
1.6
5.0
41
increasing cash flow to support investments and reduce debt
* @ 90$/bl in 2012-13; 85$/bl in 2014-15
 Organic cash-flow more
than covers capex
requirements
 Net debt to equity <40%
within the plan period at
constant perimeter
 Additional cash-inflows
expected from disposals
 Impact of Snam
deconsolidation on free
cash-flow broadly neutral
2012-15 cash flow*
bln €
42
a sustainable dividend policy
 2011: dividend +4% in line with our policy
 Dividend policy of growth in line with inflation
sustainable throughout the four-year plan
Confirmed
dividend
policy
eni.com
Closing remarks
Paolo Scaroni, CEO
44
entering a new growth phase
E&P
A decade of faster, sustainable growth
• Raised production targets to 2015 and beyond
• Increased exploration effort in highly promising basins
G&P
Consolidation of leading position in Europe
• Improved competitiveness of supply
• Medium-term recovery leveraging on secular gas demand growth
R&M
Chem
Restructuring potential
• Continuous focus on efficiencies
• Profit enhancement through integration, innovation and portfolio refocusing
Potential value creation from disposals

2012 - 2015 Strategy

  • 1.
  • 2.
    2 eni: well-positioned todeliver a decade of sustainable growth 2012-2015 20212011 E&P  Confirmed growth profile  Start-up of giants with long plateau  Increased investment in exploration  Libya restart  Strengthened resource base  A decade of sustainable growth G&P  Recover profitability in a difficult market  Consolidate competitiveness of supply  Focus on key segments and markets  Strong position to benefit from market recovery R&M Chemicals  Continued efficiency  Integration of refinery system, consolidation of marketing  Refocusing chemicals portfolio on added-value products  Selective presence in R&M  Competitive player in Chemicals  Streamlined operations  Improved supply  Growth in key markets
  • 3.
    3 E&P: consistent explorationsuccess ...  Mamba South (Mozambique)  Skrugard (Norway)  Hadrian Nord (US-GOM)  Jangkrik NE (Indonesia)  Lira 1 (Angola)  Gye Nyame 1 (Ghana)  Sangos-Ngoma (Angola)  Kitan (JPDA)  Culzean (UK)  Sankofa (Ghana)  Perla (Venezuela)  Cabaca Norte (Angola)  Area D (Libya)  Heidelberg (US)  Perla (Venezuela)  Jangkrik (Indonesia)  Sankofa (Ghana)  Cabaca Sud Est  Mpungi (Angola) 2008-2011 ~4bn boe of new exploration resources New exploration resources (mboe) Total resources (bboe)
  • 4.
    4 ... drives organicgrowth, in the plan period... Adjusting for force majeure in Libya in 2012 (180k boe/d) CAGR Brent 2011-13: 90 USD/bl; 2014-15: 85 USD/bl >3% CAGR 2011-15 in a higher oil price scenario  Strong contribution from exploration successes  Confirmed focus on giant, conventional projects  Increased exposure to oil  Best-in-class operating costs  IRR of new projects over 20% 2011 2015 kboe/d Production growth >3% adj Russia and Caspian Sub-Saharan Africa North Africa and ME Far East Latin America Europe and North America
  • 5.
    5 Production growth kboe/d Russia andCaspian Sub-Saharan Africa North Africa and ME Far East Latin America Europe and North America ~3% 2015 2021 2015-21 CAGR increased from 2% to 3% Price scenario: 85$/bbl 2015; +2%/year afterwards Resilient contribution driven by Barents Sea Junin 5 & Perla FF developments Major contribution from Angola Block 15/06 and Mozambique, additional exploration potential Yamal giants, Kashagan ramp up, further potential from Kashagan development ... and beyond
  • 6.
    6 G&P: positioned totackle difficult short term scenario... * Adjusted for outcome of renegotiations and Libya impact Marketing: facing difficult scenario  Slower than expected demand growth  Spot/LT differential remains significant in 2012 eni 2012-2015 strategy  Leverage on more competitive supply portfolio to grow market share in Italy and key European markets  Further increase exposure to more resilient retail segment  Capture benefits of market volatility through enhanced trading capabilities Gradual recovery in profitability  TMPC, TTPC, Greenstream, BSPC, other regulated business  Stable profitability and cash flow throughout the plan Snam TAG/TENP/Transitgas Other G&P Marketing Regulated/ Low-risk business Asset disposed/ to be disposed  TMPC, TTPC, Greenstream, BSPC, other regulated business  Stable profitability and cash flow throughout the plan 2011 EBITDA pro-forma adjusted* (€ mln)
  • 7.
    7 … and capturemedium-term recovery opportunities European demand recovery:  Strong European market position  Consolidated brand  Expertise in innovative offering structure  Diversified and flexible supply portfolio  Competitive cost position in tightened market  Increased equity gas supply  New profit opportunities  Enhanced LNG presence  Cross-regional and cross-commodities synergies in trading EU 27 (bcm) -8% ~18%  Economic growth  Energy/environmental policies Tightening supply capacity:  Increasing Far East demand  Increasing MENA domestic gas consumption  Declining European domestic production  Limited LNG capacity for the Atlantic basin Long-term scenario Well positioned to capture additional growth
  • 8.
    8 R&M: increasing efficiencyand complexity  Refining: a cyclical business in a difficult short term scenario  Increased focus on complexity and efficiency to benefit from potential scenario recovery  EST completion by 2012  Increased system integration  Exploit flexibility and asset-backed trading Optimisation & efficiency + €400m  Marketing: confirming profitability  Consolidation of Italian leadership  Network enhancement and automation  Expansion of non-oil activities Italian retail market share >30%
  • 9.
    9 Chemicals: a newturnaround strategy More efficient and integrated  Savings >€200m by 2015 Enhanced differentation  Increase revenues from added value products from <30% to >40% International expansion  > 10% of revenues from outside Europe by 2015  Licensing, production alliances/JVs Regaining competitiveness within chemicals business 2015 target > €400m of EBIT at constant scenario
  • 10.
    10 GalpSnam Separation by September2013 Process evaluated on 3 criteria:  Benefits to eni shareholders  Protection of the interests of Snam shareholders  Consolidation of eni balance sheet Non-core shareholding High potential business, with exciting positions in Brazil, Mozambique Upside from market value recovery enhanced value creation opportunities from non-core listed assets
  • 11.
  • 12.
    12  Strong focuson exploration strategy and execution  Fast time-to-market of exploration discoveries  Rapid and efficient development of project pipeline  Effective reservoir management and production optimization activities  Leading-edge technology to fight depletion of giant fields  Consolidate and deploy competencies and technology  Increase direct control of assets through operatorship  Maintain geographical diversification  Phase financial exposure in large-scale, complex projects Organic growth & value creation Managing uncertainties E&P strategic goals and drivers
  • 13.
    13 Drilled wells HSE results Losttime injury frequency rate* * n. of LTI/Mln of worked hours Company Contractor Global Avg 2007-2010 2011 0.66 0.77 0.73 0.41 0.42 0.41 2005 2008 2011 0.00 0.000.00 250 327 437 Drilled wells per year Blow-out frequency (per thousand)
  • 14.
    14  Materiality and cost-effectiveness Short time to market  Focus on emerging basins West Africa  Transform margin play in Ghana, Togo, Liberia  Pre-salt play in Angola, Congo, RDC Near field exploration East Africa Gas (Mozambique)  Exploit full potential of tertiary plays in the Rovuma basin Barents Sea (Norway)  Large upside GoM (USA) Pacific gas (Indonesia and Australia)  High potential in profitable gas market Maintaining leadership on discovered volumes and unit exploration costs Drivers Fontier high potential Proven basins/near field exploration objectives
  • 15.
    15 focus on exploration:Norway - Barents sea 2012-2015 work program  Resources upside in the area: 500 mboe  8 wells in the Barents Sea: €220m equity investments Synergies  Havis/Skrugard hub servicing 50 km radius  Onshore services Additional prospectivity  12 blocks for an acreage of 4,600 sqkm  With Statoil, maintain leadership position in the next round Discoveries  500 Mbbl of recoverable oil in Skrugard and Havis PL226 PL533 PL529 PL201 PL489 PL229 Goliat PL608 PL532 Skrugard/Havis PL657 Havis/Skrugard hub operated not operated
  • 16.
    16 Area 4 Mamba North 1 Tertiary proven gasplay Mamba North East 1 Mamba South 1 focus on exploration: Mozambique – Rovuma basin 2012-2015 work program  Up to 8 exploration and appraisal wells  2,000 sqkm of 3D and 2,100 sqkm 2D seismic  €400m expected equity investments Synergies  Unitization of Mamba complex with Area 1  Evaluation of additional stand- alone resources in Area 4 Mamba discovery  Gas in place estimate at 30 Tcf  High gas quality  Expected rate in production configuration up to 140 mmsfcd per well
  • 17.
    17 2012-2015 work program Resources upside: ~500 Mboe  24 wells: €300m equity investments Synergies  Indonesia: Jangkrik hub  Australia: upstream development and synergies with LNG facilities Additional prospectivity  16,000 sqkm of new acreage added in 2011 Discoveries  ~700 Mboe already discovered in Australia and Indonesia eni assets New acreage BUKAT/ BULUNGAN North Ganal JANGKRIK JANGKRIK NE Arguni 1 NT/P68- Heron NT/48- Evans Shoal focus on exploration: Pacific Area
  • 18.
  • 19.
    19 * P1 +P2 + P3 + contingent resources + risked exploration bln boe Brent ($/boe) 111 Life index (years) 50 2P reserves Other reserves/ resources 90% with first oil in production in <8 years Mozambique 32.131.0 79 47 Total resources* 2009-2011 discoveries time to market: from resources to production…
  • 20.
    20 Main start-ups 4-year planstart-ups: ~700 kboed @ 2015 Samburskoye Yaro/Yakhinskoye Urengoskoye ALNG Kizomba Sat. Ph.1 West Hub Perla EP Junin 5 EP Jangkrik Jau Kutai Basin CBM FF Skrugard/Havis East Hub Great Hadrian area 2012-2015 Hubs Jasmine W.Franklin Ph.2 Culzean OPL 245 FF Brass LNG Kashagan EP Goliat … through identified and solid start-ups Yevo Severo Beyond 2015 Perla FF Junin 5 FF MLE CAFC El Merk Wafa compression Mamba Sankofa Gye Nyame Hadrian South Kashagan Ph.2 Karachaganak Ph.3
  • 21.
    21 Yamal Nenets region:new gas giants  Samburgskoye and Urengoskoye sanctioned in 2011  GSA signed with Gazprom  Samburgskoye start up confirmed 2012 Samburgskoye UrengoskoyeSevero- Chaselskoye Yaro-Yakhinskoye Samburgskoye Production (kboed, equity)
  • 22.
    22 Barents Sea: Goliatfirst oil development Barents Sea  First oil development in the Barents Sea  Subsea templates installation campaign completed in 2011 and ready for drilling  FPSO delivery in 2013 Production (kboed, equity)Goliat
  • 23.
    23 Kashagan Karachaganak  Kashagan EP Construction completion and commissioning ongoing  Tranches 1&2 progress for KCP: 99%, in line with commercial production start up within 2012  Karachaganak  Previous development phases currently producing >100 kboed equity  Agreed settlement with Republic of Kazakhstan Kazakhstan Production (kboed, equity) Kazakhstan: near-term growth and significant long-term potential
  • 24.
    24 Venezuela: super giantswith long-term plateau Junín-5 Perla  Perla  Gas Sales Agreement and FID for Phase 1 achieved in 2011  Phase 1: construction and installation of three offshore platforms, 60-km pipeline to shore, onshore processing facility  Junìn EP  Finalizing all the major engineering contracts  Seeking anticipated early production in 2012, using synergies with PDVSA existing facilities Venezuela Production (kboed, equity)
  • 25.
    25 Sub-Saharan: legacy areawith further growth prospects  Development of Sangos, Ngoma, Cinguvu fields (1,250-1,450m water depth)  16 wells (10 producers, 6 injectors)  First drilling campaign: ongoing  FPSO will be delivered in 1Q 2014 * exploration potential excluded Block 15/06 West Hub Production* (kboed, equity)
  • 26.
    26 investment plan Onshore Offshore Deepwater By type N.Africa/M. East America Europe Asia Pacific Central Asia/Russia West Africa By area bln € Development Exploration Other Capex 2012-2015 Mozambique 44.8 39.1 +14% 1.8 3.6 5.5 1.7 3.1 33.7 37.6
  • 27.
    27 Brent ($/boe) 2012/2013 2014/2015 2015 9085 +2% >3% ~3% CAGR Organic production growth  Strong production growth of over 3% a year to 2015 adjusted for Libya in 2011  Resilient to oil price increases: 2011-2015 CAGR at 100$/bbl ~3%  Long-term growth target raised from ~2% to ~3% our commitment: production New productionLibya force majeure
  • 28.
    28 our commitment: value Solidcash generation 90 100 110 120 2010 2015 NPV 2P by areas Sub-Saharan Africa Europe & America Asia & Pacific North Africa CF/boe (%) Brent avg ($/boe) Cash flow 85 85
  • 29.
  • 30.
    30 European gas market:a difficult short term environment… Persisting oversupply in Europe in the near term Spot-LT price differential remains significant Continuing competitive pressure Supply Demand  Weak economic situation in Europe impacting industrial clients  Increased competition in powergen from renewable sources  Relatively stable demand from residential customers  Increasing capacity from Russia (North Stream)  Availability of lower-priced make up gas  No additional LNG capacity from Qatar  Continued domestic production decrease
  • 31.
    31 ... gradually rebalancingin the medium term Progressive tightening in European market to 2015 Further market improvement beyond Americas Pacific Basin Europe  Demand escalation in emerging markets (+89 bcm)  New high-cost liquefaction capacity from Australia (+15 bcm) fully absorbed in the region  Premium prices attract supply from Atlantic basin  Demand recovery (+60bcm 2015 vs. 2011)  Domestic production decline (-17 bcm)  Marginal shale gas contribution  Increased interconnectivity opens new market opportunities (11 new projects)  North American production continues to expand  Effect of North American exports limited and subject to regulatory uncertainty  Increasing Latin American demand for spot LNG Mena  Increasing domestic consumption in North Africa  Qatari production at 2011 levels
  • 32.
    32 Objective • Alignment between eni costposition and average costs of supply in the market Implementation • Negotiation of market-like prices in long- term contract price revisions • Improved and faster responsiveness to market changes • Reduction of minimum volumes, possibility to reopen negotiations if required • Foundation for competitive positioning in the market Price Flexibility Market reflectivity eni strategy: building on a more competitive supply portfolio …
  • 33.
    33 … to growsales to business customers… Consolidation of leading position in Europe +18% 72 85 B2B volume increase (bcm/y)• Dedicated and capillary direct sales force to grow position in Italy and key European countries • Tailor made offers for different segments • Energy intensive customers  Multi-country approach  Flexible contractual structures  Risk management services  Market reflective pricing • Small and medium enterprises  Specific offers to reflect market segmentation  High quality post-sale service
  • 34.
    34 ... and increaseexposure to the retail segment Increasing penetration into more resilient customer segments Retail customers (mln) • Larger retail presence in Italy and Europe  Organic growth  Selected M&A opportunities • Well-proven commercial mix  Single brand identity  Distinctive product portfolio  Customer driven innovation  Competitive cost to serve • Well-balanced sales channels  Agents  Teleselling  iweb  eni energy stores • Best In Class program ongoing  Marketing & IT innovation  Communication & brand awareness  Customer care operations +28% 9.4 12
  • 35.
    35 gradual recovery inprofitability Marketing  Supply cost improvement  Benefit from retroactive renegotiations in 2012  Impact of retail tariff revision in Italy  Development of integrated trading activities International transport  Resilient profitability despite disposal of European pipelines Pro-forma adj. EBITDA Snam Marketing & International transport 2.6 Bln €
  • 36.
  • 37.
    37 Snam deconsolidation: aresulting strong capital structure bln € Net debt eni D/E 0.46x Snam deconsolidation 0.30x Including cash-in <0.20x bln € eni 65.3 Snam 15.4 Capital employed eni ROACE 9.8% Snam deconsolidation 10.4% Including cash-in 11.4% Mkt value of eni’s stake 6.9 * data at year-end 2011 eni 9.9 Snam 11.2 Mkt value of eni’s stake 6.9
  • 38.
    38 2012-2015 capex: supportingstronger growth 59.6 44.7 7.2 2.8 2.5 2.3 0.5 6.7 -1.1 53.3 39.1 7.5 2.9 2.4 1.4 E&PG&PR&MSaipemOthers 2011-14 capex plan Forex effect E&P Others 2012-15 capex plan Mozambique OPL245 Jangkrik Skrugard/Havis Snam Europe/ North America LatamFar East North Africa/ME Sub Sahara Russia/ Caspian Uncom- mited Committed bln € Snam Snam
  • 39.
    39 selective capex plan G&PR&M Chemicals  Focus on projects for integration, efficiency and energy saving  Targeted investment to boost organic growth in existing/new profitable businesses International transport 0.1 Snam 6.2 Refining 1.9 Marketing 0.9 Marketing 0.9 Total €7.2 bln Total €2.8 bln Total €1.6 bln Green chemical 0.2 New initiatives 0.8 Stay in business 0.4 Efficiency 0.2
  • 40.
    40 efficiency programme  Almost€600m of savings achieved in 2011  4-year target increased by €600m, mainly in R&M and Chemicals E&P 11% G&P 6% R&M 11% Chemicals 20% E&C 3% Corporate & others 49% 2004-05 achievements 2006-11 achievements 2012-15 target bln € 2004-05 2006-11 2004-15 0.3 3.1 1.6 5.0
  • 41.
    41 increasing cash flowto support investments and reduce debt * @ 90$/bl in 2012-13; 85$/bl in 2014-15  Organic cash-flow more than covers capex requirements  Net debt to equity <40% within the plan period at constant perimeter  Additional cash-inflows expected from disposals  Impact of Snam deconsolidation on free cash-flow broadly neutral 2012-15 cash flow* bln €
  • 42.
    42 a sustainable dividendpolicy  2011: dividend +4% in line with our policy  Dividend policy of growth in line with inflation sustainable throughout the four-year plan Confirmed dividend policy
  • 43.
  • 44.
    44 entering a newgrowth phase E&P A decade of faster, sustainable growth • Raised production targets to 2015 and beyond • Increased exploration effort in highly promising basins G&P Consolidation of leading position in Europe • Improved competitiveness of supply • Medium-term recovery leveraging on secular gas demand growth R&M Chem Restructuring potential • Continuous focus on efficiencies • Profit enhancement through integration, innovation and portfolio refocusing Potential value creation from disposals