Company Presentation
Company Overview
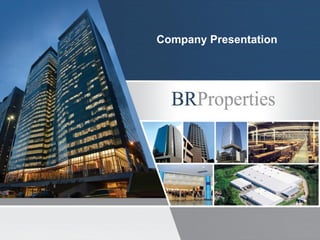
The largest commercial property company in the country, with a portfolio of approximately
R$13.6 billion in market value and over 2 million sqm of GLA
Company Profile
2
 Diversified portfolio, comprised of 122 properties,
with 2.2 million sqm of gross leasable area (GLA)
and estimated market value of R$13.6 billion
 Diversified tenant base, composed of high credit-
quality national and multinational companies
 Present in 14 Brazilian states
 16 greenfield projects, with approximately 451
thousand sqm of GLA
 Fully integrated and experienced in-house teams:
acquisitions, financing, legal, property management
and engineering
 Value creation management strategy through re-
tenanting, market realignments, retrofit, and
improvements to technical installations
 Market recognition: proven ability to source deals
and execute complex transactions
 Wholly owned property management subsidiary –
BRPR A
Segments of Activity
OfficeIndustrialRetail
C&A Portfolio
TNU
DP Louveira
Ventura Complex CES - Petrobrás
VW Vinhedo
Tok & Stok Portfolio
Properties Average Shopping Malls Average
69%
14%
30%
Properties Average Shopping Malls Average
96%
28%
23%
Properties Average Shopping Malls Average
57%
27% 27%
Properties Average Shopping Malls Average
32%
-4%
14%
Highest Growth in Sector…
Impressive growth rate, much higher than the average of its comparables…
GLA CAGR 2008 - 2011 Net Revenues CAGR 2008 - 2011
FFO CAGR 2008 - 2011 EBITDA CAGR 2008 – 2011
3
Source: Companies
Notes:
1 Malls Average: Considering BR Malls, Multiplan, and Iguatemi
2 Properties Average: Considering São Carlos and CCP
CCP São Carlos
8.722
2.199
2.595
Largest and Most Efficient Company…
BR Properties has the highest EBITDA margin among all players in the properties and malls
sectors
4
Source: Companies
Notes:
1 Considering BR Malls, Multiplan, and Iguatemi – 2Q12
2 Considering São Carlos and CCP – 2Q12
4.0x 3.4x
Source: Bloomberg (10/22/2012)
3Q12 EBITDA Margin
BRPR vs Competitors
(Market Cap – R$ mm)
Properties
Average
Shopping Malls
Average
93%
86%
76%
Ibovespa MSCIBrasil
41%
-2%
4%
Ibovespa MSCIBrasil
10%
-15%
-21%
BR Properties’ stock has outperformed the most relevant indices over the last years, given its
more defensive profile in an uncertain economic outlook
5
Value Creation Since IPO…
Source: Bloomberg
Stock Performance
2010
Stock Performance
2011
Stock Performance
9M12
Ibovespa MSCIBrasil
43%
4%
-6%
Oil & Gas Other Consumer
Goods
Financial
Services
Telecom Logistics Industrial Tech
23%
20% 19%
14%
10%
7% 6%
1%
6
Tenant base entails some of the most recognized companies in the country, spanning wide
industry diversification
Tenants Composition by Sector
High Credit-Quality Tenants…
Main
Tenants
0,9%
0,0% 0,0% 0,3%
1,1%
0,1%
0,3%
0,0%
0,5%
0,0% 0,0% 0,0%
1,1%
0,2%
0,0%
0,0%
1,0%
2,0%
3,0%
4,0%
5,0%
1Q09 2Q09 3Q09 4Q09 1Q10 2Q10 3Q10 4Q10 1Q11 2Q11 3Q11 4Q11 1Q12 2Q12 3Q12
7
Most Defensive and Resilient Business…
Delinquency Rate
Vacancy Rate
Despite having experienced several cycles throughout the last years, the Company’s delinquency
rate is insignificant
2Q11 3Q11 4Q11 1Q12 2Q12 3Q12
1,5%
0,9% 0,9%
1,9% 1,9%
3,2%
2,3%
1,5% 1,7%
1,3% 1,3%
4,5%
Physical
Financial
Portfolio: Strategic Positioning
8
Irreplicable portfolio, present in 14 states, and mainly concentrated in the best and
most liquid regions of the country
— Office: 41
— Warehouse: 35
— Developments: 16
— Retail: 30
 Number of Properties : 122
 Total Properties GLA: 2,181,854 sqm
— Office: 472,089 sqm
— Warehouse: 1,144,451 sqm
— Developments: 451,260 sqm
— Retail: 114,054 sqm
Portfolio Breakdown – Market Value Existing Properties/Development (%GLA)
Office
Warehouse
BRPR
Retail
Portfolio Breakdown – Footprint
67%
21%
12%
São Paulo Rio de Janeiro Others
% GLA
80%
20%
Existing Properties Developments
50%
21%
24%
5%
Office AAA Office Industrial Retail
 Average office lease term: 5-10 years
 Average warehouse lease term: 5-10 years
Expiration Schedule
(% revenues)
Market Alignment Schedule
(% revenues)
Inflation Adjustment Indices
Portfolio: Lease Contract Characteristics
Lease contracts in place allow for stable, predictable cash flows, while creating a very low
vacancy risk scenario and considerable upside potential in revenues
9
 Annual Inflation Adjustments
— 100% of lease contracts are indexed to inflation
 Triple Net Contracts
— Tenant is responsible for all operating property costs
— Costs include: taxes, insurance, and maintenance
expenses
 Next 3 Years
— 85% market alignment
— 26% expiration
 Bank Guarantees on Leases
— Standard practice in Brazil
— Protects against delinquencies from smaller tenants
 Tenant Delinquency
̶ Delinquency exceeding 30 days, lessor has right to
break the contract and remove the tenant
Main Characteristics
2012 2013 2014 >2015
2%
8%
16%
74%
2012 2013 2014 >2015
24%
23%
38%
15%
87%
9%
4%
IGP-M
IPCA
Other
Adding Value: Potential for Market Consolidation
10
The Company has a proven track record as the consolidator of the highly fragmented Brazilian
commercial properties market
Addressable Market1: 36.3 mm m2
BRProperties
10 Organized
Companies
58%
Organized
Companies
12%
Non-Organized
Market
88%
42%
Fragmented Industry¹ (in terms of GLA - m2)
1 Including existing properties only
Acquisition Pipeline (R$ million)
Office Industrial Retail Total
3.405
3.751
296
50
Initial 3Q12
Initial 3Q12
Initial 3Q12Initial 3Q12
Initial 3Q12
11
Adding Value: Performance Improvement
Outstanding management leads to very fast operating improvements and impressive increases in
the short and mid term
Ventura West (Acquired in Aug/2010) RB 115 (Acquired in Jun/2010)C&A Portfolio (Acquired in Dec/2010)
H. Schaumann (Acquired in 2007) Vargas (Acquired in 2007)TNU (Acquired in Mar/2010)
Cap Rate
+200 bps
10,3%
12,3%
Cap Rate
+230 bps
12,3%
14,6%
Cap Rate
+510 bps
10,5%
15,6%
+1215bps
11,1%
23,3%
+660 bps
13,9%
20,5%
Cap Rate
Initial 3 months later
+180 bps
10,6%
12,4%
Cap Rate Cap Rate
Adding Value: Impressive Real Gains on Rental Prices
12
Leasing Spreads – New Leases
Company has built a successful track record on increasing spreads in both contract renegotiation
and new leases
Leasing Spreads – Lease Renewals and Market Alignments
3Q10 4Q10 1Q11 2Q11 3Q11 4Q11 1Q12 2Q12 3Q12
7%
10%
15% 14%
12%
39%
34%
15%
27%
14%
11%
28%
34%
46%
Office Industrial Retail
3Q10 4Q10 1Q11 2Q11 3Q11 4Q11 1Q12 2Q12 3Q12
13,6%
8%
21%
24% 24%
34%
36%
16%
21%
14,4%
23%
13%
16%16% 17%
Office Industrial Retail
Adding Value: Selective Developments
13
16 development projects, which once finalized, will correspond to 451 thousand sqm of GLA
Ed.CidadeJardim
 Type: Office AAA
 Location: São Paulo / SP
 Delivery Date: 1Q13
 Owned GLA: 34,583 sqm
 Stake: 100%
Ed.CES
 Type: Office AAA
 Location: São Paulo / SP
 Delivery Date: 4Q12
 Owned GLA: 6,792 sqm
 Stake: 50%
Ongoing Projects
JKComplex–TowerD&E
 Type: Office AAA
 Location: São Paulo / SP
 Delivery Date: 1Q13
 Owned GLA: 14,868 sqm
 Stake: 75%
CES:Retail
 Type: Office AAA
 Location: Rio de Janeiro / RJ
 Delivery Date: 4Q12
 Owned GLA: 95,174 sqm
 Stake: 100%
WTNU–TowerIII
 Type: Office A
 Location: São Paulo / SP
 Delivery Date: 1Q13 – Phase 1
 Owned GLA: 14,502 sqm (3 towers)
 Stake: 50%
PanaméricaGreenPark
 Type: Retail
 Location: Rio de Janeiro / RJ
 Data de Entrega: 1Q13
 Owned GLA: 2,881 sqm
 Stake: 100%
14
 Type: Warehouse
 Location: São José dos Campos / SP
 Delivery Date: n/a
 Owned GLA: 125,000 sqm
 Stake: 100%
TechParkSJCGaiaTerra
 Type: Warehouse
 Location: Jarinú / SP
 Delivery Date: 2Q13 – Phase 1
 Owned GLA: 51,791 sqm (3 Warehouses)
 Stake: 67%
Ongoing Projects
Adding Value: Selective Developments
 Type: Warehouse
 Location: Louveira / SP
 Delivery Date: 2Q13
 Owned GLA: 30,122 sqm
 Stake: 100%
DPLouveira7
JKComplex–TowerB
 Type: Office A
 Location: São Paulo / SP
 Delivery Date: 2Q14
 Owned GLA: 2.019 sqm
 Stake: 50%
Ed.SouzaAranha
 Type: Office AAA
 Location: São Paulo / SP
 Data de Entrega: 1Q14
 Owned GLA: 29,539 sqm
 Stake: 100%
CESIIBayview
 Landbank / Office
 Rio de Janeiro/ RJ
 22,000 sqm
 Downtown
 Landbank / Office
 Rio de Janeiro/ RJ
 21,989 sqm
 Downtown
Recycling: Sales of Non Core Properties
15
BR Properties maintains a constant portfolio recycling by selling properties that have reached
their maturity and full potential for value creation
Exit Cap RatesSold Properties (R$ million)
Average
2009
Average
2010
Average
2011
Average
2012
11,4%
8,6%
9,2%
8,4%
2009 2010 2011 2012 Total
90
350
37
89
133
2009 2010 2011 9M11 9M12
42,4
72,0
106,0
77,5
97,2
2009 2010 2011 9M11 9M12
91,1
178,4
300,7
229,4
392,7
16
Net Revenues
(R$ mm)
Adjusted EBITDA and Margin
(R$ mm and %)
Adjusted FFO and Margin
(R$ mm and %)
205%
230%
70%
150%
Financial Highlights: P & L
71%
81%
87% 90% 91% 91%
2009 2010 2011 9M11 9M12
112,7
204,5
343,5
253,2
430,2
25%
37% 34% 31% 31%
23%
2009 2010 2011 1Q12 2Q12 3Q12
89
232
1.032
1.104
609
394
17
Cash and Cash Equivalents 3Q12 Debt Profile
Financial Highlights: Balance Sheet
Indebtedness
46%
33%
14%
1%
6%
TR
CDI
IGPM
INPC
IPCA
2010 2011 1Q12 2Q12 3Q12
1.830
2.083
4.594
5.045 4.893
1.598
1.051
3.489
4.436 4.499
Gross Indebtedness Net Indebtedness
18
Loan-to-Value
3Q12 Debt Amortization Schedule (R$ million)
Financial Highlights: Indebtedness
2012 2013 2014 2015 2016 2017 2018 2019 2020 2021 2022 2023 2024 2025
86
525
387 367
517
574
385 375
213
106 78 64 56 39
Principal
1Q10 2Q10 3Q10 4Q10 1Q11 2Q11 3Q11 4Q11 1Q12 2Q12 3Q12
38% 40%
24%
40%
45% 43% 42% 41% 40% 39%
37%
4% 23% 21%
36% 36%
35%
21% 21%
30%
35% 34%
LTV Gross Debt LTV Net Debt
Contact
Investor Relations
19
Pedro Daltro
CFO and Investor Relations Officer
Marcos Haertel
Investor Relations Manager
Gabriel Barcelos
Investor Relations Analyst
Phone: (55 11) 3201-1000
Email: ri@brpr.com.br
www.brpr.com.br

Company presentation october 2012

  • 1.
  • 2.
    Company Overview The largestcommercial property company in the country, with a portfolio of approximately R$13.6 billion in market value and over 2 million sqm of GLA Company Profile 2  Diversified portfolio, comprised of 122 properties, with 2.2 million sqm of gross leasable area (GLA) and estimated market value of R$13.6 billion  Diversified tenant base, composed of high credit- quality national and multinational companies  Present in 14 Brazilian states  16 greenfield projects, with approximately 451 thousand sqm of GLA  Fully integrated and experienced in-house teams: acquisitions, financing, legal, property management and engineering  Value creation management strategy through re- tenanting, market realignments, retrofit, and improvements to technical installations  Market recognition: proven ability to source deals and execute complex transactions  Wholly owned property management subsidiary – BRPR A Segments of Activity OfficeIndustrialRetail C&A Portfolio TNU DP Louveira Ventura Complex CES - Petrobrás VW Vinhedo Tok & Stok Portfolio
  • 3.
    Properties Average ShoppingMalls Average 69% 14% 30% Properties Average Shopping Malls Average 96% 28% 23% Properties Average Shopping Malls Average 57% 27% 27% Properties Average Shopping Malls Average 32% -4% 14% Highest Growth in Sector… Impressive growth rate, much higher than the average of its comparables… GLA CAGR 2008 - 2011 Net Revenues CAGR 2008 - 2011 FFO CAGR 2008 - 2011 EBITDA CAGR 2008 – 2011 3 Source: Companies Notes: 1 Malls Average: Considering BR Malls, Multiplan, and Iguatemi 2 Properties Average: Considering São Carlos and CCP
  • 4.
    CCP São Carlos 8.722 2.199 2.595 Largestand Most Efficient Company… BR Properties has the highest EBITDA margin among all players in the properties and malls sectors 4 Source: Companies Notes: 1 Considering BR Malls, Multiplan, and Iguatemi – 2Q12 2 Considering São Carlos and CCP – 2Q12 4.0x 3.4x Source: Bloomberg (10/22/2012) 3Q12 EBITDA Margin BRPR vs Competitors (Market Cap – R$ mm) Properties Average Shopping Malls Average 93% 86% 76%
  • 5.
    Ibovespa MSCIBrasil 41% -2% 4% Ibovespa MSCIBrasil 10% -15% -21% BRProperties’ stock has outperformed the most relevant indices over the last years, given its more defensive profile in an uncertain economic outlook 5 Value Creation Since IPO… Source: Bloomberg Stock Performance 2010 Stock Performance 2011 Stock Performance 9M12 Ibovespa MSCIBrasil 43% 4% -6%
  • 6.
    Oil & GasOther Consumer Goods Financial Services Telecom Logistics Industrial Tech 23% 20% 19% 14% 10% 7% 6% 1% 6 Tenant base entails some of the most recognized companies in the country, spanning wide industry diversification Tenants Composition by Sector High Credit-Quality Tenants… Main Tenants
  • 7.
    0,9% 0,0% 0,0% 0,3% 1,1% 0,1% 0,3% 0,0% 0,5% 0,0%0,0% 0,0% 1,1% 0,2% 0,0% 0,0% 1,0% 2,0% 3,0% 4,0% 5,0% 1Q09 2Q09 3Q09 4Q09 1Q10 2Q10 3Q10 4Q10 1Q11 2Q11 3Q11 4Q11 1Q12 2Q12 3Q12 7 Most Defensive and Resilient Business… Delinquency Rate Vacancy Rate Despite having experienced several cycles throughout the last years, the Company’s delinquency rate is insignificant 2Q11 3Q11 4Q11 1Q12 2Q12 3Q12 1,5% 0,9% 0,9% 1,9% 1,9% 3,2% 2,3% 1,5% 1,7% 1,3% 1,3% 4,5% Physical Financial
  • 8.
    Portfolio: Strategic Positioning 8 Irreplicableportfolio, present in 14 states, and mainly concentrated in the best and most liquid regions of the country — Office: 41 — Warehouse: 35 — Developments: 16 — Retail: 30  Number of Properties : 122  Total Properties GLA: 2,181,854 sqm — Office: 472,089 sqm — Warehouse: 1,144,451 sqm — Developments: 451,260 sqm — Retail: 114,054 sqm Portfolio Breakdown – Market Value Existing Properties/Development (%GLA) Office Warehouse BRPR Retail Portfolio Breakdown – Footprint 67% 21% 12% São Paulo Rio de Janeiro Others % GLA 80% 20% Existing Properties Developments 50% 21% 24% 5% Office AAA Office Industrial Retail
  • 9.
     Average officelease term: 5-10 years  Average warehouse lease term: 5-10 years Expiration Schedule (% revenues) Market Alignment Schedule (% revenues) Inflation Adjustment Indices Portfolio: Lease Contract Characteristics Lease contracts in place allow for stable, predictable cash flows, while creating a very low vacancy risk scenario and considerable upside potential in revenues 9  Annual Inflation Adjustments — 100% of lease contracts are indexed to inflation  Triple Net Contracts — Tenant is responsible for all operating property costs — Costs include: taxes, insurance, and maintenance expenses  Next 3 Years — 85% market alignment — 26% expiration  Bank Guarantees on Leases — Standard practice in Brazil — Protects against delinquencies from smaller tenants  Tenant Delinquency ̶ Delinquency exceeding 30 days, lessor has right to break the contract and remove the tenant Main Characteristics 2012 2013 2014 >2015 2% 8% 16% 74% 2012 2013 2014 >2015 24% 23% 38% 15% 87% 9% 4% IGP-M IPCA Other
  • 10.
    Adding Value: Potentialfor Market Consolidation 10 The Company has a proven track record as the consolidator of the highly fragmented Brazilian commercial properties market Addressable Market1: 36.3 mm m2 BRProperties 10 Organized Companies 58% Organized Companies 12% Non-Organized Market 88% 42% Fragmented Industry¹ (in terms of GLA - m2) 1 Including existing properties only Acquisition Pipeline (R$ million) Office Industrial Retail Total 3.405 3.751 296 50
  • 11.
    Initial 3Q12 Initial 3Q12 Initial3Q12Initial 3Q12 Initial 3Q12 11 Adding Value: Performance Improvement Outstanding management leads to very fast operating improvements and impressive increases in the short and mid term Ventura West (Acquired in Aug/2010) RB 115 (Acquired in Jun/2010)C&A Portfolio (Acquired in Dec/2010) H. Schaumann (Acquired in 2007) Vargas (Acquired in 2007)TNU (Acquired in Mar/2010) Cap Rate +200 bps 10,3% 12,3% Cap Rate +230 bps 12,3% 14,6% Cap Rate +510 bps 10,5% 15,6% +1215bps 11,1% 23,3% +660 bps 13,9% 20,5% Cap Rate Initial 3 months later +180 bps 10,6% 12,4% Cap Rate Cap Rate
  • 12.
    Adding Value: ImpressiveReal Gains on Rental Prices 12 Leasing Spreads – New Leases Company has built a successful track record on increasing spreads in both contract renegotiation and new leases Leasing Spreads – Lease Renewals and Market Alignments 3Q10 4Q10 1Q11 2Q11 3Q11 4Q11 1Q12 2Q12 3Q12 7% 10% 15% 14% 12% 39% 34% 15% 27% 14% 11% 28% 34% 46% Office Industrial Retail 3Q10 4Q10 1Q11 2Q11 3Q11 4Q11 1Q12 2Q12 3Q12 13,6% 8% 21% 24% 24% 34% 36% 16% 21% 14,4% 23% 13% 16%16% 17% Office Industrial Retail
  • 13.
    Adding Value: SelectiveDevelopments 13 16 development projects, which once finalized, will correspond to 451 thousand sqm of GLA Ed.CidadeJardim  Type: Office AAA  Location: São Paulo / SP  Delivery Date: 1Q13  Owned GLA: 34,583 sqm  Stake: 100% Ed.CES  Type: Office AAA  Location: São Paulo / SP  Delivery Date: 4Q12  Owned GLA: 6,792 sqm  Stake: 50% Ongoing Projects JKComplex–TowerD&E  Type: Office AAA  Location: São Paulo / SP  Delivery Date: 1Q13  Owned GLA: 14,868 sqm  Stake: 75% CES:Retail  Type: Office AAA  Location: Rio de Janeiro / RJ  Delivery Date: 4Q12  Owned GLA: 95,174 sqm  Stake: 100% WTNU–TowerIII  Type: Office A  Location: São Paulo / SP  Delivery Date: 1Q13 – Phase 1  Owned GLA: 14,502 sqm (3 towers)  Stake: 50% PanaméricaGreenPark  Type: Retail  Location: Rio de Janeiro / RJ  Data de Entrega: 1Q13  Owned GLA: 2,881 sqm  Stake: 100%
  • 14.
    14  Type: Warehouse Location: São José dos Campos / SP  Delivery Date: n/a  Owned GLA: 125,000 sqm  Stake: 100% TechParkSJCGaiaTerra  Type: Warehouse  Location: Jarinú / SP  Delivery Date: 2Q13 – Phase 1  Owned GLA: 51,791 sqm (3 Warehouses)  Stake: 67% Ongoing Projects Adding Value: Selective Developments  Type: Warehouse  Location: Louveira / SP  Delivery Date: 2Q13  Owned GLA: 30,122 sqm  Stake: 100% DPLouveira7 JKComplex–TowerB  Type: Office A  Location: São Paulo / SP  Delivery Date: 2Q14  Owned GLA: 2.019 sqm  Stake: 50% Ed.SouzaAranha  Type: Office AAA  Location: São Paulo / SP  Data de Entrega: 1Q14  Owned GLA: 29,539 sqm  Stake: 100% CESIIBayview  Landbank / Office  Rio de Janeiro/ RJ  22,000 sqm  Downtown  Landbank / Office  Rio de Janeiro/ RJ  21,989 sqm  Downtown
  • 15.
    Recycling: Sales ofNon Core Properties 15 BR Properties maintains a constant portfolio recycling by selling properties that have reached their maturity and full potential for value creation Exit Cap RatesSold Properties (R$ million) Average 2009 Average 2010 Average 2011 Average 2012 11,4% 8,6% 9,2% 8,4% 2009 2010 2011 2012 Total 90 350 37 89 133
  • 16.
    2009 2010 20119M11 9M12 42,4 72,0 106,0 77,5 97,2 2009 2010 2011 9M11 9M12 91,1 178,4 300,7 229,4 392,7 16 Net Revenues (R$ mm) Adjusted EBITDA and Margin (R$ mm and %) Adjusted FFO and Margin (R$ mm and %) 205% 230% 70% 150% Financial Highlights: P & L 71% 81% 87% 90% 91% 91% 2009 2010 2011 9M11 9M12 112,7 204,5 343,5 253,2 430,2 25% 37% 34% 31% 31% 23%
  • 17.
    2009 2010 20111Q12 2Q12 3Q12 89 232 1.032 1.104 609 394 17 Cash and Cash Equivalents 3Q12 Debt Profile Financial Highlights: Balance Sheet Indebtedness 46% 33% 14% 1% 6% TR CDI IGPM INPC IPCA 2010 2011 1Q12 2Q12 3Q12 1.830 2.083 4.594 5.045 4.893 1.598 1.051 3.489 4.436 4.499 Gross Indebtedness Net Indebtedness
  • 18.
    18 Loan-to-Value 3Q12 Debt AmortizationSchedule (R$ million) Financial Highlights: Indebtedness 2012 2013 2014 2015 2016 2017 2018 2019 2020 2021 2022 2023 2024 2025 86 525 387 367 517 574 385 375 213 106 78 64 56 39 Principal 1Q10 2Q10 3Q10 4Q10 1Q11 2Q11 3Q11 4Q11 1Q12 2Q12 3Q12 38% 40% 24% 40% 45% 43% 42% 41% 40% 39% 37% 4% 23% 21% 36% 36% 35% 21% 21% 30% 35% 34% LTV Gross Debt LTV Net Debt
  • 19.
    Contact Investor Relations 19 Pedro Daltro CFOand Investor Relations Officer Marcos Haertel Investor Relations Manager Gabriel Barcelos Investor Relations Analyst Phone: (55 11) 3201-1000 Email: ri@brpr.com.br www.brpr.com.br