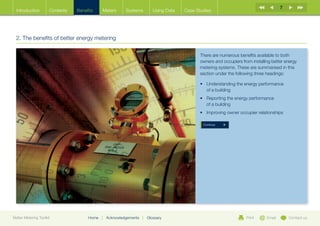
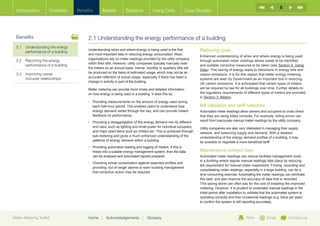
Better Metering Toolkit
A guide to improved energy management
through better energy metering

Enter


   Print     Email     Contact us
2
  Introduction        Contents   Benefits      Meters          Systems             Using Data         Case Studies


                                      Acknowledgements

                                      The Better Buildings Partnership (BBP) brings together a number of the largest commercial and public
                                      property owners in London in one collaborative organisation. All members are working together to improve
                                      the sustainability of London’s existing commercial building stock and accelerate the reduction in CO2 emissions
                                      from these buildings.
                                      Authors:
                                      David Ross                           Christopher Botten                   Keith Bugden                           Quinten Babcock
                                      AECOM                                BBP                                  BBP                                    Transport for London

                                      Working Group:
                                      Matt Webster                         Niall Tipping                        Simon Mendham                          Martin Russell Croucher
                                      British Land                         Grosvenor                            Land Securities                        RICS
                                      David Hodge                          Tatiana Bosteels                     Pippa Burchett
                                      Canary Wharf Group                   Hermes Real Estate                   Legal & General Property
                                      Hywel Davies                         Nick Hogg                            Siobhan Hewitt-Devine
                                      CIBSE                                Jones Lang LaSalle                   PRUPIM
                                      David Short                          Matthew Tippett                      Louise Ellison
                                      GE Captial Real Estate               Jones Lang LaSalle                   Quintain Estates & Development

                                      The BBP also wishes to thank the following for their valuable contribution:
                                      Steve Irving                         Jennifer Eastman                     Percival Albuquerque
                                      AECOM                                Esight Energy                        PA Energy

                                      Brett Goodyear                       William Negus                        Andy Stanton
                                      EP&T                                 Johnson Controls                     Transport for London


                                      The views expressed in this document are not necessarily those of either the individuals who provided input or their organisations.

                                      Copyright © 2011 BBP. All rights reserved.


Better Metering Toolkit               Home    |    Acknowledgements         |   Glossary                                                       Print         Email            Contact us
3
  Introduction        Contents        Benefits        Meters           Systems           Using Data            Case Studies

  Chairman’s Statement    |   Introduction


                                             Chairman’s Statement
                                             Commercial buildings are responsible for approximately one fifth of the     However, the opportunities for confusion are significant. An increasing
                                             UK’s CO2 emissions, however the sector as a whole has historically          number of suppliers offering a perplexing variety of different metering
                                             been profligate in its attitude to energy use. Such energy wastage          systems, coupled with an understandably confusing variety of terms
                                             not only results in unnecessary cost to business, but is fundamentally      such as ‘smart’, ‘AMR’, ‘advanced’, ‘sub’, ‘fiscal’ and ‘check’ meters,
                                             detrimental to the industry’s efforts to drive down CO2 emissions in        creates potential for a disjointed industry approach to such a key area
                                             line with the government’s ambitious, but necessary reduction targets.      of environmental management.
                                             Effective energy management is therefore an essential part of any
                                             sustainability strategy.                                                    The BBP, tasked with developing practical guidance on the subject,
                                                                                                                         has produced this Toolkit. It sets out the metering options currently
                                             A critical first step in any energy management programme is the             available for commercial buildings, considers the costs and benefits
                                             accurate measurement and monitoring of how much energy a building           and provides advice on how metering data can be used to make
                                             uses. This is by no means an easy process and is an area which Better       energy and cost reductions.
                                             Building Partnership (BBP) members find extremely challenging.
                                                                                                                         I hope that this Toolkit provides a helpful guide for ‘non-technical’
                                             Appropriate metering systems, installed so as to record consumption         decision makers and supports both owners and occupiers when
                                             throughout a building, are able to provide owners and occupiers with        engaging with metering system designers, suppliers and utility
                                             the information necessary in order to take the first steps towards          companies in order to ensure that the most appropriate and
                                             improving the energy efficiency of their buildings. The property industry   effective solutions are implemented in their buildings.
                                             is becoming increasingly interested in the use of metering systems
                                             given their many benefits, including the potential for energy, cost and
                                             CO2 savings, as well as the provision of data to support corporate
                                             reporting and compliance with increasing environmental legislation
                                             such as the CRC Energy Efficiency Scheme. The likely future
                                             mandatory roll-out of Display Energy Certificates to commercial
                                             buildings is an added driver.                                               Quinten Babcock
                                                                                                                         Chairman, Sustainability Benchmarking Working Group


Better Metering Toolkit                      Home     |   Acknowledgements        |   Glossary                                                           Print          Email          Contact us
4
  Introduction        Contents        Benefits      Meters       Systems          Using Data   Case Studies

  Chairman’s Statement    |   Introduction


  1. Introduction

                                                                                                      The UK Government has committed to a binding
                                                                                                      target of reducing carbon emissions by 80% relative
                                                                                                      to the 1990 levels by 2050.

                                                                                                      The absolute level of CO2 emissions has fallen
                                                                                                      less than 20% since 1990, and so substantial
                                                                                                      improvements will have to be made over the
                                                                                                      next 40 years if the target is to be met.

                                                                                                      Since 18% of national carbon emissions come
                                                                                                      from the operation of non-domestic buildings
                                                                                                      a significant reduction in the amount of energy
                                                                                                      we use to heat, cool and power buildings will
                                                                                                      be needed.

                                                                                                      As a significant proportion of the building stock
                                                                                                      that will exist in 2050 is already constructed,
                                                                                                      carbon emission reductions cannot just come
                                                                                                      from increasing the efficiency of new buildings.
                                                                                                      A substantial improvement in energy efficiency will
                                                                                                      be required from the whole sector – every building
                                                                                                      and every occupier of every building will have to
                                                                                                      contribute to delivering the necessary savings.

                                                                                                       Continue


Better Metering Toolkit                      Home   |   Acknowledgements   |   Glossary                                       Print      Email       Contact us
5
  Introduction              Contents               Benefits             Meters               Systems                      Using Data                         Case Studies

  Chairman’s Statement             |   Introduction


                                                 EM1                          EM2

  Introduction                                   Main Utility
                                                 AMR meter
                                                                              AMR
                                                                              Sub-meter

                                                                              EM3
  One of the biggest challenges to improving the energy                              AMR  This Toolkit is about ‘better energy metering’, an approach                          This guide is designed to provide a better understanding
                                                                                     Sub-meter
  efficiency of commercial buildings is a lack of performance                             that offers owners and occupiers energy consumption data                             of energy metering systems, and to inform decision-makers
  data. Owners and occupiers are generally unaware of how well VM1at a greater degree of detail than is provided for basic
                                                                                     Virtual
                                                                                                                                                                               about the choices available when procuring and installing
  or badly their building is performing. It is often said that ‘if you Meter              billing purposes. It allows building owners and occupiers to                         systems. Section 2: Benefits summarises the benefits of better
  can’t measure it, you can’t manage it’. An appropriate energy                           understand how, where and when energy is being used in their                         energy metering. A detailed description of the different types
                        By metering whole building supply and sub-metering occupier and server room consumption, the remaining electricity used to power building services and
  metering system helps tackle this calculated using the formula above. This ‘virtual’building andreduces the need and cost for additional sub-metering of potentially
                        HVAC loads can be issue by enabling owners                         meter therefore to identify and assess savings opportunities (see                   of meter is given in Section 3: Meters. Section 4: Systems
                        multiple other supply cables.
  and occupiers to measure how much energy their buildings are                            Figure 1). However, it is important to note that better metering                     provides guidance on the current options available when
  consuming on a daily basis. This information can then be used                           does not guarantee savings. Rather it is a tool that enables                         selecting a better energy metering system, including some of
  to help deliver energy and cost saving opportunities.                                   better understanding of where and how savings can be made. the costs and benefits. Section 5: Using Data then illustrates
                                                                                          To achieve actual energy and cost savings, someone with                              the ways in which the information generated through better
  These opportunities fall into two distinct categories:                                  the appropriate responsibility and authority to implement an                         metering can be used to improve energy efficiency.
                                                                                          energy saving programme will be required.
  •	 mproved energy management: these are generally
      I
      no or low cost actions that better match the operation
      of the building services to the operational use of the                             Figure 1: Example weekly half hourly profile of electricity consumption
      building. Examples include making sure lighting, heating                           which can be produced through better metering of a commercial building
      and air conditioning is not being used when the building
      is un-occupied.                                                                     900

                                                                                 800
  •	 nvestment in new or enhanced energy efficiency
     I
                                                                                 700
     measures: these can have very short payback periods.
                                                                                 600
     In addition, they often improve the comfort and satisfaction
     of the occupier, and there may be added value in terms                      500

     of attracting occupiers and increasing retention rates.                     400

     Choosing where to invest in energy efficiency measures                      300                                                                                                                                         baseload
     and preparing the appropriate business case should be                       200
                                                                                                    The troughs in the graph show the baseload of the building – i.e. the minimum amount of electricity
     guided by an understanding of how and where energy is                       	 consumed by the building. This occurs overnight when the building is empty. An optimised standard
                                                                                 100 M	 T	W	T	 F	 S	 S
                                                                                                    occupancy building operating during normal working hours should have a baseload of between 10
     used in a building.                                                            0	   consumption during occupied hours operated buildings having approx. 40% baseloads. hours
                                                                                               and 15% of peak consumption, with 24/7
                                                                                                                                      	 consumption during unoccupied
                                                                                            M             T               W             T             F              S              S

                                                                                 The troughs in the graph show the baseload of the building – i.e. the minimum amount of electricity consumed by the building. This occurs
                                                                                 overnight when the building is empty. An optimised standard occupancy building operating during normal working hours should have a
                                                                                 baseload of between 10 and 15% of peak consumption, with 24/7 operated buildings having approx. 40% baseloads.


Better Metering Toolkit                                         Home   |   Acknowledgements                    |    Glossary                                                                                                 Print      Email       Contact us
6
  Introduction          Contents         Benefits        Meters          Systems             Using Data           Case Studies


  Contents

  Acknowledgements 	                                          2   Technical Detail	                                          24

  1. Introduction	                                            3   1	Metering	                                                24
                                                                  2	   Data transmission to a central point	                 31
  Chairman’s Statement	                                       3
                                                                  3	   On-site data collection	                              33
  Introduction	4
                                                                  4	   External transmission for off-site analysis	          35
  2. The benefits of better energy metering	                  7   5	   Data storage	                                         37
                                                                  6	   Data visualisation and analysis	                      39
  2.1	 Understanding the energy performance	                  8
  	    of a building                                              5. Using Data	                                             41
  2.2	 Reporting the energy performance of a building	        9
                                                                  1	Overview	                                                42
  2.3	 Improving owner occupier relationships	               11
                                                                  2	   Comparing a building with other, similar buildings	   43
  3. What is better energy metering?	                        12   3	Comparing how the demand for energy	                    44
                                                                     varies with time service provision	
  3.1	 Main Utility Meters	                                  13
                                                                  4	   Comparing different areas of a building	              45
  3.2	 Sub-meters 	                                          14
                                                                  5	Comparing how the demand for energy 	                   46
  3.3	 What better energy metering options are available?	 16        varies with the weather

  4. Choosing a better energy metering system	 18                 6	   Maintain good records	                                47

  Overview	19                                                     6.	 Case Studies	                                          48
  AMR Schematic	                                             20   British Land	                                              49
                                                                  GE Capital Real Estate	                                    50
  Cost Table	                                                21
                                                                  Land Securities	                                           51
                                                                  Transport for London	                                      52

                                                                  Glossary	54

                                                                  Contact us 	                                               56


Better Metering Toolkit                          Home    |    Acknowledgements        |   Glossary                                Print   Email       Contact us
7
  Introduction        Contents   Benefits    Meters       Systems          Using Data   Case Studies


  2. The benefits of better energy metering

                                                                                               There are numerous benefits available to both
                                                                                               owners and occupiers from installing better energy
                                                                                               metering systems. These are summarised in this
                                                                                               section under the following three headings:

                                                                                               •	  nderstanding the energy performance
                                                                                                  U
                                                                                                  of a building
                                                                                               •	  eporting the energy performance
                                                                                                  R
                                                                                                  of a building
                                                                                               •	 mproving owner occupier relationships
                                                                                                  I

                                                                                                Continue


Better Metering Toolkit               Home   |   Acknowledgements   |   Glossary                                      Print      Email       Contact us
8
  Introduction        Contents     Benefits      Meters           Systems           Using Data             Case Studies


  Benefits                              2.1 Understanding the energy performance of a building
  2.1	Understanding the energy
       performance of a building
                                        Understanding when and where energy is being used is the first            Reducing costs
                                        and most important step in reducing energy consumption. Most,
                                                                                                                  Enhanced understanding of when and where energy is being used
                                        organisations rely on meter readings provided by the utility company
  2.2	  eporting the energy
       R                                                                                                          through automated meter readings allows waste to be identified
                                        within their bills. However, utility companies typically manually read
       performance of a building                                                                                  and suitable corrective measures to be taken (see Section 5: Using
                                        the meters on an annual basis. Hence, monthly or quarterly bills will
                                                                                                                  Data). This saving of energy leads to reductions in energy bills and
  3.3	Improving owner                  be produced on the basis of estimated usage, which may not be an
                                                                                                                  carbon emissions. It is for this reason that better energy metering
       occupier relationships           accurate reflection of actual usage, especially if there has been a
                                                                                                                  systems are seen by Government as an important tool in reducing
                                        change in activity in part of the building.
                                                                                                                  UK carbon emissions. It is anticipated that certain types of meters
                                        Better metering can provide more timely and detailed information          will be required by law for all buildings over time. Further details on
                                        on how energy is being used in a building. It does this by:               the regulatory requirements of different types of meters are provided
                                                                                                                  in Section 3: Meters.
                                        •	  roviding measurements on the amount of energy used during
                                           P
                                           each half-hour period. This enables users to understand how            Bill validation and tariff selection
                                           energy demand varies through the day, and can provide instant          Automated meter readings allow owners and occupiers to cross check
                                           feedback on performance.                                               that they are being billed correctly. For example, billing errors can
                                        •	  roviding a disaggregation of the energy demand into its different
                                           P                                                                      result from inaccurate manual meter readings by the utility company.
                                           end uses, such as lighting and small power for individual occupiers,   Utility companies are also very interested in managing their supply
                                           and major plant items such as chillers etc. This is achieved through   network, and balancing supply and demand. With a detailed
                                           sub-metering and gives a much enhanced understanding of the            understanding of the energy demand profiles of a building, it may
                                           patterns of energy demand within a building.                           be possible to negotiate a more beneficial tariff.
                                        •	  roviding automated reading and logging of meters. If this is
                                           P
                                           linked into a suitable energy management system, then the data         Maintenance contract fees
                                           can be analysed and automated reports prepared.                        Automated meter readings can reduce facilities management costs
                                                                                                                  in a building where regular manual readings take place by reducing
                                        •	  hecking actual consumption against expected profiles and
                                           C
                                                                                                                  the requirement for manual meter inspections. Finding, recording and
                                           providing ‘out of range’ alarms to warn building management
                                                                                                                  consolidating meter readings, especially in a large building, can be a
                                           that corrective action may be required.
                                                                                                                  time consuming exercise. Automating the meter readings can eliminate
                                                                                                                  this task, and also improve the accuracy of data that is recorded.
                                                                                                                  This saving alone can often pay for the cost of installing the improved
                                                                                                                  metering. However, it is prudent to undertake manual readings in the
                                                                                                                  initial period after installation to validate that the automated system is
                                                                                                                  operating correctly and then occasional readings (e.g. twice per year)
                                                                                                                  to confirm the system is still reporting accurately.


Better Metering Toolkit                 Home     |   Acknowledgements        |   Glossary                                                         Print          Email          Contact us
9
  Introduction        Contents     Benefits      Meters           Systems           Using Data            Case Studies


  Benefits                              2.2 Reporting the energy performance of a building
  2.1	Understanding the energy
       performance of a building        Corporate Social Responsibility (CSR) reports                             Public perceptions of owner’s and occupier’s commitment to effective
                                                                                                                  energy management will be influenced by their building’s DEC rating.
                                        Given the increasing public concern over environmental issues, there
                                                                                                                  Better metering will help owners and occupiers obtain good quality
  2.2	Reporting the energy             is growing moral and indeed legal pressure to report environmental
                                                                                                                  data that can help improve the energy rating, both through discounting
       performance of a building        performance. Corporate social responsibility demands that building
                                                                                                                  defined ‘separable’ energy uses (e.g. through sub-metering of
                                        owners and occupiers understand the environmental impact of their
  2.3	Improving owner                                                                                            regional server rooms or trading floors in offices) and improved energy
                                        business activities and take active steps to reduce it. Energy use and
       occupier relationships                                                                                     management. It will also assist building management to prioritise the
                                        consequent carbon emissions rank high on the environmental agenda,
                                                                                                                  list of recommended energy efficiency improvements identified by the
                                        and so understanding and managing energy consumption should be a
                                                                                                                  assessor who produces the certificate.
                                        key part of the management function in every responsible business.
                                                                                                                  Figure 2: Example of a DEC certificate
                                        The classic environmental management cycle is:

                                        •	 Measure and report current performance.
                                        •	 Compare that performance against appropriate benchmarks.
                                        •	 dentify areas of improvement and implement an action plan.
                                           I
                                        •	 Measure the success of the implementation plan.
                                        •	 Repeat the cycle.

                                        Better metering can support these objectives, as part of a suite
                                        of environmental reporting initiatives. The range of environmental
                                        reporting possibilities is diverse, from an internal report to senior
                                        management through to initiatives such as the Carbon Disclosure
                                        Project (CDP).

                                        Display Energy Certificates
                                        The public display of Display Energy Certificates (DECs) is now a legal
                                        requirement in public buildings over 1,000m2 and is likely to be rolled
                                        out to the commercial property sector following the publication of the
                                        government’s Carbon Plan. A DEC includes an energy rating, which
                                        indicates how well the building is performing compared to its peers,
                                        and how energy performance is changing with time (see Figure 2).                                                                 Continue


Better Metering Toolkit                 Home     |   Acknowledgements        |   Glossary                                                        Print         Email          Contact us
10
  Introduction        Contents     Benefits      Meters           Systems           Using Data            Case Studies


  Benefits                              2.2 Reporting the energy performance of a building (continued)
  2.1	Understanding the energy
       performance of a building        CRC Energy Efficiency Scheme                                                 Figure 3: Example four weekly league table of out of hours
                                                                                                                     energy consumption at Transport for London’s Windsor House
                                        The introduction of the Carbon Reduction Commitment Energy
  2.2	Reporting the energy             Efficiency Scheme for organisations using more than 6,000MWh
                                                                                                                                           % Out
       performance of a building        of electricity per annum is a further incentive to have accurate
                                                                                                                      Group Name          of hours        Cost         % Change
                                        and timely energy consumption data. The government is currently
  2.3	Improving owner                  consulting on the operation and design of the scheme. Ultimately,             6th Floor             32%           £101           4%
       occupier relationships           it is expected to increase the cost of energy consumption and thus            13th Floor            32%            £80           9%
                                        encourage energy efficiency.                                                  7th Floor             37%           £140           -7%
                                        Influencing behavioural change                                                8th Floor             37%           £128           -6%
                                        As well as reporting up the management chain, the reporting of energy         5th Floor             38%           £122           0%
                                        performance is a powerful motivational tool that can influence the            10th Floor            40%           £147           2%
                                        behaviour of all staff. For example, publishing league tables highlighting
                                                                                                                      15th Floor            40%           £121           -4%
                                        the out-of-hours energy consumption on different floors of a building can
                                        encourage the switching off of equipment at the end of the working day.       17th Floor            40%           £122           7%
                                        Figure 3, supplied by Transport for London, illustrates the percentage of     9th Floor             41%           £155           0%
                                        energy consumption out of hours (from 19.00-07:00 Mon-Fri and all day
                                                                                                                      11th Floor            41%           £147           1%
                                        Sat-Sun) at Windsor House, which they use to stimulate behavioural
                                        change among employees. In addition, the use of an energy                     14th Floor            41%           £113           4%
                                        dashboard (a visual display of energy consumption e.g. TV screens             12th Floor            42%           £154           2%
                                        or online portal) can help to effectively present energy savings data
                                                                                                                      16th Floor            42%           £147           5%
                                        to company staff, management and visitors. An example of an energy
                                        dashboard can be viewed on the Department of Energy and Climate               18th Floor            44%           £116           12%
                                        Change Homepage.                                                              Ground Floor          48%            £19          -34%
                                                                                                                      3rd Floor             53%           £108           -7%
                                                                                                                      4th Floor             53%           £150           8%
                                                                                                                      1st Floor             65%            £13           41%


Better Metering Toolkit                 Home     |   Acknowledgements        |   Glossary                                                      Print      Email        Contact us
11
  Introduction        Contents     Benefits       Meters          Systems            Using Data            Case Studies


  Benefits                              2.3 Improving owner occupier relationships
  2.1	Understanding the energy
                                        Better metering can deliver improved customer service to occupiers.
       performance of a building
                                        Currently, many occupiers’ bills are simply estimated as a proportion
                                        of the total energy bill for the building e.g. pro-rated by occupied floor
  2.2	  eporting the energy
       R
                                        area. Better metering systems enable a more accurate measurement
       performance of a building
                                        of energy use by each occupier. It allows owners to itemise actual
  2.3	Improving owner                  energy consumption in the service charge, which results in fairer billing
       occupier relationships           and reduced complaints as to the accuracy of bills. Furthermore,
                                        because occupiers will then be paying for the energy they actually
                                        use, they will have a direct incentive to engage in energy reduction
                                        measures within their occupied area.

                                        Offering occupiers a better managed building with a lower total cost
                                        of occupancy, and moreover one which aligns with their own carbon
                                        reduction and sustainability commitments, can be an attractive
                                        proposition. Owners benefit too, because the approach provides
                                        an opportunity to increase retention rates and to reduce building
                                        obsolescence.

                                        The LES-TER initiative (landlord’s energy statement and tenant’s
                                        energy review) provides a tool for recording, benchmarking and
                                        sharing owner and occupier energy consumption data.

                                        Further information on improving owner occupier relationships
                                        can be found in the BBP Green Building Management Toolkit.


Better Metering Toolkit                 Home     |   Acknowledgements         |   Glossary                                Print   Email        Contact us
12
  Introduction        Contents   Benefits    Meters       Systems          Using Data   Case Studies


  3. What is better energy metering?

                                                                                               This section defines the types of meters that are
                                                                                               likely to be present in a building and the options
                                                                                               available for better metering which can be installed,
                                                                                               covering:

                                                                                               •	  ain utility meters
                                                                                                  M
                                                                                               •	  ub-meters
                                                                                                  S
                                                                                               •	  MR, Advanced and Smart meters
                                                                                                  A

                                                                                                Continue


Better Metering Toolkit               Home   |   Acknowledgements   |   Glossary                                         Print    Email        Contact us
13
  Introduction        Contents       Benefits      Meters           Systems           Using Data            Case Studies


  Meters                                  3.1 Main Utility Meters
  3.1	 Main Utility Meters
                                          Many commercial buildings (particularly ones constructed pre-2002
                                          Part L Building Regulations) will only have basic energy metering              BOX 1
  3.2	Sub-meters
                                          comprising main utility meters (also known as ‘fiscal’ meters): one
                                                                                                                         Check meters
  3.3	What better energy metering        each for gas and electricity (see Figure 4 and 5). These are usually
                                          located at the point of entry of the supply to the building and are used       For buildings with over 1MW electrical supply, the utility company
       options are available?
                                          by the utility company for billing purposes. These meters are very             provides both the main utility meter and a ‘check’ meter. The
                                          basic and are similar to those used in domestic buildings. Customers           check meter is required for validation purposes and its reading
                                          typically receive a monthly or quarterly bill that provides the cumulative     is compared against the main meter’s reading to ensure that it is
                                          energy consumption since the last bill. In many cases, the bill will be        operating correctly. The term ‘check’ meter is also often used to
                                          based on estimated energy use unless manual (or automatic) meter               describe any ‘unofficial’ sub-meter used to compare against any
                                          readings have taken place.                                                     main utility or sub-meter.

                                          These meters provide limited information with which to manage the
                                          energy consumption and cost in a building. The energy data can
                                          be used to assess the relative energy performance of a building by
                                          benchmarking it against similar data from other buildings of a similar
                                          type. However, it does not provide information on how, when or where
                                          energy is consumed within a building, which makes it difficult to
                                          establish why energy performance may be poor and how to improve it.


                                          Figure 4: Main electricity meter                                             Figure 5: Main gas meter


Better Metering Toolkit                   Home     |   Acknowledgements        |   Glossary                                                           Print         Email          Contact us
14
  Introduction        Contents       Benefits         Meters             Systems               Using Data                 Case Studies


  Meters                                  3.2 Sub-meters
  3.1	 Main Utility Meters
                                          What is sub-metering                                                                         Developing a sub-metering strategy
  3.2	Sub-meters                          Sub-metering is used to measure part of the energy load in a                                 A clear sub-metering strategy is an important tool in ensuring costs are
                                          building. Depending on the overall metering aims, sub-metering                               minimised when installing a sub-metering system. Some best practise
  3.3	What better energy metering        is likely to include a combination of both location based and energy                         principles include:
       options are available?             load specific measurements.
                                                                                                                                       1. 
                                                                                                                                           Use what sub-meters are already installed and upgrade where
                                          •	  ocation based: Sub-metering may be installed to separately
                                             L
                                                                                                                                           necessary
                                             measure the energy use of each floor or occupier. Such sub-
                                                                                                                                       2 M
                                                                                                                                        .  inimise the number of sub-meters to install by using ‘virtual’
                                             metering helps the building owner determine an occupier’s
                                             consumption to fairly assign their part of the bill.                                          meters. See Figure 7 as an example
                                                                                                                                       3 A
                                                                                                                                        .  ssess the opportunities to install gas, water, heat and coolth
                                          •	  nergy load specific: Sub-metering may be installed for different
                                             E                                                                                             sub-meters rather than just electricity
                                             energy loads to measure their consumption (e.g. lighting, power,                          4. 
                                                                                                                                           Use the existing Building Management System to collect metering
                                             heating and cooling energy). This helps both building owners                                  data where feasible
                                             and occupiers to better manage their energy consumption                                   5. 
                                                                                                                                           Always look to improve the sub-metering capacity when undertaking
                                             (see Figure 6).
                                                                                                                                           a refurbishment or an extension to an existing building, or
                                          For many buildings, there will be no overall sub-metering strategy to                            embarking on major HVAC plant renovation/replacement
                                          fully understand a building’s energy use. Although sub-meters may have                       6. Produce a clear metering schematic which is kept up to date
                                          been installed, the infrastructure required to automatically read and
                                          collect the data may not be in place. Therefore, the first stage of any                      See CIBSE TM39 for in-depth details on how to design, implement
                                          metering strategy should be an audit of each existing meter to document                      and document sub-metering strategies.
                                          the location, function, type and data collection facilities available.
Figure 6: Lift sub-meter
                                          Figure 7: Example of ‘virtual’ metering

                                          Whole building               EM1                               EM2                 Occupier riser electrical supply for analysis of floor lighting and power loads
                                                                       Main Utility                      AMR
                                          electicity supply            AMR meter                         Sub-meter


                                                                      ‘Virtual Meter’                    EM3                 Regional server room electrical supply for analysis of baseloads and DEC separables
                                                                                                         AMR
                                                                      calculation
                                                                                                         Sub-meter
                                                                      VM1=EM1-EM2-
                                                                      EM3                                VM1                 All other electrical supplies for analysis of building services HVAC plant loads
                                                                                                         Virtual
                                                                                                         Meter

                                           By metering whole building supply and sub-metering occupier and server room consumption, the remaining electricity used to power building services and
                                           HVAC loads can be calculated using the formula above. This ‘virtual’ meter therefore reduces the need and cost for additional sub-metering of potentially    Continue
                                           multiple other supply cables.


Better Metering Toolkit                   Home       |   Acknowledgements              |   Glossary                                                                          Print            Email         Contact us
15
  Introduction        Contents       Benefits       Meters          Systems            Using Data             Case Studies


  Meters                                  3.2 Sub-meters (continued)
  3.1	 Main Utility Meters
                                          Regulations
  3.2	Sub-meters                          The provision of sub-metering is also part of the guidance on ways
                                          of satisfying Part L of the Building Regulations:
  3.3	What better energy metering        •	 Sub-metering within new buildings was introduced in Part L 2002.
       options are available?
                                          •	  ub-metering of building services provided as part of the work to
                                             S
                                             existing buildings was introduced in Part L 2006.
                                          •	  ince 2006, for buildings which have a floor area greater than
                                             S
                                             1000m2, sub-metering should be capable of automatic data reading
                                             and collection.
                                          Reasonable provision to comply with Part L is to install metering
                                          that enables at least 90% of the energy consumption for each energy         Figure 8: Gas sub-meter for a Combined Heat and Power
                                          type (electricity and gas) to be assigned to its various end uses           (CHP) engine
                                          (e.g. heating, lighting etc.) (see Figure 8).

                                          Heat and coolth sub-meters
                                          In addition to typical electricity and gas sub-metering, heat and coolth
                                          sub-metering can be used to apportion the energy supplied from
                                          central heating and cooling systems to the occupiers in a building
                                          (see Figure 9).

                                          •	 Heat’ sub-meters can separately measure the hot water flow
                                             ‘
                                             from a central heating system to each occupier and estimate
                                             their energy use.
                                          •	 Coolth’ sub-meters can be used to separately measure the cold
                                             ‘
                                             water flow from a central chilled water air conditioning system to
                                             each occupier and estimate their energy use.

                                          This type of metering is particularly relevant where there is a
                                          disproportionate use of heating or cooling amongst the different
                                          occupiers in a building e.g. where there is a large data centre, or         Figure 9: Heat and coolth sub-meter
                                          24/7 trading floors. Occupiers can be supplied with more accurate
                                          and fairer billing, resulting in fewer complaints and a greater incentive
                                          to engage in energy reduction initiatives.


Better Metering Toolkit                   Home     |   Acknowledgements         |   Glossary                                                     Print      Email        Contact us
16
  Introduction        Contents       Benefits      Meters          Systems            Using Data           Case Studies


  Meters                                  3.3 What better energy metering options are available?
  3.1	 Main Utility Meters
                                          Better energy meters are available which provide more useful              Regulatory requirements
                                          information on the energy consumption in a building. The
  3.2	Sub-meters                                                                                                    AMR metering is mandatory for large users of energy, as follows:
                                          most common names for these meters are ‘advanced meters’,
  3.3	What better energy metering        ‘automatic meter reading (AMR)’ and ‘smart meters’.                       •	  lectricity: AMR meters which provide half-hourly interval
                                                                                                                       E
       options are available?                                                                                          consumption data are required in situations where the average
                                          Automatic meter reading (AMR) or                                             peak electricity demand over the three months of highest
                                          ‘advanced’ metering                                                          consumption within a year exceeds 100kW.
                                          What is AMR/advanced metering                                             •	  as: Daily AMR meters are required where gas is supplied to
                                                                                                                       G
                                          AMR technology provides the ability to read a meter remotely,                sites where the annual consumption level is 58,600MWh or more.
                                          automatically and at frequent intervals. Such meters are also often       By 6th April 2014, the following buildings must also have AMR metering.
                                          termed ‘advanced’. The technology is applicable to both main utility
                                          meters and sub-meters. It is important to note that existing meters can   •	  lectricity: Non-domestic premises which fall into electricity tarriff
                                                                                                                       E
                                          either be replaced with new AMR capable meters or retrofitted with           profile classes 5, 6, 7 and 8.
                                          AMR technology (see Section 4: Systems) for more details.
                                                                                                                    •	  as: Non-domestic premises with an annual consumption
                                                                                                                       G
                                          AMR capable main utility meters allow a utility company to remotely          of more than 732MWh.
                                          access energy consumption data. Energy readings are typically             F
                                                                                                                     or further information see Department of Energy and
                                          recorded on a half-hourly basis, providing much more accurate             Climate Change.
                                          and ‘up to date’ energy usage data (than available through monthly
                                          or quarterly bills). This type of meter also reduces the need for         AMR sub-meters
                                          manual readings and provides the client access to the information         AMR capable sub-meters operate in much the same way as AMR
                                          e.g. via internet ‘portals’.                                              main utility meters. They provide more accurate and ‘up-to-date’
                                                                                                                    energy consumption data for a sub-meter which measures a specific
                                                                                                                    location or energy load – storing and transmitting readings typically
                                                                                                                    on a half-hourly basis. Data for these meters is not transmitted
                                                                                                                    to a utility company but is used by building management where
                                                                                                                    performance can by analysed to ensure efficient operation and
                                                                                                                    identify energy reduction opportunities (See Section 5: Using Data
                                                                                                                    for more information).


                                                                                                                      Continue


Better Metering Toolkit                   Home     |   Acknowledgements        |   Glossary                                                           Print          Email           Contact us
17
  Introduction        Contents       Benefits       Meters           Systems            Using Data            Case Studies


  Meters                                  3.3 What better energy metering options are available? (continued)
  3.1	 Main Utility Meters
                                          ‘Smart’ metering                                                             Common misconceptions
  3.2	Sub-meters                          What is a smart meter?                                                       Within the property industry there is some confusion over the term
                                                                                                                       ‘smart meter’. It is often used by trade press, equipment suppliers
                                          A ‘smart’ meter allows the utility company to both remotely read and
  3.3	What better energy metering        instruct the meter. It therefore provides two-way communication
                                                                                                                       and others to cover all types of intelligent energy meters, including
       options are available?             whereas advanced/AMR meters only allow one-way communication.
                                                                                                                       AMR meters and energy display devices.
                                          This additional functionality (of a utility company being able to instruct   In the UK, the government has committed to roll-out of smart electricity
                                          the meter) allows a number of additional operations, which include:          and gas fiscal meters to all households and smaller non-domestic
                                                                                                                       premises by 2019. A Smart Metering Prospectus jointly published by
                                          •	 updating metering software
                                                                       .
                                                                                                                       DECC and Ofgem in July 2010 set out proposals on the key elements
                                          •	 changing the read frequency.                                              of a smart metering roll-out. A Response to the Consultation was
                                                                                                                       released in March 2010 which sets out the government’s conclusions
                                          •	  emotely controlling an agreed portion of a customer’s consumption
                                             r
                                                                                                                       on how the smart metering roll-out will be organised and regulated
                                             in order to help balance grid electrical generation and demand.
                                                                                                                       and provides details on the high-level functionalities and technical
                                          •	  pdating the metering tariff.
                                             u                                                                         specifications of a smart meter. The planned roll-out is expected to
                                          •	 terminating energy use in the event of non-payment.                       start in 2014, however, for smaller non-domestic buildings where AMR
                                                                                                                       metering has previously been installed, these meters will not need
                                                                                                                       to be replaced with smart meters. No proposals have currently been
                                                                                                                       outlined regarding requirements for larger commercial buildings.


Better Metering Toolkit                   Home     |   Acknowledgements         |   Glossary                                                          Print         Email         Contact us
18
  Introduction        Contents   Benefits    Meters       Systems          Using Data   Case Studies

                                                          Overview | AMR Schematic | Cost Table | Technical Detail


  4. Choosing a better energy metering system

                                                                                                This section provides guidance on the separate
                                                                                                components of an AMR metering system. It is not
                                                                                                intended to be a fully comprehensive guide and the
                                                                                                reader may need additional technical support when
                                                                                                selecting the most appropriate system for their
                                                                                                building(s). However, this section will help when
                                                                                                engaging with system designers, meter system
                                                                                                suppliers and utility companies. It outlines the key
                                                                                                decisions to be made and the main advantages
                                                                                                and disadvantages of options available in the
                                                                                                UK today.

                                                                                                  Continue


Better Metering Toolkit               Home   |   Acknowledgements   |   Glossary                                       Print      Email        Contact us
19
  Introduction         Contents              Benefits       Meters           Systems            Using Data             Case Studies

                                                                             Overview |   AMR Schematic   | Cost Table | Technical Detail


  Overview
                                                  It should be noted that while this section is written principally for a non-   4. External transmission for off-site analysis
    BOX 2                                         technical audience it does provide same detail over and above that
                                                                                                                                 In many cases, metering data is transmitted externally from the
                                                  which a non-technical reader may wish to know.
    The Enhanced Capital                                                                                                         metered building for central storage. This allows data from a
                                                                                                                                 portfolio of buildings to be easily compared and analysed.
    Allowance Scheme                              Estimated costs of various options are provided (see Cost Table), but it
                                                  must be emphasised that the costs are illustrative only – actual outturn
    The Enhanced Capital Allowance                                                                                               5. Data storage
                                                  costs will depend on a number of factors including client needs, the
    (ECA) scheme helps reduce the
                                                  layout of the building, the potential to use existing infrastructure and       The transmitted data is centrally captured and stored.
    costs of investing in AMR metering
                                                  the ease of installing the new system.
    systems. It provides tax relief for a                                                                                        6. Data visualisation and analysis
    range of specified energy saving              A general schematic of an AMR metering system and its associated               The data is analysed using automatic Monitoring  Targeting (aMT)
    technologies, including (Automatic            benefits is provided (see AMR Schematic). The schematic comprises              software. It is this element that is vital in developing an understanding
    Monitoring and Targeting (aMT)               a number of key components. These are summarised below and are                 of how energy is being used in a building. The data itself has little
    systems). This includes the meters,           dealt with in more detail later in this section: (see Technical Detail)        value; it is the analysis of the data that leads to understanding,
    the meter reading system and the
                                                                                                                                 which can then drive positive action.
    analytical software. The tax relief is        1. Metering
    not granted on software when using            This includes the main utility meters and any sub-metering. The meters         7. Energy management
    an external service provider, although        measure the amount of electricity and gas passing through them. Some
    tax relief can still be gained on the                                                                                        As well as procuring the hardware, it is essential to appoint someone
                                                  meters will incorporate memory storage capacity to record half-hourly          to be responsible for the energy management of a building. They
    other components of the system.               energy consumption. Other meters will only have the capacity to
    Further details can be found from                                                                                            need to review the information provided by the data analysis and then
                                                  produce half-hourly ‘pulses’ related to the units of consumption.              take the necessary action to make appropriate savings. Arguably,
    ECA’s web-site: www.eca.gov.uk
                                                                                                                                 the energy manager is the most important part of the system, and
    As an example, through the ECA
                                                  2. Transmission to a central point                                             appointing someone with the appropriate skills and authority should
    scheme, Transport for London                  The half-hourly data needs to be transmitted over a communications             be an integral part of the process.
    (TfL) received a rebate of 19% of             network from the meter to a central point for aggregation / consolidation.
    their costs for metering and aMT                                                                                              Continue
    software systems for their Palestra           3. On-site data collection
    building in Southwark.                        Data loggers or a central data server can provide this aggregation /
                                                  consolidation function by storing readings from the various meters
                                                  within the building. This stage is not necessarily required if all data
                                                  storage and analysis is being carried out off site.


Better Metering Toolkit                           Home     |   Acknowledgements          |   Glossary                                                            Print         Email           Contact us
20
  Introduction              Contents           Benefits         Meters            Systems                    Using Data      Case Studies

                                                                                  Overview | AMR Schematic | Cost Table | Technical Detail


  AMR Schematic
  General schematic of an AMR metering system and its associated benefits

       1                2                  3                            4                                        5                  6                   7
                 Transmission to      On-site data             External transmission                           Data          Data visualisation      Energy
   Metering       a central point      collection               for off-site analysis                         storage          and analysis        management                 Benefits


                                                                                                                                                   Reduction
                                                                                                                                                                              Low carbon
                                                                                                                                                    projects
                                                                                                                                                                                retrofits
                                                                                                                                                  prioritisation
                                                                         Data for
                                                                        main utility
       Chatterbox/relay/                                                meters only                                                                                      Communication
        optical reader                                                                                                                            Benchmarking            to occupiers
                                                                                                                                                                              / staff


                                                                                    Data collector
      Gas

                                                                                                                                                                          DECs/CRC 
                                                                                                                                                                          CSR reporting
   Electricity


                                                                                                                                   Bills
                                                                                                                                                                          Tariff analysis
                                     Data Loggers           External                                     Utility providers                          Energy
     Water                                                                                                                                                                 and contract
                                    or Central Server      Transmitter                                       database                               Manager                negotiations


     Heat
                                                                                                                                                                           Bill validation
                                                                                                              Portal                                                    financial reporting
                                                                                                                                                                            budgeting
    Coolth
                                                                                                                              Main  sub-
                                                                                                                             meter analysis
                                    Data transmitted
                                                                                                                                                                           Building
                                     directly from                                                           aMT                                                         management
                                         meters                                                             database                                                      made aware
                                                                                                                                                                           of issues
                                                                                Data for                                       Automatic
                                                                               all meters                                       alarms


Better Metering Toolkit                                 Home    |   Acknowledgements                 |   Glossary                                             Print   Email           Contact us
21
  Introduction        Contents   Benefits           Meters           Systems          Using Data         Case Studies

                                                                     Overview |   AMR Schematic   | Cost Table | Technical Detail


  Cost Table

   Component                     Option                                  Initial cost                         On-going cost                         Comments
                                                                         (capital + installation)
   Meter                         Enabling existing main utility          £100-£500 per meter                  See relevant box below for
                                 AMR meter                                                                    installing a new main electricity
                                                                                                              or gas AMR meter
                                 Installing a new main                   £300-£500 per meter                  Meter maintenance costs typically     Initial costs assume that there are
                                 electricity AMR meter                                                        met by the meter operator. Their      existing current transformers in
                                                                                                              data collection and support costs     electrical switch gear panels
                                                                                                              would be £50-340 per annum
                                                                                                              depending on external
                                                                                                              transmission method
                                 Installing a new main gas               £600-£5000+ per meter                Meter maintenance costs typically     Initial cost example: fitting a new
                                 AMR meter                                                                    met by the meter asset manager.       80mm rotary meter including new
                                                                                                              Their data collection and support     pipe work will be £3,000 - £3,500,
                                                                                                              costs would be £50-180 per            but in existing metering pipe work
                                                                                                              annum depending on external           it would be £2,000. Then add £800
                                                                                                              transmission method                   for provision of gas logger and
                                                                                                                                                    ancillaries. The higher costs of
                                                                                                                                                    data collection may include some
                                                                                                                                                    elements of external analysis.
                                                                                                                                                    Initial costs can potentially be free
                                                                                                                                                    if utility provider can take over meter
                                                                                                                                                    asset manager role from national
                                                                                                                                                    grid, but this will tie the client to
                                                                                                                                                    their data collection contract
                                 Retrofitting a gas or electricity       £300-£600 per meter                  See relevant main utility or
                                 meter                                                                        sub-meter costs as appropriate
                                 Installing an electricity or gas        £200-400 per electricity sub-meter   See data collection and storage       Initial costs assume that there are
                                 AMR sub-meter                           £600-2,000 per gas sub-meter                                               existing current transformers in
                                                                                                                                                    electrical switch gear panels

                                                                                                                                                                          Continue


Better Metering Toolkit                   Home     |   Acknowledgements       |   Glossary                                                        Print        Email           Contact us
22
  Introduction         Contents   Benefits          Meters        Systems          Using Data          Case Studies

                                                                  Overview | AMR Schematic | Cost Table | Technical Detail


  Cost Table (continued)

   Component                      Option                              Initial cost                        On-going cost                       Comments
                                                                      (capital + installation)
   Internal transmission          Hard-wire                           £60 per 100 metre of cable          See data collection and storage     This is the capital cost of the cable.
                                                                                                                                              The installation costs should be
                                                                                                                                              small during a refurbishment but
                                                                                                                                              potentially prohibitively expensive
                                                                                                                                              during other times
                                  Wireless                            £175-300 per meter                  See data collection and storage     Installation costs not included
   On-site data collection        Bespoke data-logger                 £30-50 per meter channel,           See data collection and storage
                                                                      stand alone GSM data
                                                                      logger equipment cost £600
                                  BMS (already present)               £600 per day for commissioning      See data collection and storage     It should be possible to
                                                                                                                                              commission up to 10-20 meters
                                                                                                                                              per day if located in close proximity
                                  Data Server                         £1,000-2,000, plus £600 per         See data collection and storage     It should be possible to
                                                                      day for commissioning                                                   commission up to 10-20 meters
                                                                                                                                              per day if located in close proximity
   External transmission          Cellular wireless transmitter       £100-300 per meter                  £35-50 per annum                    On-going costs are for
                                                                                                                                              data transmission only
                                  Landline                            £150-200 per landline               £150-£200 per year                  On-going costs are for
                                                                                                                                              data transmission only


                                                                                                                                                                   Continue


Better Metering Toolkit                    Home    |   Acknowledgements    |   Glossary                                                     Print        Email           Contact us
23
  Introduction         Contents      Benefits            Meters       Systems          Using Data     Case Studies

                                                                      Overview |   AMR Schematic   | Cost Table | Technical Detail


  Cost Table (continued)

   Component                         Option                               Initial cost                    On-going cost                         Comments
                                                                          (capital + installation)
   Data collection and storage       Data collection by third party                                       (i)	£20-50 per meter per year        On-going costs are for
                                                                                                               for daily data transmission      data collection only
                                                                                                          (ii)	
                                                                                                               £10-20 per meter per year
                                                                                                               for weekly data transmission
                                     Self-collection                                                      £0-180 per year                       On-going costs depend
                                                                                                                                                on transmission solution
                                                                                                                                                (e.g. Ethernet vs. phone line costs)
   Data visualisation and analysis   aMT software                        £2,000-£50,000                  Yearly license and maintenance        Cost will depend on functionality
                                                                                                          typically 12.5% of original           required from software
                                                                                                          acquisition cost
                                     External analysis                                                    £100-200 per meter per year           Costs assume basic consumption
                                                                                                                                                reporting and alerts. The external
                                                                                                                                                provider may provide additional
                                                                                                                                                services such as acting as a virtual
                                                                                                                                                energy manager


Better Metering Toolkit                       Home     |   Acknowledgements    |   Glossary                                                   Print       Email          Contact us
24
  Introduction        Contents           Benefits      Meters           Systems            Using Data            Case Studies

                                                                        Overview |   AMR Schematic   | Cost Table | Technical Detail


  Detail                                      1. Metering
  1	Metering
                                              The first component in the system is the meter, which measures the          Electricity meter with enabled AMR capability
                                              amount of energy being consumed. This section discusses the key
  2	Data transmission to a                                                                                               If the existing meter already has enabled AMR capability, the data will
                                              decisions necessary in procuring:                                           already be automatically collected and transmitted to a utility company
     central point
                                                                                                                          for billing purposes at half-hourly intervals. If so, there is no need for any
                                              •	 main utility meters to measure the total energy use in a building
  3	   On-site data collection                                                                                            changes to be made to the meter. All that is required is to gain access to
                                              •	  ub-meters to measure energy used by specific areas of the
                                                 s                                                                        the data. There are three options for obtaining the data:
  4	External transmission                       building or particular end-uses (e.g. the chiller).
     for off-site analysis                                                                                                •	  equest that the utility company provides the data, either by
                                                                                                                             R
                                              Main Utility Electricity Meters                                                providing access via a web-portal, or by emailing the data.
  5	Data storage                             Every building will already have a main utility electricity meter (see      •	  ppoint a licensed Data Collector to collect the metering
                                                                                                                             A
                                              Figure 10). It is necessary to check whether it is a half-hourly capable       data for both the utility company and the owner / occupier
  6	   Data visualisation and analysis        meter (i.e. has AMR capability). If not, the meter will need to be either      (see Data Storage).
                                              replaced or retrofitted to provide AMR capability. The three typical
                                                                                                                          •	  equest that the utility company fit a Customer Access Terminal
                                                                                                                             R
                                              scenarios are discussed below.
                                                                                                                             box (‘CAT box’) to enable access to the data feed for an onsite
                                                                                                                             data logger or central server.

                                                                                                                          Electricity meter with un-enabled AMR capability
                                                                                                                          The meter may have the capability of producing half hourly data
                                                                                                                          but it is not currently being remotely accessed for billing purposes.
                                                                                                                          In this instance, retrieving data from the meter should be relatively
                                                                                                                          straightforward by either:

                                                                                                                          •	 Installing an external transmitter direct to the meter
                                                                                                                          •	  equesting that the utility company fit a ‘CAT box’ to enable access
                                                                                                                             R
                                                                                                                             to the data feed for collection by a data logger or central server.

                                                                                                                          The cost will typically range from £100 to £500 depending on what
                                                                                                                          type of device is fitted.


                                                                                                                            Continue
                                              Figure 10: Main electricity meter


Better Metering Toolkit                       Home     |   Acknowledgements        |   Glossary                                                            Print          Email           Contact us
25
  Introduction        Contents           Benefits      Meters           Systems            Using Data              Case Studies

                                                                        Overview |   AMR Schematic   | Cost Table | Technical Detail


  Detail                                      1. Metering (continued)
  1	Metering
                                              Non-AMR capable electricity meter                                           The cost for the supply and fitting of a meter is around £300-£500 per
                                                                                                                          meter. This is likely to be higher if installed outside of normal working hours.
  2	Data transmission to a                   If the current electricity meter does not have AMR capability
     central point                            (see Figure 11), in order to automatically collect meter readings,
                                                                                                                          An alternative solution which does not involve shutting down the
                                              the meter must either be replaced or retrofitted.
                                                                                                                          electricity supply of the building is to install a new AMR ‘sub’ meter just
  3	   On-site data collection                                                                                            downstream of the main utility meter, using split current transformers
                                              Replacing a non-AMR capable electricity meter
                                                                                                                          (CTs) clamped around the mains supply. This provides the same
  4	External transmission                    If choosing to replace a meter, one option is to contact the utility
                                                                                                                          information as if the main utility meter was AMR capable (i.e. total
     for off-site analysis                    company to request that the meter be upgraded. The upgrade might
                                                                                                                          energy consumption in the building) but instead there is simply an
                                              be provided by the utility company at no charge, but if not, they will
                                                                                                                          additional AMR capable meter alongside.
  5	Data storage                             usually agree that the meter be replaced at the organisation’s cost,
                                              subject to using a licensed meter operator (who is responsible for          Retrofitting a non-AMR capable electricity meter
  6	   Data visualisation and analysis        installing and maintaining electricity meters).
                                                                                                                          Rather than replacing the existing meter, it can be modified to allow
                                              For further information on the key players within the electricity and       AMR capability. The key component is a reading device to transform
                                              gas markets and their respective rules see Carbon Trust CTV027.             the analogue meter reading to a data output which expresses energy
                                                                                                                          consumption on a half hourly basis. For example, an optical reader
                                              The main advantages of replacing the meter are that the newly-              can be fixed to the front of the existing meter which ‘watches’ the
                                              installed meter will be designed for AMR-use, be based on latest            rotation of the meter dials and converts this information into data
                                              technology and have greater functionality.                                  outputs (see Figure 13).

                                              The main disadvantage of replacing the meter is that there may              The main advantage of this option is that it is simpler to install than
                                              need to be a total or partial electricity shutdown of the building          replacing the meter and does not require a building shut down.
                                              which can raise several issues:                                             However, the cost can be similar to replacing the existing meter
                                                                                                                          (around £300-£600 per meter) when allowance is made for
                                              •	  lanning an electrical shut-down for, e.g. a commercial office
                                                 P                                                                        commissioning the retrofitted meter.
                                                 building is a complex process and may involve shutting down
                                                 occupier’s server rooms (which may be serving a wider national           The disadvantage of retrofitting is that many older meters do not have
                                                 or international area) and other plant. This may often need to be        bespoke optical readers available on the market and therefore generic
                                                 undertaken outside of normal working hours, which raises both            ones need to be attached, often using glue or sticky tape. This can
                                                 the cost and complexity of planning involved.                            lead to reliability problems e.g. the reading device can come loose or
                                                                                                                          knocked out of place (particularly when manually read by the utility
                                              •	  nce equipment is turned off, it may not start again. This could
                                                 O
Figure 11: Non-AMR meter                                                                                                  provider). This is likely to result in the loss of data and the additional
                                                 happen, for example, with services which are approaching the
                                                                                                                          expense of re-commissioning the system.
                                                 end of their life.

                                                                                                                            Continue


Better Metering Toolkit                       Home     |   Acknowledgements        |   Glossary                                                             Print           Email           Contact us
26
  Introduction         Contents            Benefits       Meters           Systems             Using Data             Case Studies

                                                                           Overview |   AMR Schematic   | Cost Table | Technical Detail


  Detail                                        1. Metering (continued)
  1	Metering
                                                Main Utility Gas Meters
  2	Data transmission to a
                                                As with main utility electricity meters, the first thing to check is
     central point
                                                whether the current main gas meter (see Figure 12 is being remotely
                                                read by the utility company. This will typically not be the case for a small
  3	   On-site data collection
                                                to medium-sized commercial building due to its relatively small energy
                                                demand compared to the current mandatory requirements for an AMR
  4	External transmission
                                                meter. In this situation, the meter will need to be either replaced or
     for off-site analysis
                                                retrofitted to provide AMR capability. The three typical scenarios
  5	Data storage                               are discussed below.

                                                Gas meter with enabled AMR capability
  6	   Data visualisation and analysis
                                                In this case, a meter may be installed where the data is already
                                                being automatically collected and transmitted to the utility company.
                                                However it will probably be recording daily or monthly totals only
  BOX 3                                         (not half-hourly). Whilst useful for billing purposes, it is far less useful   Figure 12: Main gas meter
  Gas safety issues                             for energy management. If the utility company is not prepared to
                                                provide the data direct on a half-hourly basis then a pulsed repeat -
  It is important to note that to obtain
                                                termed Meter Pulse replication Unit (MPU) - can be requested instead
  half-hourly data from a gas meter
                                                for connection and collection of data by an on-site data logger or
  it must not be connected directly
                                                central server. The cost of supplying and fitting such a device is in
  to an electrical supply for safety
                                                the order of £400.
  reasons. Therefore, a battery powered
  pulse relay switch (often called a            Gas meter with un-enabled AMR capability
  ‘chatterbox’), or an optical reader
                                                In situations where a meter is not currently being remotely accessed
  will be required prior to connection
                                                but can produce half-hourly data, it should be relatively straightforward
  and collection of data by a data
                                                to fit a chatter box (see Box 3) for the collection of data by an on-site
  logger or central server.
                                                data logger or central server. The cost of supplying and fitting such a
                                                device is in the order of £100-500.

                                                Non-AMR capable gas meter
                                                If the current gas meter does not have AMR capability, in order
                                                to automatically collect meter readings, the meter must either be              Figure 13: Optical reader (courtesy of PA Energy)
                                                replaced or retrofitted.                                                                                                            Continue


Better Metering Toolkit                         Home     |   Acknowledgements          |   Glossary                                                         Print        Email          Contact us
27
  Introduction        Contents           Benefits       Meters           Systems            Using Data             Case Studies

                                                                         Overview |   AMR Schematic   | Cost Table | Technical Detail


  Detail                                      1. Metering (continued)
  1	Metering
                                              Replacing a non-AMR capable gas meter                                          Retrofitting a non-AMR capable gas meter
  2	Data transmission to a                   The cost of fitting a replacement gas meter is more variable than              As with a non-AMR electricity meter, the existing gas meter can be
     central point                            for an electricity meter.                                                      similarly modified to be read remotely by coupling it with a reading
                                                                                                                             device to provide a pulse output e.g. optical reader. The cost of
                                              •	  or a small domestic style gas meter, the cost is around £600-£800
                                                 F                                                                           retrofitting an existing meter is similar to retrofitting an electricity meter
  3	   On-site data collection
                                                 for full AMR capability.                                                    (£300-£600). Hence, particularly for larger gas installations, retrofitting
  4	External transmission                    •	  hen replacing a larger gas meter, the cost can be in the region
                                                 W                                                                           can be an attractive option. Note the same issues for retrofitting
     for off-site analysis                       of £5,000 due to the greater amount of installation work involved.          electricity meters also apply to gas meters. (See Retrofitting a non-AMR
                                                                                                                             capable electricity meter).
  5	Data storage                             It is always worth checking whether the utility company will upgrade
                                              the gas meter free of charge. However, there are costs associated with         It is important that all bolt-on retrofit devices fitted to utility meters are
  6	   Data visualisation and analysis        this upgrade as the utility company will now become the meter asset            registered with the utility provider or they are likely to be removed when
                                              manager for the ‘free’ upgrade. It is usually necessary to sign up to the      the meter is next read manually.
                                              utility company’s AMR contract with annual costs of circa £200 per year.

                                              For further information on the key players within the electricity and            BOX 4
                                              gas markets and their respective rules see Carbon Trust CTV027.                  AMR Water Metering
                                              To be able to measure the gas flow, gas meters are always fitted                 It may be beneficial to implement an AMR water metering
                                              in-line. Therefore, adding or changing a meter requires disruption to            strategy. Main water meters can be replaced or retro-fitted,
                                              the gas feed. Whilst this requires greater installation effort than for          and sub-meters can be installed, to provide more detailed
                                              an electricity meter (pipes need to be emptied, purged, cut, re-sealed           information on water consumption (see Figure 14). Such a
                                              and tested prior to re-commissioning) it may well be less disruptive to          strategy can used to deliver improved water management and
                                              the organisation e.g. it will not affect the operation of vital IT services.     occupier billing, comparable to energy metering. AMR water
                                              Installation can be carried out outside normal working hours or during           meters act in a similar manner to gas metering in that they
                                              the summer months when no space heating is required.                             measure the flow (in this case of water) and produce pulsed
                                                                                                                               outputs related to units of consumption. This data can be used
                                              Gas meters may also impose a significant pressure drop. Since gas                to identify normal and abnormal flow rates which help identify
                                              appliances usually require a minimum supply pressure, installing                 leaks and potential efficiency improvements. Many of the issues
                                              a new meter may require a re-commissioning exercise, with                        related to the installation of an AMR water metering system are
                                              consequent cost and business disruption. There are various options               similar to those outlined here for gas, however it is important to
Figure 14: AMR capable water
                                              for replacement metering systems and it is worth discussing with                 seek specialist advice for water metering.
sub-meter
                                              potential meter providers any solutions that might be available
                                              to minimise disruption.
                                                                                                                                                                                         Continue


Better Metering Toolkit                       Home     |   Acknowledgements         |   Glossary                                                               Print          Email           Contact us
28
  Introduction        Contents           Benefits      Meters          Systems           Using Data           Case Studies

                                                                       Overview |   AMR Schematic   | Cost Table | Technical Detail


  Detail                                      1. Metering (continued)
  1	Metering
                                              Sub-metering                                                              Figure 15: Electricity sub-metering of a photovoltaic array
  2	Data transmission to a                   Section 3: Meters described how sub-metering can be used to measure
     central point                            part of the energy load in a building. The key decisions to be made are
                                              whether to sub-meter the building and, if so, the sub-metering strategy
  3	   On-site data collection                to be adopted i.e. what areas or part-loads to sub-meter.

  4	External transmission                    Do you need to sub-meter your building?
     for off-site analysis                    The decision as to whether to sub-meter a building depends on
                                              the reasons for installing the new metering system.
  5	Data storage
                                              •	  o improve energy management: In buildings that are not
                                                 T
  6	   Data visualisation and analysis           complex e.g. a single HVAC system, quick and large wins can often
                                                 be made by initially focussing on analysing the main utility meter
                                                 readings (see GE Capital Real Estate case study). Sub-metering
                                                 is particularly helpful for buildings with more complex building
                                                 services systems and for investigating power load issues that          Renewables and low carbon technologies (e.g. photovoltaics,
                                                 cannot be resolved from the main meter readings. By knowing the        solar thermal, wind turbines and Combined Heat and Power (CHP)
                                                 expected power loads of the specific energy consuming appliances
                                                                                                                        plant can also be sub-metered and monitored to ensure the technology
                                                 (e.g. chillers and or handling units) and the times that they should
                                                                                                                        is performing according to expectations, as well as for reporting
                                                 be operating, a quick check can be made to see if they are operating
                                                                                                                        purposes (see Figure 15).
                                                 as intended.
                                              •	  o improve occupier billing: in this case, sub-meters should be
                                                 T                                                                      For the purposes of improving energy management, the recommended
                                                 installed to separately measure the energy use of each occupier.       approach is to only install meters where the potential cost saving from
                                                                                                                        reduced energy consumption is likely to outweigh the cost of the
                                              What to sub-meter in a building                                           metering point (see Box 6). As a guide, action taken as the result of
                                              Most sub-metering systems solely measure electricity consumption          installing a meter can save a minimum of between 5-10% of the energy
                                              within the building. Sub-metering for gas is less common as, for many     flowing through it. For more information CIBSE TM39 provides detailed
                                              office buildings, the gas supply principally feeds a single heating       explanations on location based sub-metering
                                              system and there are no other significant loads to measure. However,
                                                                                                                        The cost of the supply and installation of an electricity sub-meter with
                                              it can be relevant where there are multiple heating systems (e.g. a
                                                                                                                        AMR capability is similar to the cost of a main utility meter (£200 to £400).
                                              hotel or large office may have separate space and hot water heating
                                                                                                                        In addition, there will be an on-going cost for maintenance. The number
                                              systems) or there is a significant use of gas other than for heating
                                                                                                                        of sub-meters installed will depend on the overall metering strategy.
                                              (e.g. a building includes a large catering facility).
                                                                                                                          Continue


Better Metering Toolkit                       Home    |   Acknowledgements        |   Glossary                                                           Print          Email           Contact us
29
  Introduction          Contents             Benefits       Meters          Systems            Using Data             Case Studies

                                                                            Overview |   AMR Schematic   | Cost Table | Technical Detail


  Detail                                          1. Metering (continued)
  1	Metering
                                                  Challenges to sub-metering
  2	Data transmission to a                       There are some practical issues associated with sub-metering that              BOX 6
     central point                                need to be considered at the procurement stage as they could affect            Cost of sub-metering
                                                  the cost and appropriateness of a sub-metering system.
                                                                                                                                 This example evaluates whether it is cost-effective to install a
  3	    On-site data collection
                                                  •	 n existing buildings, a major problem with installing electricity sub-
                                                     I                                                                           lighting sub-meter in a building. A similar calculation could be
  4	External transmission                           metering is the lack of accurate schematics. These are needed               applied to the sub-metering of any energy load.
     for off-site analysis                           in order to accurately associate the meter with the various loads
                                                     connected to it. Often, distribution board schedules are inaccurately       In an office having a floor area of 500m2, with a lighting load
                                                     labelled or not labelled at all! Tracing the circuits can take              of 12W/m2, intended to be operating for 10 hours per day on
  5	Data storage
                                                     considerable time, effort and cost.                                         weekdays only, the running cost of the lighting, at 10p/kWh,
                                                                                                                                 is of the order of £1,500 per year.
  6	    Data visualisation and analysis           •	  ervices in most existing buildings were not designed with sub-
                                                     S
                                                     metering in mind. For example, lighting and power circuits may              To evaluate whether it is cost-effective to install a lighting sub-
                                                     both have been originally served from the same distribution board.          meter, the cost of the meter should be compared with the cost
  BOX 5                                              New loads may be added to existing electrical circuits in the most          of the additional energy that would be used if the lighting were
  Portable sub-meters                                convenient and cost-effective way. This can make it challenging             left on longer than intended as, without the meter, the building
                                                     to separate and measure the desired energy loads.                           operator would probably not be aware of this wastage. If the
  Portable meters with a data logging                                                                                            lights were needlessly left on for an additional 2 hours per day,
  capability can be a cost-effective              •	  ome non-AMR sub-metering may already be present in a building.
                                                     S
                                                                                                                                 this would equate to an extra £300 per year spent on electricity.
  alternative to identify energy wastage             In this case, there are similar issues as main utility meters when
                                                                                                                                 If having the sub-meter helped to ensure that the lights were
  in areas where fixed, permanent                    considering whether to replace or retrofit. It is quite possible that
                                                                                                                                 switched off when not required, then the simple payback period
  sub-metering cannot be justified                   sub-metering is present, but no record of where the meters are
                                                                                                                                 for the sub-meter would probably be very short, and installation
  financially. Once any inefficiencies are           located and what they are measuring.
                                                                                                                                 of the meter would be considered cost-effective.
  identified and corrected, the portable
                                                  Installing sub-metering when unsure of the connected loads is unlikely
  sub-meter can easily be removed and,                                                                                           The ease with which data from the sub-meter can be used by
                                                  to deliver meaningful information. Therefore it is recommended that the
  if required, redeployed elsewhere.                                                                                             the building operator should also be considered, as well as the
                                                  first step must be a survey of the existing infrastructure (including ‘clamp
  However, specialist knowledge is                                                                                               building operator’s willingness to act on this information to keep
                                                  on’ load surveys) so that the metering strategy and subsequent energy
  required to connect the portable sub-                                                                                          the lights switched off when they are not required.
                                                  management actions are based on reliable information.
  meter safely and access the data for
  analysis using the device’s bespoke                                                                                            (Reproduced from CIBSE TM39: 2009 by permission of
  software application.                                                                                                          the Chartered Institution of Building Services Engineers).


                                                                                                                                 Continue


Better Metering Toolkit                           Home     |   Acknowledgements         |   Glossary                                                          Print         Email          Contact us
30
  Introduction        Contents           Benefits      Meters           Systems            Using Data            Case Studies

                                                                        Overview |   AMR Schematic   | Cost Table | Technical Detail


  Detail                                      1. Metering (continued)
  1	Metering
                                              Heat and coolth sub-meters                                                   Owner sub-metering for occupier billing
  2	Data transmission to a                   As mentioned in Section 3: Meters, heat and coolth sub-metering              In buildings where an owner has responsibility for the main utility
     central point                            can be used to apportion the energy supplied from central heating            supplies to the building and on floor lighting  power consumed within
                                              and cooling systems to the occupiers in the building.                        the occupier’s demise is recharged to occupiers through the use of
  3	   On-site data collection                                                                                             occupier billing sub-meters, under the Electricity Act 1989 the owner
                                              Heat and coolth sub-meters both comprise of two key components:              is ‘on-selling’ electricity and for this reason the meters must be Ofgem
  4	External transmission                    •	  flow meter to measure the volume of water flowing through
                                                 A                                                                         certified. By 2016 all new occupier meters used for billing purposes
     for off-site analysis                       the pipe-work                                                             must conform with the EU Measuring Instruments Directive (MID).
                                                                                                                           Typical costs vary from £200-£500 (not including installation and
  5	Data storage                             •	  wo temperature sensors to measure the temperature difference
                                                 T                                                                         commissioning), however on-selling electricity meters can require
                                                 between the flow and the return pipe-work.                                recalibration or replacement every 10 years.
  6	   Data visualisation and analysis
                                              The flow meter and temperature sensors can be locally connected to           For further information see the National Measurement Office
                                              a heat calculator which determines the energy used by the specific
                                              energy load e.g. individual occupier heating or cooling (see Figure
                                              16). The heat calculators then output data related to units of energy
                                              consumption via pulse cable connection or via ‘data packages’ over
                                              Ethernet connections. As an alternative, the flow meter and temperature
                                              sensors can be hard-wired to a Building Management System (BMS).
                                              The BMS calculates the energy consumption of each occupier.

                                              There may be practical issues in installing the meters. For example:

                                              •	  pace is required to access the pipe work and install the meter.
                                                 S
                                                 This can be difficult where there are other building services
                                                 co-located in the same area.
                                              •	  here will need to be disruption to the heating or cooling system
                                                 T
                                                 to install an in-line flow meter. This can be effectively managed by
                                                 undertaking the necessary work during summer or winter months
                                                 as appropriate.

                                              As with all water flow sub-metering a non-intrusive alternative to in-line
                                              metering is to use an ultrasonic flow meter that clamps on to existing       Figure 16: Heat/Coolth calculator
                                              pipe work and measures temperature change and flow rate. However,
                                              this form of metering is less accurate and will also require a permanent
                                              power supply which may not be available in the required location.


Better Metering Toolkit                       Home     |   Acknowledgements        |   Glossary                                                            Print         Email          Contact us
31
  Introduction        Contents           Benefits       Meters           Systems            Using Data             Case Studies

                                                                         Overview |   AMR Schematic   | Cost Table | Technical Detail


  Detail                                      2.	Data transmission to a central point
  1	Metering
                                              Once a meter reading has been taken the data needs to be transmitted         There may however, be issues of signal strength for internal wireless
                                              to a central point for storage. This may be a multi-staged approach          communication depending on the relative location of the meters and
  2	Data transmission to a
                                              depending on the complexity of the situation. For example:                   main transmitter. An alternative is to use a mesh network (e.g. using
     central point
                                                                                                                           the Zigbee communications standard) whereby all of the meters
                                              •	 n a single building, the metering data may simply be internally
                                                 I
  3	   On-site data collection                                                                                             communicate wirelessly with each other, which effectively boosts
                                                 transmitted to a central server within the building. This may be
                                                                                                                           each meter’s signal strength to the main transmitter (see Figure 17).
                                                 via a direct connection from the meters to the server or via data
  4	External transmission                       loggers connected to the server.                                          As a rule, wireless communication, no matter how advanced, is prone
     for off-site analysis                                                                                                 to data gaps if there is a break in communication. However, this is only
                                              •	  or a multi-building portfolio, it is likely to be a combination of
                                                 F
                                                 internal and external transmission using both data loggers and            an issue if a major spike in consumption occurs that requires analysis
  5	Data storage
                                                 external transmitters.                                                    within the specific half-hour period of data that has been lost.
  6	   Data visualisation and analysis        This section first deals with internal transmission options for connecting
                                                                                                                           Figure 17: Comparison between traditional and mesh
                                              meters to data loggers, central servers or external transmitters. There
                                                                                                                           network communications
                                              are many possible means of internal data transmission. Some common
                                              options are outlined here, but the list is not exhaustive.
                                                                                                                           Traditional hard wired or       Mesh network wireless communication
                                              Wireless transmission                                                        wireless communication
                                              Wireless transmission is communication without the use of physical
                                              wires. Data is transmitted through the use of a transmitter and receiver
                                              at the two connected locations.

                                              An internal wireless network has a number of advantages for
                                              existing buildings where installation of a wired network is prohibitive.
                                              In particular,
                                              •	 t allows different components of the system to be located anywhere
                                                 I
                                                 in the building.                                                                Datalogger/external
                                                                                                                                                                   AMR capable meter
                                              •	 t is simple to expand the capacity of the network – new components
                                                 I                                                                               transmitter
                                                 can be added without the need to install new cabling.
                                              •	 t is less expensive when connecting over long distances where
                                                 I
                                                 cabling becomes difficult or transmission of data weakens.
                                                                                                                                                                                  Continue
                                              •	 n a building where there are no risers or containment options
                                                 I
                                                 e.g. shopping centres


Better Metering Toolkit                       Home     |   Acknowledgements         |   Glossary                                                          Print         Email          Contact us
32
  Introduction        Contents           Benefits       Meters          Systems            Using Data             Case Studies

                                                                        Overview |   AMR Schematic   | Cost Table | Technical Detail


  Detail                                      2.	Data transmission to a central point (continued)
  1	Metering
                                              Hard wired cabling
  2	Data transmission to a                   In this case, data cables are installed within a building (see Figure 18).
     central point                            The main advantages of this approach are that it is a very reliable form
                                              of communication and provides fast transmission speeds. This could
  3	   On-site data collection                be via ‘twisted pair’ pulse cables or Ethernet cables depending on
                                              the meters’ data output capabilities.
  4	External transmission
     for off-site analysis                    Hard wired cabling is a practical option when connecting components
                                              located close to each other. However, if components need to be
  5	Data storage                             connected over a long distance e.g. to a central server, installation
                                              of a new cabled communication network in an existing building can
  6	   Data visualisation and analysis        be disruptive and expensive. The cabling routes must fit within the
                                              existing building structure, potentially involving routing channels in
                                              the fabric of the building or accessing cramped and confined spaces.

                                              Other options
                                              A building’s data telecommunication network could be utilised.
                                              However, this is subject to:

                                              •	  greement from the IT team who for security reasons may
                                                 a
                                                 not wish to include additional devices on the IT system; and
                                              •	  dequate capacity being available near meter locations (which
                                                 a
                                                 are usually in the plant room away from IT infrastructure).
                                              Another option which exists is to use the building’s electrical wiring
                                              network to transmit data (i.e. Ethernet over power). Any meter or
                                              data logger with Ethernet output can use this communication facility.
                                              However, power outlets and proprietary products are required to deliver
                                                                                                                           Figure 18: Hard wired cabling installation for internal transmission
                                              this approach and it is not possible to transmit between sites or areas
                                                                                                                           of main water meter pulses
                                              of a building wired on different phases or incoming supplies.


Better Metering Toolkit                       Home     |   Acknowledgements         |   Glossary                                                        Print        Email        Contact us
33
  Introduction        Contents           Benefits      Meters           Systems            Using Data            Case Studies

                                                                        Overview |   AMR Schematic   | Cost Table | Technical Detail


  Detail                                      3.	On-site data collection
  1	Metering
                                              Each data output from an AMR meter corresponds to a fixed amount          Data logger
                                              of energy consumption, expressed as pulses per kWh or ‘packages’
  2	Data transmission to a                                                                                             Traditionally, a data logger (see Figure 19) is separate to the meter.
                                              of data depending on the type of meter that is installed:
     central point                                                                                                      The logger has one or multiple input channels, with each one being
                                              •	  tandard electricity AMR meters will produce pulse outputs, while
                                                 S                                                                      able to be connected to a different meter to collect pulse outputs.
  3	   On-site data collection                   more high-end electricity meters (meters with greater functionality)   The logger will also have one or more output channels to allow
                                                 can send ‘data packages’ via ethernet connections. These data          on-going data transmission e.g. connecting multiple data loggers in
  4	External transmission                       packages can contain a number of additional electrical parameters      a row (often referred to as daisy chaining) to one central server or
     for off-site analysis                       which may be of interest to building management to understand          external transmitter.
                                                 the power consumption and base loads of specific equipment
  5	Data storage                                                                                                       There are a wide variety of data loggers, however most operate with
                                                 e.g. a chiller, however these meters are more expensive.
                                                                                                                        a proprietary data collection application and it may be necessary to
  6	   Data visualisation and analysis        •	  as and water meters only have the ability to produce
                                                 G                                                                      seek specialist advice on the most appropriate technology.
                                                 pulse outputs.

                                              In which ever form data is sent from the meter, the information needs
                                              to be captured by a storage device before the information can be
                                              analysed. Typically, such storage devices count and store data emitted
                                              by the meters in each half-hourly period and then convert this into
                                              half-hourly energy or water consumption. This may be either:

                                              •	  emporary data collection via a data logger prior to on-going
                                                 T
                                                 e.g. daily or weekly data transmission to an internal or external
                                                 central server. Data loggers can generally only store pulse
                                                 data outputs
                                              •	  entral storage via a central metering server or BMS. These
                                                 C
                                                 can store pulse data outputs as well as data packages from
                                                 high-end electricity meters.
                                                                                                                        Figure 19: Data logger

                                                                                                                                                                              Continue


Better Metering Toolkit                       Home     |   Acknowledgements        |   Glossary                                                        Print        Email          Contact us
34
  Introduction        Contents           Benefits      Meters           Systems            Using Data            Case Studies

                                                                        Overview |   AMR Schematic   | Cost Table | Technical Detail


  Detail                                      3.	On-site data collection (continued)
  1	Metering
                                              Central metering server                                                   •	  areful commissioning will be required to ensure the BMS is
                                                                                                                           C
                                                                                                                           recording accurate data. This is particularly true for calculated
  2	Data transmission to a                   It is possible to set up a bespoke central metering server to store the
                                                                                                                           meters such as heat and coolth meters
     central point                            captured metering data. Central servers can receive data via data
                                              loggers or direct from the AMR meters themselves. Whilst costing          •	  pecific data logging and scheduling standards will need setting out
                                                                                                                           S
  3	   On-site data collection                significantly more and possibly requiring the setting up of additional       in order to capture data consistently for any onward transmission.
                                              communication structure in a building, this option may be selected
  4	External transmission                    for the following reasons:
     for off-site analysis
                                              •	 Central storage for on-site data analysis.                                BOX 7
  5	Data storage                             •	 Central storage before external transmission for analysis.                Combined AMR meters
                                              •	  o receive ‘data packages’ containing additional electrical
                                                 T                                                                         AMR meters can be supplied with a combined meter, logger
  6	   Data visualisation and analysis
                                                 parameters from high-end electricity meters which traditionally           and transmitter all in one box. This option is most common for
                                                 data loggers are unable to receive.                                       new main electricity meters. The unit may have multiple input
                                                                                                                           channels e.g. it may be possible to use an electricity meter
                                              Building Management System (BMS)                                             with an integral data logger to capture data from the main gas
                                                                                                                           and water meters and thus provide a simple solution for whole
                                              In a similar way to having a central server, it may be possible to use
                                                                                                                           building multi-utility AMR monitoring. This integral unit may be an
                                              the existing BMS to store the captured metering data. This option
                                                                                                                           attractive option as it avoids the need to separately purchase and
                                              can achieve significant cost savings, since the communication
                                                                                                                           connect multiple components, although it is then not possible to
                                              infrastructure and data storage is already in place.
                                                                                                                           change one component in isolation. The cost for this option is in
                                              However, it is important that the BMS is assessed thoroughly to              the region of £400-£600 per meter.
                                              make sure it has the capability to deliver the proposed additional
                                              functionality. For example:

                                              •	  he BMS may not be designed for, or have the capacity for
                                                 T
                                                 the continuous acquisition of data from multiple meters.
                                              •	  here may be insufficient hard-wire connection points on the
                                                 T
                                                 BMS out-stations to connect the sub-meters.


Better Metering Toolkit                       Home     |   Acknowledgements        |   Glossary                                                         Print         Email          Contact us
35
  Introduction        Contents           Benefits      Meters          Systems            Using Data            Case Studies

                                                                       Overview |   AMR Schematic   | Cost Table | Technical Detail


  Detail                                      4.	External transmission for off-site analysis
  1	Metering
                                              In many cases, metering data is transmitted externally from the          phone operators can be checked and a SIM card installed for the
                                              metered building prior to being provided to the end user. This can       operator with the best signal. Alternatively, a remote antenna can be
  2	Data transmission to a
                                              occur in instances when:                                                 installed to link the metering point to an area of the building where a
     central point
                                                                                                                       better signal can be found.
                                              •	  he owner or occupier has a portfolio of properties and the
                                                 T
  3	   On-site data collection                   metering data from these buildings is externally transmitted          In terms of cost, it is advisable for an owner or occupier to check their
                                                 to a central storage centre.                                          SMS mobile tariff. Mobile tariffs exist with unlimited SMS messages
  4	External transmission                                                                                             but are rarely selected on business contracts. Tariffs with free SMS
     for off-site analysis                    •	  he owner or occupier has contracted an external data collection
                                                 T
                                                                                                                       messages will significantly reduce costs of data transmission.
                                                 service which collects the metering data on the organisation’s
  5	Data storage                                behalf. The cost of data transfer and collection by a data bureau
                                                                                                                       Landline communications
                                                 service is typically £20-60 per year per meter (assuming daily
                                                                                                                       An alternative option is to use landline communications where an
  6	   Data visualisation and analysis           transmission of data).
                                                                                                                       analogue telephone line is reserved for the transmission of metering data.
                                              •	  he utility company is collecting the AMR data from main utility
                                                 T
                                                 meters for billing purposes.                                          This is a very reliable communication method and avoids problems
                                                                                                                       of poor signal strength that can be associated with wireless
                                              There are many possible means of external data transmission. Some        communication. As an example, a conventional telephone line is
                                              common options are outlined here, but the list is not exhaustive.        the normal method of communicating with a half-hourly utility billing
                                                                                                                       electricity meter. It can also be used to transmit data from other main
                                              Use of cellular wireless technology                                      utility meters or sub-meters (see Transport for London case study
                                              As well as for internal communication, wireless technology can           as an example).
                                              also be used for longer range external communication using cellular
                                                                                                                       This method of communication can be more expensive than the
                                              technology (GSM). SMS messages are transmitted periodically
                                                                                                                       wireless option, as there are additional costs of procuring the line
                                              (e.g. daily) from each data logger or central server comprising
                                                                                                                       and paying a line rental charge (circa £150 per phone line). However
                                              all half-hourly readings since the previous transmission.
                                                                                                                       for many large organisations, there may be no charge if transmitting
                                              The main problem with cellelar wireless communication is signal          data between their own buildings. This may be relevant if, for example,
                                              strength. Meters are often located in areas of a building with either    an owner or occupier is transmitting data from multiple buildings to a
                                              a significant amount of electrical interference or in basements with     central server located in, say, their headquarters building.
                                              structural barriers. As a result, cellular signals may be very weak.
                                              When setting up the system, the signal strength from various mobile        Continue


Better Metering Toolkit                       Home     |   Acknowledgements        |   Glossary                                                        Print          Email          Contact us
36
  Introduction        Contents           Benefits      Meters          Systems            Using Data           Case Studies

                                                                       Overview |   AMR Schematic   | Cost Table | Technical Detail


  Detail                                      4.	External transmission for off-site analysis (continued)
  1	Metering
                                              Other communication options                                                calls or SMS messages. The main benefit of high frequency data
                                                                                                                         transmission is through the use of automated alerts which tell the
  2	Data transmission to a                   There are many other communication options, which include:
                                                                                                                         building management that energy consumption has gone outside a pre-
     central point
                                              •	 Walk by’ meter readings whereby a handheld meter reader with a
                                                 ‘                                                                       defined tolerance range, allowing quick remedial action to be initiated.
  3	   On-site data collection                   built-in or attached receiver/transceiver (radio frequency or touch)
                                                                                                                         In most cases, receiving ‘live’ data is unlikely to be worthwhile.
                                                 is used to collect meter readings from an AMR capable meter.
                                                                                                                         The cost of having someone constantly available to take action,
  4	External transmission                       This is a simple option to set-up as it only requires a meter reader
                                                                                                                         and the associated transmission costs of live data, are likely to
     for off-site analysis                       to pass each meter on a meter reading route, however, it is likely
                                                                                                                         outweigh the benefits of being able to take immediate action.
                                                 to be a more labour intensive (and costly) solution for the energy
  5	Data storage                                management of a large building portfolio where there may be a           More common is the transmission of data on a day-to-day or weekly
                                                 requirement for frequent data collection from hundreds of meters.       basis. Whereby data is transmitted overnight (daily) or over a weekend
  6	   Data visualisation and analysis        •	  computer network and internet connection. However, this will
                                                 A                                                                       (weekly) and the building management receives the information when
                                                 be subject to approval of corporate IT teams who may have               they next log in.
                                                 concerns with connecting devices to their networks and especially
                                                                                                                         The main issues with longer transmission frequencies are:
                                                 external parties accessing devices on that network from outside
                                                 a corporate firewall.                                                   •	  s periods get less frequent, the longer the time before the building
                                                                                                                            A
                                              •	  ower Line Communications (PLC) where metering data is
                                                 P                                                                          management is alerted to an issue and is able to take appropriate
                                                 transmitted over electricity power lines. While not a common               remedial action.
                                                 transmission option in the UK, it may be used more extensively in       •	 f the identified issue is a transient one, it will be more difficult to
                                                                                                                            I
                                                 the future. Utility companies are working towards the development          find out what was occurring at a given point in time, particularly
                                                 of this transmission option as it will be an attractive communication      if significant time has passed since the issue occured.
                                                 method considering the government’s plans for the roll-out of smart
                                                 meters and development of ‘smart grids’.                                •	  here is greater chance of data loss if a communication problem
                                                                                                                            T
                                                                                                                            develops during a longer period between data transmissions.
                                              Frequency of transmission
                                                                                                                         Longer data transmission periods (e.g. monthly) are more appropriate
                                              Once a decision on how data will be transmitted externally has             when the focus of a AMR system is simply to provide more accurate
                                              been made, a further decision on the frequency of data transmission        occupier billing. Note that the data logged is still half-hourly but the
                                              is required.                                                               data is transmitted at differing intervals e.g. 48 readings are sent
                                                                                                                         per day, or 336 readings per week etc.
                                              The decision will depend on the benefits gained from having data
                                              provided more frequently. As a general rule, the more frequent the
                                              transmission, the greater the cost e.g. the cost of additional phone


Better Metering Toolkit                       Home     |   Acknowledgements        |   Glossary                                                            Print          Email            Contact us
37
  Introduction        Contents           Benefits       Meters          Systems            Using Data            Case Studies

                                                                        Overview |   AMR Schematic   | Cost Table | Technical Detail


  Detail                                      5.	Data storage
  1	Metering
                                              Externally transmitted data is received and stored in a central storage      There is likely to be a small fee for the second option e.g. a daily read
                                              unit. The organisation receiving the data might be:                          over GSM could cost between £20-£50 per meter per year whereas
  2	Data transmission to a
                                                                                                                           the cost of a weekly read could be around £10-£20 per meter per
     central point                            •	  he utility company, who then make the data available to the
                                                 T                                                                         year, however, it does provide data tailored for the organisation’s
                                                 building owner and/or occupier via web access or e-mail. This is          use whereby:
  3	   On-site data collection                   most likely for single buildings, where sub-metering is not required.
                                                                                                                           •	  ata can be put into an appropriate format to aid input to an
                                                                                                                              D
  4	External transmission                    •	  he organisation that manages the building: This is most likely
                                                 T
                                                                                                                              aMT system (see Section 5: Using Data).
     for off-site analysis                       where an owner, occupier or managing agent is responsible for a
                                                 portfolio of buildings. Assembling the data across the portfolio allows   •	  ata will be unprocessed and can be reviewed to identify any
                                                                                                                              D
  5	Data storage                                a consistent approach to data analysis and reporting, and facilitates        missing information. This can highlight any data transmission
                                                 comparison of performance between buildings of similar type/use.             and collection problems.
  6	   Data visualisation and analysis
                                              •	  specialist data collection service, which may additionally provide
                                                 A                                                                         Where an existing main utility meter has been enabled by an owner
                                                 data analysis and reporting services. This is most likely for large       or occupier to provide AMR data (i.e. the meter had not previously
                                                 and/or complex portfolios of buildings.                                   been enabled to provide AMR data to the utility company), there is
                                                                                                                           an advantage in using a licensed Data Collector to collect this data as
                                              Main utility meter providing half-hourly data to                             they are able to make the data available to the utility company. The utility
                                              utility company                                                              company can then produce a customer read bill in place of an estimated
                                              Where the main utility meter data is being transmitted to the utility        bill which will result in more accurate monthly/quarterly bills than a large
                                              company at half-hourly intervals, there are two options, depending           reconciliation when the meter is only read manually once a year.
                                              on the electricity supply contract in place:
                                                                                                                             Continue
                                              •	  or half-hourly contracted buildings, request that the utility company
                                                 F
                                                 provides the data, either by providing access via a web-portal,
                                                 or by emailing the data.
                                              •	  or non-half hourly contracted buildings appoint a licensed Data
                                                 F
                                                 Collector to collect the metering data for both the utility company
                                                 and the organisation.


Better Metering Toolkit                       Home     |   Acknowledgements         |   Glossary                                                            Print          Email           Contact us
38
  Introduction        Contents           Benefits       Meters          Systems            Using Data             Case Studies

                                                                        Overview |   AMR Schematic   | Cost Table | Technical Detail


  Detail                                      5.	Data Storage (continued)
  1	Metering
                                              Sub-meters
  2	Data transmission to a                   There are two main options for the collection and storage of sub-
     central point                            metering data:

  3	   On-site data collection                •	  ata collection service: A third-party accesses and stores the data
                                                 D
                                                 on an owner or occupier’s behalf, which the organisation may wish
  4	External transmission                       to subsequently download (see British Land, GE Capital Real Estate
     for off-site analysis                       and Land Securities case studies).
                                              •	  elf-collection: The owner or occupier accesses and stores
                                                 S
  5	Data storage                                the metering data via a modem or IT network (see Transport for
                                                 London case study).
  6	   Data visualisation and analysis
                                              The main advantage of selecting a data collection service over self-
                                              collection is that it can greatly increase the ease and cost effectiveness
                                              of data collection and storage when collecting data for a number of
                                              buildings. For example, a building owner may have a large portfolio
                                              of buildings which has been acquired over time. Each building has
                                              its own separate AMR metering system and the owner wishes to
                                              collect all the metering data onto one central database. Each metering
                                              system has different communication protocols and therefore requires
                                              separate approaches to communicate with each building, making it a
                                              complex and costly exercise to buy all the necessary equipment if a
                                              self-dialled option is chosen. By selecting a data collection service, a
                                              third party who already has the specialist knowledge and necessary
                                              communication equipment required to collect all the data, can collect
                                              and provide the data to the owner in the desired format, removing the
                                              burden from the owner.


Better Metering Toolkit                       Home     |   Acknowledgements         |   Glossary                                       Print   Email        Contact us
39
  Introduction         Contents          Benefits       Meters          Systems            Using Data             Case Studies

                                                                        Overview |   AMR Schematic   | Cost Table | Technical Detail


  Detail                                      6.	Data visualisation and analysis
  1	Metering
                                              Once data has been collected, this information needs to be analysed              and automatic alerts if the energy consumption goes outside a
                                              to understand how energy is being consumed in a building. This will              pre-defined tolerence range. The cost would increase if additional
  2	Data transmission to a
                                              help the owner/occupiers realise the benefits outlined in Section 2:             services were required. As an example, the service provider can
     central point
                                              Benefits, e.g. ensuring efficient operation and identifing energy saving         additionally act as a ‘virtual’ energy manager, providing bespoke
  3	   On-site data collection                opportunities. This analysis is carried out by automatic Monitoring and          advice to reduce consumption. The cost of such services obviously
                                              Targeting (aMT) software. There are a number of different packages              depends on the size of the building portfolio. Some providers
  4	External transmission                    on the market that provide a variety of services depending on the                guarantee an agreed level of energy savings from using their
     for off-site analysis                    owner’s / occupier’s requirements e.g. bill validation and alert functions.      energy management service (See British Land case study).


  5	Data storage                             Who analyses the data?                                                        The choice between these two options will depend on a number of
                                              There are two main options for how data can be analysed:                      factors, including the number of meters in the system, the level of
  6	   Data visualisation and analysis                                                                                      flexibility required from the software and the availability of in-house
                                              •	  he building management can access the information stored directly
                                                 T                                                                          staff to run software on their PC. It should be noted that in the former
                                                 or via a data collector and download it into a software package.           option, there may be significant manual effort in transferring the data
                                                 The software could be on their PC, on their company server or              into the software package.
                                                 on a web-server usually hosted by the owner of the software. A
  BOX 8
                                                 key advantage of the latter option is that it can be accessed from         Software options
  Selecting the right aMT                       anywhere by anyone who needs to analyse or review the data. It             Whichever of the two options is selected, a further decision needs
  software package                               is possible to undertake analysis using a spread sheet or software         to be made as to which software package to select.
                                                 tools that are freely available, but this is unlikely to be sufficient
  It is recommended that the building            for a commercial property owner or occupier with a large portfolio         •	 n the first option, the owner / occupier will be able to choose from all
                                                                                                                               I
  management request a trial before              and multiple meters in each building. The cost of dedicated aMT              of the available software packages and the different alternatives
  purchasing an aMT software                    software ranges from £2,000 to upwards of £50,000 depending on                within these packages (e.g. a basic version or a more expensive
  package. The supplier should be                the capabilities required. In addition, there may be an annual license        version with enhanced functionality).
  asked to populate the software with            fee and a maintenance contract for technical support.
  some data relevant to the owner                                                                                           •	  data collection service will have already produced or purchased
                                                                                                                               A
  / occupier which will allow for             •	  n external service provider undertakes the analysis, with the
                                                 A                                                                             their software. The owner / occupier will need to decide which of the
  appropriate testing and ensure the             information being accessed via the internet. The cost is typically            available analysis and reporting functions they wish to pay for.
  chosen software package has the                £100-200 per year for a main utility meter, often less for each sub-
  desired reporting functionality.               meter. This provides basic periodic reporting of energy consumption,
                                                                                                                              Continue


Better Metering Toolkit                       Home     |   Acknowledgements         |   Glossary                                                             Print         Email           Contact us
40
  Introduction        Contents           Benefits           Meters            Systems          Using Data             Case Studies

                                                                              Overview |   AMR Schematic   | Cost Table | Technical Detail


  Detail                                      6.	Data visualisation and analysis (continued)
  1	Metering
                                              aMT software packages may include one or more of the                               •	 Energy procurement – to help select and negotiate the best tariff
                                              following features:
  2	Data transmission to a                                                                                                       •	  tatutory reporting – production of DECs or CRC compliance
                                                                                                                                     S
     central point                            •	 Energy management – consumption reporting, exception alerts                         reports (see Section 2: Benefits).
                                              •	  ccupier billing – to manage the process of creating invoices for
                                                 O                                                                                The requirements set by Transport for London in a tendering exercise to
  3	   On-site data collection                   sub-metered occupiers                                                            select an aMT software package that fully integrated the capture, analysis
  4	External transmission                    •	 nvoice validation – to identify billing errors and help reclaim
                                                 I                                                                                and reporting is provided in Box 9. Half hourly data from AMR meters is
     for off-site analysis                       overcharges                                                                      referred to as High Frequency (HF) data, while weekly manual meter reads
                                              •	 Financial forecasting – future energy consumption and costs                      and invoice based data is referred to as Low Frequency (LF) data.
  5	Data storage

  6	   Data visualisation and analysis              BOX 9

                                                    aMT software requirements for Transport for London
                                                    Low frequency (LF) data                                                       High frequency (HF) data
                                                    •	 Manual invoice data entry                                                  •	 mport of data – supplier and bureau based
                                                                                                                                     I
                                                    •	  lectronic data entry and compatibility with different supplier formats
                                                       E                                                                          •	 Data validation
                                                    •	 nvoice validation – user readings or HF data based
                                                       I                                                                          •	 Data management
                                                    •	 Management of invoice queries                                              •	 Standard reporting capability
                                                    •	 Invoice audit trails                                                       •	 User defined reporting
                                                    •	 Accrual management                                                         •	 Profile targeting
                                                    •	 Target setting                                                             •	  roduction of ‘out of hours’ Energy League Table
                                                                                                                                     P
                                                    •	 Regression analysis                                                        •	  onversion of HF to LF data for ‘Occupier on-selling’
                                                                                                                                     C
                                                    •	 Forecasting                                                                •	 Cost Centre Accounting
                                                    •	 Compatibility with TfL’s finance systems                                   •	 Adverse trend identification
                                                    •	 Integration with HF data handling
                                                    •	 Standard reports
                                                    •	 User defined reports
                                                    •	  ccupier ‘off charging’ report development
                                                       O
                                                    •	  our weekly ‘Performance Analysis’ Reports and link to TfL intranet
                                                       F


Better Metering Toolkit                       Home        |   Acknowledgements         |   Glossary                                                               Print          Email          Contact us
41
  Introduction        Contents   Benefits    Meters       Systems          Using Data   Case Studies


  5. Using Data

                                                                                               This section provides an outline of the various
                                                                                               techniques that can be used to analyse and
                                                                                               manage energy performance. Each have
                                                                                               their advantages and limitations and the different
                                                                                               options available will depend on the extent and
                                                                                               type of metering installed.

                                                                                                 Continue


Better Metering Toolkit               Home   |   Acknowledgements   |   Glossary                                      Print      Email        Contact us
42
  Introduction        Contents     Benefits       Meters          Systems             Using Data           Case Studies


  How to use the data                   1. Overview
  1	Overview
                                        Installing meters is only the first stage in the energy management          It is also important to realise that effective energy management is
                                                                                                                    not a one off process but something that has to be undertaken on a
  2	Comparing a building with          process (see Figure 20). Meters generate data on utility consumption,
                                                                                                                    continuing basis. The way a building is used changes with time, as new
     other, similar buildings           but raw data has to be analysed to turn it into useful information. This
                                        information then has to be interpreted and understood. Understanding        occupiers take space, as different working practices are adopted,
  3	Comparing how the demand           can then be used to make decisions. Decisions prompt appropriate            or as bad habits creep back in. For example, one of the most frequent
     for energy varies with time        actions, and it is the results of these actions that will deliver energy,   causes of energy wastage is where the building systems have been
                                        cost and carbon savings.                                                    set up to service the way the building was being used by previous
  4	Comparing different areas                                                                                      occupiers, but have never been adjusted to the meet the different
     of a building                      Figure 20: Energy management process                                        needs of the current occupiers. This can result in plant running longer
                                                                                                                    than necessary in all or parts of the building. Even routine events like
  5	Comparing how the                                                                                              the change to/from summer time can mean that plant operating hours
     demand for energy                                                                                              can be out of synchronisation with occupancy patterns.
     varies with the weather                                         Install                                       A well considered metering strategy, coupled with analysis and
                                                                     Measure                                        interpretation of the data will allow an owner or occupier to identify
  6	   Maintain good records
                                                                                                                    such wastage. This will not only save energy, it may increase the life
                                                                                                                    of plant, and may improve the comfort and satisfaction of occupiers.
                                                     Assess                             Analyse

                                                                                                                      Continue


                                                 Implement                             Understand


                                                                      Decide


Better Metering Toolkit                 Home     |   Acknowledgements          |   Glossary                                                        Print         Email          Contact us
43
  Introduction        Contents            Benefits      Meters           Systems            Using Data                 Case Studies


  How to use the data                          2. Comparing a building with other, similar buildings
  1	Overview
                                               If there is no AMR metering in a building providing half-hourly                If an organisation occupies several buildings, it can be particularly
                                               data then the most appropriate analysis is to compare the annual               helpful to also compare a building with others similar in the portfolio
  2	Comparing a building with
                                               energy performance with other similar buildings (see Figure 22). This          (see Figure 23). By identifying good and poor performers in a portfolio,
     other, similar buildings
                                               assessment will be based on manual readings of the main utility                it may be possible to identify trends that allow the application of lessons
  3	Comparing how the demand                  meters. It is important to use actual readings and not estimated usage         from the good performers to the poorer ones. There can also be a
     for energy varies with time               as provided by the utility company. This is the approach adopted for the       useful motivational spin-off from this peer benchmarking process. A key
                                               Display Energy Certificate (DEC), which generates an energy label for          requirement for improved energy performance is enthusiastic buy-in
  4	Comparing different areas                 a building. Although only required for public buildings over 1,000m2,          from staff. Healthy competition can often provide the incentive that
     of a building                             private owners and occupiers can voluntarily choose to produce a DEC.          repeated exhortation fails to deliver!
                                               The underpinning methodology provides a very useful starting point
                                               in understanding a building’s energy performance. The Operational              For more information on sustainability benchmarking see BBP
  5	Comparing how the
                                               Rating that is displayed on the DEC will indicate how well a building is       Sustainability Benchmarking Toolkit for Commercial Buldings.
     demand for energy
                                               performing relative to the national stock of similar buildings (see Figure     For further examples of how to report environmental performance
     varies with the weather
                                               21). Clearly, some buildings would be expected to perform better than          see BBP Green Building Management Toolkit.
  6	   Maintain good records                   the national stock average by virtue of the progressive improvement in
                                                                                                                              Figure 23: Example CO2 intensity benchmarking of a portfolio
                                               energy efficiency standards imposed by successive revisions of Part
                                                                                                                              of office buildings
                                               L of the Building Regulations. Therefore a newly constructed building
                                               that achieves an E-rating is more likely to be wasting energy than a                                800
Figure 21: Example of a DEC certificate
                                               twenty-five year old building with the same E-rating. The owner of the
                                                                                                                                                   700
                                               new building should therefore give particular attention to improved
                                               energy management. The older building should not neglect energy                                     600
                                               management, but should also consider how the fabric or services
                                               might be improved to reduce energy demand.                                                          500


                                                                                                                              kg CO2 / m2 / year
                                               Figure 22: Example comparison of a building’s annual energy                                         400

                                               consumption against a set of pre-determined benchmarks
                                                                                                                                                   300


                                                                                                                                                   200


                                                                                                                                                   100


                                                                                                                                                     0
                                                                                                                Electricity                                Non-AirCon               AirCon - Standard                          AirCon - Prestige
                                                                                                                Gas
                                                                                                                                                         The chart represents over 100 office buildings ordered in terms of carbon intensity by floor
                                                                                                                                                         area (kgCO2/m2/year), categorised into three bands based on the type of installed HVAC
                                                 Current       Target       Best       Typical      Portfolio                                            system (provided by ECON 19). The green line (based on the median value) provides a
                                               performance                practise   performance    average                                              benchmark which individual buildings can be compared against.


Better Metering Toolkit                        Home     |    Acknowledgements        |   Glossary                                                                                              Print                 Email                  Contact us
44
  Introduction        Contents     Benefits      Meters           Systems            Using Data            Case Studies


  How to use the data                   3. Comparing how the demand for energy varies with time
  1	Overview
                                        A more detailed understanding can be gained if information is available      Figure 24: Example weekly half-hourly profile of electricity
                                        on how the energy demand of a building varies with time. This is             consumption of a commercial office building
  2	Comparing a building with
                                        possible if AMR metering is installed, since as well as measuring
     other, similar buildings                                                                                        900
                                        annual consumption, it is possible to consider how the energy                800

  3	Comparing how the demand           demand varies through the year, the week and even through the day.           700

     for energy varies with time        By comparing the energy demand during different periods (day/night,          600

                                        weekday/weekend etc.), it is possible to identify energy wastage             500
  4	Comparing different areas
                                        e.g. office equipment being left on, plant running over bank holidays        400
     of a building
                                        etc. It is also useful to compare performance during different               300

                                        weekdays – if there are significant differences, this may be a sign of
  5	Comparing how the                                                                                               200
                                        waste. One example is to use energy demand time profiles from the
     demand for energy                                                                                               100
                                        use of office equipment to fine tune HVAC operating hours. Another
     varies with the weather                                                                                           0
                                        example of this is where early morning cleaners come in three days                     M              T              W             T              F             S              S

                                        per week and leave lights on when they leave. On mornings when the
  6	   Maintain good records                                                                                         The troughs in the graph show the baseload of the building – i.e. the minimum amount of electricity consumed
                                        cleaning service is not operating, staff arriving later accept the natural   by the building. This occurs overnight when the building is empty. An optimised standard occupancy building
                                                                                                                     operating during normal working hours should have a baseload of between 10 and 15% of peak consumption,
                                        light levels as being satisfactory and so do not switch the lights on. A     with 24/7 operated buildings having approx. 40% baseloads.

                                        simple instruction to cleaners to turn non-essential lights off when they
                                        finish can deliver real savings at no cost.                                                Occupied                                    Unoccupied

                                        Figure 24 shows the time profile of the energy consumption of a              Familiarity with the usual demand profiles can also be helpful in
                                        building over a week, with shades of blue indicating occupied and            diagnosing problems more quickly. Any significant change in the
                                        unoccupied operational hours. It is clear that significant energy use        profile of energy demand must be caused by a change in the building,
                                        occurs outside of occupied hours, both during the weekend period             either in the way it is used, or in the operating regime of the plant. If
                                        and during weekdays both prior to and after occupancy. It is important       the change cannot be explained by known alterations to the use of
                                        to understand the energy uses during the non-occupied hours to               the building, then this signals a possible failure in the way the plant
                                        determine if they can be reduced.                                            is operating. Quick identification and rectification of the issue will save
                                                                                                                     money and provide more confortable conditions for occupier’s / staff.


Better Metering Toolkit                 Home     |   Acknowledgements        |   Glossary                                                                             Print                   Email                Contact us
45
      Introduction        Contents     Benefits              Meters               Systems                  Using Data                   Case Studies


      How to use the data                       4. Comparing different areas of a building
      1	Overview
                                                If sub-meters are installed, it is possible to extend the benchmarking                                                           Figure 26: Example of weekly half-hourly profile of electricty
                                                process to different parts of the same building. This eliminates a                                                               consumption with sepaerated server and floor lighting loads
      2	Comparing a building with
                                                further variable that causes differences in energy performance,
         other, similar buildings
                                                i.e. the age and design of the building itself. Comparing the energy                                                                                          50
                                       900      demand of different areas can help identify significant areas of waste.
      3	Comparing how the demand                                                                                                                                                                             40
                                       800
         for energy varies with time            The following charts provide examples of the type of analysis which                                                                                                                                                                           900

                                                                                                                                                                                                                                                                                              800
                                       700
                                                can be undertaken using aMT software to analyse sub-metering                                                                                                 30
                                                                                                                                                                                                                                                                                              700
      4	Comparing different areas     600      data in a building. Figure 25 shows how a building’s sub-systems (the                                                                                                   50


                                                                                                                                                                                 kW
                                                                                                                                                                                                                                                                                              600
         of a building                          blue bars) compare with industry benchmarks (the green areas). The                                                                                            20        40                                                                    500
                                       500
                                                left edge of the green area represents good practice – anything under                                                                                                                                                                         400

      5	Comparing how the             400      this is good. The right edge of the green area represents typical practice                                                                                    10
                                                                                                                                                                                                                        30
                                                                                                                                                                                                                                                                                              300


                                                                                                                                                                                                                   kW
         demand for energy             300      – anything over this is poor. Figure 26 shows the weekly half-hourly                                                                                                    20
                                                                                                                                                                                                                                                                                              200


         varies with the weather       200
                                                profile of a building with separated server and lighting loads. Analysis                                                                                       0
                                                                                                                                                                                                                                                                                              100

                                                                                                                                                                                                                        10   M     T        W           T        F         S         S          0
                                                of individual systems over time such as this can make it easier to                                                                                                                                                                                      M

      6	   Maintain good records       100      locate areas of potential energy wastage within a building. Figure 27                                                                                                    0
                                                                                                                                                                                                                   Central Plant  other W              Central Plant  other unmetered       The troughs
                                                                                                                                                                                                                                                                                              by the build
                                         0      shows how a building owner can compare individual occupier energy                                                                                                          M       T              T         F      S        S
                                                                                                                                                                                                                                                                                              operating d
                                                                                                                                                                                                                   unmetered loads (occupied)           loads (unoccupied)                    with 24/7 op
                                                consumption in a multi-occupied Th
                                                  M              T               W            building over a 24 hour period. S
                                                                                                              F           S                 This
                                                type of analysis can be used to support the engagement process with                                                                                                Floor lighting  Small               Server Rooms and associated cooling
                                       The troughs in the graph show the baseload of the building – i.e. the minimum amount of electricity consumed
                                       by the building. This occurs overnight when energy efficiency opportunities. occupancy building
                                                occupiers when discuss the building is empty. An optimised standard                                                                                                Power only
F    S          S
                                       operating during normal working hours should have a baseload of between 10 and 15% of peak consumption,                                                                                                                                                         P

                                       with 24/7 Figure buildings having approx. 40%breakdown of a buildings sub-systems
                                                 operated 25: CO emissions baseloads.                                                                                            Figure 27: Example single day comparison of occupier
                                                                     2                                                                                                                                                                                                                                  O

                                                compared to industry standards                                                                                                   electricty consumption in a multi-occupied office
                                                                                                                                                                            10                                10                                                               Occupier A
                                                     Refrigeration
                                                                                                                                                                                                               9
                                                                                                                                                                             9                                                                                                 Occupier B
                                                Pumps  controls                                                                                                                                               8

                                                                                                                                                                             8                                                                                                 Occupier C
                                                                                                                                                                                                               7
                                                 Office equipment


                                                                                                                                                                                 kWh used in each half hour
                                                                                                                                                                             7                                 6                                                               Ground floor


                                                                                                                                               kWh used in each half hour
                                                          Lighting                                                                                                                                             5
                                                                                                                                                                             6

                                                    Humidification                                                                                                                                             4
                                                                                                                                                                             5
                                                                                                                                                                                                               3
                                                         Hotwater
                                                                                                                                                                             4                                 2

                                                          Heating
                                                                                                                                                                             3                                 1


                                                                                                                                                                                                               0
                                                                                                                                                                             2

                                                                                                                                                                                                                   00:30
                                                                                                                                                                                                                   01:00
                                                                                                                                                                                                                   01:30
                                                                                                                                                                                                                   02:00
                                                                                                                                                                                                                   02:30
                                                                                                                                                                                                                   03:00
                                                                                                                                                                                                                   03:30
                                                                                                                                                                                                                   04:00
                                                                                                                                                                                                                   04:30
                                                                                                                                                                                                                   05:00
                                                                                                                                                                                                                   05:30
                                                                                                                                                                                                                   06:00
                                                                                                                                                                                                                   06:30
                                                                                                                                                                                                                   07:00
                                                                                                                                                                                                                   07:30
                                                                                                                                                                                                                   08:00
                                                                                                                                                                                                                   08:30
                                                                                                                                                                                                                   09:00
                                                                                                                                                                                                                   09:30
                                                                                                                                                                                                                   10:00
                                                                                                                                                                                                                   10:30
                                                                                                                                                                                                                   11:00
                                                                                                                                                                                                                   11:30
                                                                                                                                                                                                                   12:00
                                                                                                                                                                                                                   12:30
                                                                                                                                                                                                                   13:00
                                                                                                                                                                                                                   13:30
                                                                                                                                                                                                                   14:00
                                                                                                                                                                                                                   14:30
                                                                                                                                                                                                                   15:00
                                                                                                                                                                                                                   15:30
                                                                                                                                                                                                                   16:00
                                                                                                                                                                                                                   16:30
                                                                                                                                                                                                                   17:00
                                                                                                                                                                                                                   17:30
                                                                                                                                                                                                                   18:00
                                                                                                                                                                                                                   18:30
                                                                                                                                                                                                                   19:00
                                                                                                                                                                                                                   19:30
                                                                                                                                                                                                                   20:00
                                                                                                                                                                                                                   20:30
                                                                                                                                                                                                                   21:00
                                                                                                                                                                                                                   21:30
                                                                                                                                                                                                                   22:00
                                                                                                                                                                                                                   22:30
                                                                                                                                                                                                                   23:00
                                                                                                                                                                                                                   23:30
                                                                                                                                                                                                                   00:00
                                                                                                                                                                             1


                                                                                                                                                                             0
    Better Metering Toolkit                     Home        |   Acknowledgements                  |   Glossary                                                                                                                                  Print          Email           Contact us
                                                                                                                                                                                 00:30
                                                                                                                                                                                 01:00
                                                                                                                                                                                 01:30
                                                                                                                                                                                 02:00
                                                                                                                                                                                 02:30
                                                                                                                                                                                 03:00
                                                                                                                                                                                 03:30
                                                                                                                                                                                 04:00
                                                                                                                                                                                 04:30
                                                                                                                                                                                 05:00
                                                                                                                                                                                 05:30
                                                                                                                                                                                 06:00
                                                                                                                                                                                 06:30
                                                                                                                                                                                 07:00
                                                                                                                                                                                 07:30
                                                                                                                                                                                 08:00
                                                                                                                                                                                 08:30
                                                                                                                                                                                 09:00
                                                                                                                                                                                 09:30
                                                                                                                                                                                 10:00
                                                                                                                                                                                 10:30
                                                                                                                                                                                 11:00
                                                                                                                                                                                 11:30
                                                                                                                                                                                 12:00
                                                                                                                                                                                 12:30
                                                                                                                                                                                 13:00
                                                                                                                                                                                 13:30
                                                                                                                                                                                 14:00
                                                                                                                                                                                 14:30
                                                                                                                                                                                 15:00
                                                                                                                                                                                 15:30
                                                                                                                                                                                 16:00
                                                                                                                                                                                 16:30
                                                                                                                                                                                 17:00
                                                                                                                                                                                 17:30
                                                                                                                                                                                 18:00
                                                                                                                                                                                 18:30
                                                                                                                                                                                 19:00
                                                                                                                                                                                 19:30
                                                                                                                                                                                 20:00
                                                                                                                                                                                 20:30
                                                                                                                                                                                 21:00
                                                                                                                                                                                 21:30
                                                                                                                                                                                 22:00
                                                                                                                                                                                 22:30
                                                                                                                                                                                 23:00
                                                                                                                                                                                 23:30
46
  Introduction        Contents     Benefits      Meters          Systems           Using Data           Case Studies


  How to use the data                   5. Comparing how the demand for energy varies with the weather
  1	Overview
                                        Some aspects of energy demand are weather dependent, heating and                    Figure 28: Correlation of heating fuel use against degree days
                                        cooling being the main examples. Techniques are available to analyse
  2	Comparing a building with
                                        the weather dependency of the building’s energy use. Such techniques
     other, similar buildings
                                        are often integrated within aMT packages and can provide a real                                                                                 kWh/m2                     HDD
  3	Comparing how the demand           insight into the efficiency with which the building is being used. The
     for energy varies with time        most common technique is based on the concept of ‘degree-days’,
                                        a measure of the severity and duration of cold weather. The Figure 28
  4	Comparing different areas          shows a correlation of heating fuel usage against degree days. Poor
     of a building                      energy management is identifiable where the general shapes of the
                                        two datasets do not match e.g. July as shown. More detailed analysis
  5	Comparing how the                  is possible using regression statistical techniques (see Figure 29).
     demand for energy                  A consistent summer load can indicate a baseline demand for heat
     varies with the weather            (usually the demand for hot water and catering services). This hot
                                        water demand can then be compared with established norms to
  6	   Maintain good records            assess the efficiency of hot water generation and use.
                                                                                                                                                  J       F        M         A        M         J        J        A        S        O         N         D
                                        More sophisticated techniques can be applied to on-going monitoring,
                                                                                                                            Figure 29: Correlation of gas consumption against
                                        by highlighting when there is a significant deviation from a long
                                                                                                                            increasing coldness
                                        established pattern of performance. This can be used to identify
                                        emerging faults, but also to confirm expected savings have been                                     350

                                        achieved following an investment in an energy efficiency measure.
                                                                                                                                            300
                                        The Carbon Trust Guide CTG004, Degree days for energy management


                                                                                                                 Gas consumption 000s kWh
                                        provides an overview of these more detailed techniques.                                             250


                                                                                                                                            200


                                                                                                                                            150


                                                                                                                                            100


                                                                                                                                             50


                                                                                                                                              0
                                                                                                                                                                                                                                   increasing coldness

                                                                                                                                                  The graph shows how gas consumption varies with the external temperature. The horizontal axis shows
                                                                                                                                                  increasing coldness towards the right, the vertical axis shows how much gas was consumed in the building.
                                                                                                                                                  Where the blue line meets the vertical axis shows the theoretical gas baseload of the building. The closeness
                                                                                                                                                  of the points to the line (r2) show how well controlled the building’s heating system is. A perfectly controlled
                                                                                                                                                  building will have an r2 value of 1.00.


Better Metering Toolkit                 Home    |   Acknowledgements        |   Glossary                                                                                                     Print                   Email                    Contact us
47
  Introduction        Contents     Benefits      Meters          Systems            Using Data             Case Studies


  How to use the data                   6. Maintain good records
  1	Overview
                                        In order for any energy management strategy to be effective,
                                        it is important to document:
  2	Comparing a building with
     other, similar buildings           •	  ow any new meters fit in with the overall metering strategy
                                           h
                                           for the building.
  3	Comparing how the demand
     for energy varies with time        •	  hanges made to the way the building systems are managed or
                                           c
                                           operated to ensure understanding of what has been done and why.
  4	Comparing different areas          •	  ny energy efficiency measures and monitor their effectiveness
                                           a
     of a building                         to aid learning for future opportunities and replication across
                                           other buildings.
  5	Comparing how the
     demand for energy                  A building log-book is the appropriate place to store this information,
     varies with the weather            so that is preserved in a consistent and readily accessible format for
                                        subsequent owners/occupiers. For more information on building log
  6	   Maintain good records            books see CIBSE TM31 Building Logbook Toolkit.


Better Metering Toolkit                 Home     |   Acknowledgements        |   Glossary                                 Print   Email        Contact us
48
  Introduction        Contents   Benefits    Meters       Systems          Using Data      Case Studies

                                                            British Land |   GE Capital Real Estate   | Land Securities | Transport for London


  6. Case Studies

                                                                                                     The following case studies showcase examples
                                                                                                     of where a number of BBP member organisations
                                                                                                     have installed new AMR metering systems into
                                                                                                     existing operational commercial buildings.

                                                                                                       Continue


                                                                                                     York House, British Land


Better Metering Toolkit               Home   |   Acknowledgements   |   Glossary                                                Print      Email        Contact us
49
  Introduction         Contents          Benefits            Meters      Systems           Using Data           Case Studies

                                                                           British Land |   GE Capital Real Estate   | Land Securities | Transport for London


  Implementation of AMR metering within                           The meters transmitted data at 15 minute intervals via a         The service provider also supplies a statement for each
  British Land’s Head Office                                      hard wired communication line direct to a central server         occupier’s energy bill which the managing agent then
                                                                  communication network in York House. The data is then            uses to produce an invoice for each occupier.
  In August 2009 British Land’s trialled an AMR metering
                                                                  transmitted from the server to their external service
  system at its Head Office, York House, which is situated                                                                         A significant benefit of the metering system is how it has
                                                                  provider, EPT via ADSL every four hours.
  in London’s West End. The building offers over 8,400m2                                                                           helped British Land engage with their occupiers. British Land
  of office space, of which British Land occupy 3,700m2.          The external service provider undertakes off-site data           uses metering data to individually review with each occupier
  An important aspect of the project was to learn from the        analysis to identify any issues/anomalies in the patterns of     their contribution to the overall energy use in the building,
  experience and assess the potential for a wider roll-out        energy consumption, and to indicate potential energy and         and to discuss how to make savings. Metering data is then
  across its property portfolio.                                  cost savings which can be made through appropriate energy        also used to demonstrate improvements and savings over
                                                                  efficiency measures which are then reported to the on-site       time. The AMR software is web-based and can be accessed
  The main aims of the AMR metering solution were to achieve
                                                                  building engineering team. With a detailed knowledge of what     by occupiers and owner alike on a shared license to
  more accurate utility billing and occupier on-selling, as
                                                                  equipment or BMS setting each sub-meter is measuring it is       provide real transparency and data sharing between the two.
  well as improving energy management to help reduce
                                                                  often possible for the service provider to indicate to British
  CO2 emissions from the building. As a result, British                                                                            Overall, British Land has invested approximately £65,000 in
                                                                  Land engineers which piece of equipment or BMS setting is
  Land developed a metering strategy which included the                                                                            installing the metering system, and there is an on-going cost
                                                                  causing a problem. Each month British Land receives report
  replacement of the main utility electricity meters and                                                                           of approximately £12,000 per year for maintenance of the
                                                                  which highlights the financial impact of actions completed, as
  installation of an additional 6 sub-meters, including the                                                                        metering and off-site analysis and reporting. This has helped
                                                                  well as providing an on-going record of outstanding actions.
  re-commissioning and connection of approximately 50                                                                              optimise the heating and cooling system (including prompt
                                                                  The offsite team also have a short teleconference each month
  sub-meters pre-existing sub-meters to an AMR systems.                                                                            identification of a broken sensor that had been causing
                                                                  with the site team to discuss the report and have technical
  The sub-metering comprised:                                                                                                      constant gas use for heating and re-programming of the
                                                                  discussion to consider solutions to more complex problems.
                                                                                                                                   Building Management System to introduce economy cycles
  •	  ub-metering of each occupier’s demise. This measures
     S
                                                                  Critically, the service provider guarantees a minimum amount     and new deadband set points for cooling). As a result, British
     the total amount of lighting and small power to each
                                                                  of cost savings in common parts and central heating and          Land saved £45,000 in the first year and expects to achieve
     occupier’s demise
                                                                  cooling plant. The service provider’s ‘top-up’ guarantee is      payback in 18-24 months.
  •	  ub-metering of common services: heating, ventilation
     S                                                            applied to York House as well as a number of other British
     and air-conditioning                                         Land buildings which relies on the offsite monitoring team
                                                                  finding enough operation savings through the process
  •	 Sub-metering of common parts: lighting and small power.
                                                                  described over a 3-5 year period to ensure that the building’s
  •	 n addition the system received gas and water data
     I                                                            consumption in these areas is reduced by approx 10%-12.5%
     through pulse pick-ups.                                      against a baseline year set before the service was introduced.


Better Metering Toolkit                          Home     |   Acknowledgements      |   Glossary                                                         Print         Email          Contact us
50
  Introduction           Contents           Benefits          Meters         Systems           Using Data           Case Studies

                                                                                British Land | GE Capital Real Estate | Land Securities | Transport for London


  Implementation of AMR metering at                                   half-hourly gas consumption data was then sent daily to their   Overall, the cost of implementing the AMR metering solution
  GE Capital Real Estate’s London HQ                                  external service provider, WSP, (who also provided the AMR      was around £1,000 and with no disruption to utility supplies.
                                                                      metering solution) using the mobile phone network (GSM).        There is an on-going fee of approximately £500 per year for
  In 2009, GE Capital Real Estate trialled the use of an
                                                                      A similar approach was also undertaken for water metering.      reports, on-line tools and alarm management.
  AMR metering system at its then London Headquarters,
                                                                      To assess electricity consumption the service provider was
  a 4,650 m2 office building in Berkeley Square, London.                                                                              Results show significant improvements in consumption.
                                                                      given permission to access the half-hourly electricity data
  An important aspect of the project was to learn from the                                                                            GE has reduced building electricity consumption by 16%,
                                                                      sent to the utility company.
  experience and assess the potential for a wider roll-out                                                                            gas consumption by 42% (and water consumption by
  across its property portfolio.                                      The external service provider supplies the half-hourly          74% through the installation of a waterless urinal system).
                                                                      electricity, gas (and water) data to GE’s building managers     Annual operating costs on the building have reduced by
  The implementation of AMR metering was inspired partly
                                                                      on a dedicated website on a day-plus-one basis, together        around £60,000. When all expenses for installing the system
  by a desire to reduce energy consumption and CO2 emissions
                                                                      with alarms, reporting and management tools. The                (including water metering) and taking corrective actions are
  and partly by compliance preparations for the incoming
                                                                      building managers use this information to ensure efficient      taken into account, they are paid back in little over one month.
  CRC Energy Efficiency Scheme. A decision was taken to
                                                                      management of the building and make any necessary
  focus only on the main utility meters as this was seen as                                                                           Since this initial successful trial, GE Capital Real Estate
                                                                      correction measures.
  providing the greatest value in terms of energy saving                                                                              is now rolling out this system to most of its multi-occupied
  potential and costs. It was also the option that could most         Initially, GE asked the external service provider’s energy      office portfolio.
  easily be rolled out across their portfolio if proved successful.   specialists to provide energy management advice. The
  Whilst this solution only provides a limited level of detail,       specialists analysed half hourly weekday and weekend
  i.e. data would not be able to be broken down to an individual      profiles for each of the utilities and advised on areas to
  floor level, there is the capacity to link the building’s sub-      investigate to cut waste and reduce consumption in the
  meters to the AMR system at a later date.                           building – especially out of hours. This was provided to
                                                                      GE’s building management team in a ‘remote analysis report’,
  The main electricity meter was already an AMR capable
                                                                      who then implemented changes to drive the reductions.
  meter, which logs and provides half-hourly consumption
                                                                      The changes were low cost, mainly adjustment and
  data to the utility company via a telephone line. The existing
                                                                      reprogramming of the Building Management System,
  gas meter had a simple dial display that needed to be read
                                                                      changes to temperature set-points and evening and weekend
  manually. However, like many modern gas meters it had a
                                                                      operating procedures. Visibility of the half-hourly data and
  pulsed output. By a simple wired connection from the pulsed
                                                                      knowing how much could be saved by changing equipment
  output to a small data logger and communication device,
                                                                      or operating practices was key to driving the changes.


Better Metering Toolkit                             Home      |   Acknowledgements      |   Glossary                                                        Print         Email          Contact us
51
  Introduction          Contents            Benefits          Meters         Systems            Using Data            Case Studies

                                                                                British Land |   GE Capital Real Estate   | Land Securities | Transport for London


  Implementation of an AMR metering strategy                          Data is transmitted externally from the meters via GSM to           3.	  and Securities has been able to improve the efficiency
                                                                                                                                              L
  for Land Securities’ portfolio of office buildings                  Land Securities’ meter operator. Overall, GSM transmission              and reduce wastage from the central services they also
                                                                      has proved to be a suitable mode of external transmission               manage. For example, the output of an AMR sub meter
  Land Securities own and manage offices buildings in London,
                                                                      and Land Securities have had few issues in achieving                    identified a significant load in an unoccupied building on
  and shopping centres and retail parks throughout the UK.
                                                                      adequate signal strength wherever meters have been                      a Sunday. This turned out to be a chiller incorrectly being
  Between 2009-10, Land Securities rolled out an AMR
                                                                      installed within their buildings. On occasions external                 started by the BMS, an energy wastage that could easily
  metering strategy across its office portfolio. The focus has
                                                                      antennas or GSM boosters have been required in areas                    be rectified.
  been offices as retailers tend to separately organise and
                                                                      such as switch-rooms in basements/sub-basements,
  manage their own electricity supplies.                                                                                                  Whilst a successful initiative, there were some common
                                                                      The data is collected by the meter operator and provides the        installation difficulties:
  The main drivers of the AMR metering solution were to achieve
                                                                      data to Land Securities on a daily basis (day+1). The PMS
  more accurate utility billing for occupier recharging, as well as                                                                       •	  any meters needed to be installed at weekends due to
                                                                                                                                             M
                                                                      transmits live data, but this is analysed as day+1 along with the
  improving energy management to help reduce CO2 emissions                                                                                   the need to stop electricity to the relevant distribution board
                                                                      metering data. Therefore, each day Land Securities receives
  across their portfolio. As a result, Land Securities developed a                                                                           for half an hour. In some cases, work had to be linked to
                                                                      for each meter, 48 half hourly data points, plus total energy
  metering strategy which included the replacement of the main                                                                               planned power outages six months to a year in advance.
                                                                      consumption for the 24 hour period. The data is accessed via
  utility meters and installation of sub-meters.                                                                                          •	  here was often a need to gain access to occupiers’ area
                                                                                                                                             T
                                                                      a web portal and entered by Land Securities into purchased
  Both electricity and gas main utility meters where replaced         aMT software. The software provides energy management                 to install the sub-meters which required permission from
  with AMR capable meters where necessary and AMR                     and reporting, and billing capability for occupiers.                   each occupier.
  electricity sub-metering was installed to measure energy                                                                                •	  ccasionally, there were space issues where the
                                                                                                                                             O
                                                                      Numerous benefits have been delivered through the
  consumption on each floor of the buildings. In addition,                                                                                   new meters were too large to fit in the original space.
                                                                      installation of the portfolio wide AMR metering strategy:
  meters are located to measure the different loads (e.g.                                                                                    This has resulted in extra work to fit the new meters.
  lighting, small power, air conditioning, communications room)       1.	  and Securities have been able to deliver more accurate
                                                                          L
                                                                                                                                          •	  ccasionally, additional changes were required during
                                                                                                                                             O
  depending on the arrangement of the existing distribution               and timely occupier billing. Previously, manual readings
                                                                                                                                             installation e.g. in one building a new distribution board
  boards. Large new developments have a Power Management                  had contained incorrect data due to human error.
                                                                                                                                             was needed due to health and safety reasons.
  System (PMS) which manages the electricity supplies in
                                                                      2.	  and Securities has a carbon reduction target of 30% over
                                                                          L
  buildings as well as providing AMR data. The PMS is there
                                                                          10 years. Engaging and working with their occupiers to
  to control the power demands in a building particularly when
                                                                          influence behavioural change is an important aspect of this
  it is needed to operate on a standby generator.
                                                                          and the use of half hourly data has provided occupiers with
                                                                          detailed feedback on their individual energy consumption.
                                                                          This information has shown that in a short-time, the
                                                                          occupiers can reduce energy use by 5-10%.


Better Metering Toolkit                             Home     |   Acknowledgements        |   Glossary                                                            Print          Email           Contact us
52
  Introduction           Contents           Benefits          Meters           Systems            Using Data            Case Studies

                                                                                 British Land |   GE Capital Real Estate   | Land Securities | Transport for London


  Implementation of AMR metering within                                on each floor also included WC ventilation. They addressed          communications to VOIP, as this appears to block this transfer
  Transport for London’s Cranbourn Street Office                       this by using small ‘din-rail’ meters mounted within each           of data, requiring separate BT PSTN phone line installations
                                                                       lighting distribution board to separately meter the relevant        at these VOIP sites.
  This case study outlines the approach that TfL has taken
                                                                       individual WC ventilation circuits. A set of carefully configured
  to AMR metering in their Cranbourn Street building. This is                                                                              The sub-metering data has assisted TfL to improve the
                                                                       ‘virtual’ meters in their aMT software then removes the WC
  part of a general roll-out of AMR metering in TfL’s portfolio                                                                            building’s DEC rating as it allows server room ‘separable’
                                                                       ventilation loads from the Lighting distribution board metering
  of commercial properties that started in 1996. The case study                                                                            electrical energy loads (equivalent to 18% of total electricity
                                                                       to provide actual on floor lighting usage reports, and adds
  also highlights challenges TfL have faced with their overall                                                                             consumption) to be removed from the benchmarking
                                                                       them to the Mechanical distribution board metering to provide
  metering solution and outlines the planned changes to                                                                                    calculation. The sub-metering data has also been used to
                                                                       actual on floor HVAC usage reports.
  overcome these.                                                                                                                          resolve HVAC control time scheduling issues and identify
                                                                       In a similar manner to TfL’s other buildings, the sub-meters        28% occupant small power base loads that allowed the
  Cranbourn Street is a five storey office block, with a floor
                                                                       are all connected together using standard data-cables. From         Building Manager to focus ‘Switch Off Communications’
  area of 2260m2, based in central London. Like most of TfL’s
                                                                       this they are connected to a modem, which is accessed via a         on the worst offenders (see chart on next page).
  buildings, it is solely occupied by TfL. The main electricity
                                                                       dialup modem facility in TfL’s energy management office and
  meter was originally already a half-hourly meter on their half-
                                                                       downloaded to a stand-alone server prior to weekly transfer to
  hourly supply contract with data sent to the utility company
                                                                       their networked aMT software which TfL use on a daily basis
  via a standard BT telephone connection. In 2006, TfL used
                                                                       to manage their energy use.
  the two spare input channels on the electricity meter to start
  recording half hourly gas and water data. This information           At this site a combination of sub-meters’ own in built
  was then fed into their central AMR system.                          memory and data loggers are used to store the last 35
                                                                       days of data allowing the central server to access at any
  In 2009, TfL installed 34 AMR sub-meters in the building.
                                                                       point during the 35 days with no data loss. However, the
  Typically, TfL separately sub-meter the central building
                                                                       server is programmed to dial up daily, with failed attempts
  services plant and the total consumption on each floor. As TfL
                                                                       checked weekly to highlight any communication or metering
  are owner-occupiers, a particular advantage of measuring
                                                                       maintenance issues. TfL currently also do a weekly manual
  consumption on each floor (e.g. from lighting and small power
                                                                       check of their AMR meter readings to check the accuracy of
  load) is that TfL has greater ability to use the information
                                                                       the data being automatically collected.
  directly to influence behavioural changes of their staff rather
  than if they were an owner with a separate occupier using the        The cost for TfL to set-up the sub-metering system was
  space. In this case, there were separate distribution boards         £19,000. The advantage of using telephone lines to transmit
  for small power, mechanical (fan coils) and lighting loads           the data is that the line rental is already paid as part of TfL’s
  on each floor, which TfL decided to separately sub-meter to          contract for internal communication between buildings.                Continue
  meet CIBSE TM39 recommendations on sub-metering. A                   However, TfL has recently uncovered a potential problem
  problem was identified in that the distribution board for lighting   with this approach during their phased upgrade of internal


Better Metering Toolkit                             Home      |   Acknowledgements        |   Glossary                                                            Print         Email           Contact us
53
  Introduction           Contents           Benefits          Meters                 Systems            Using Data        Case Studies

                                                                                        British Land |   GE Capital Real Estate   | Land Securities | Transport for London


  TfL is also in the process of changing its approach to data             •	  nly main utility meters will be manually read on a two
                                                                             O
  collection, storage and analysis across its portfolio of metered           weekly basis to fulfil major financial and environmental
  buildings. The key reasons for this are as follows:                        reporting requirements, while all AMR meters will be
                                                                             manually read on a 12 weekly basis to ensure AMR
  •	  fL’s IT network cannot be used for transmission of
     T                                                                       data is correct.
     metered data between buildings due to security risks.
     As a result, the central server is not allowed to sit on             Further information on TfL’s approach to energy metering is
     the TfL network. Consequently data has to be manually                provided as a case study in the Appendix of CIBSE TM39:
     transferred to the TfL networked aMT software which                 Building Energy Metering.
     is time consuming and can introduce human error.                                                                                                                   900
                                                                          Example half-hourly sub-metering analysis enabled by AMR installations
  •	 t takes significant time to process the data into an
     I                                                                                                                                                                  800

     appropriate format for use by the aMT software                           50
                                                                                                                                                                        700

  •	  he current 10-year old aMT software is inadequate for
     T                                                                                                                                                                  600

     TfL’s current needs (eg for accessing GSM modems at                       40                                                                                       500
     various sites)                                                                                                                                                     400
                                                                               30
  The new approach is as follows.                                                                                                                                       300
                                                                          kW


                                                                                                                                                                        200
  •	  data collection service will be responsible for capturing
     A                                                                         20
                                                                                                                                                                        100
     all metered data on a daily basis, reporting communication
     problems and generating weekly data files for TfL to import               10                                                                                            0
                                                                                                                                                                                  M               T             W
     into their dedicated aMT software. This aMT software
     package fully integrates the analysis and reporting of utility             0                                                                                       The troughs in the graph show the baseload of the
                                                                                                                                                                        by the building. This occurs overnight when the b
     meter and sub-meter AMR and manual readings data and                              M            T          W      T        F         S         S
                                                                                                                                                                        operating during normal working hours should hav
     invoice data.                                                                                                                                                      with 24/7 operated buildings having approx. 40%
                                                                                    Central Plant  other unmetered       Central Plant  other unmetered
                                                                                    loads during occupied hours           loads during unoccupied hours

                                                                                    Floor lighting  Small                Server Rooms and                                             Refrigeration

                                                                                    Power only                            associated cooling                                     Pumps  controls

                                                                                                                                                                                  Office equipment

                                                                                                                                                                                            Lighting

                                                                                                                                                                                      Humidification
                                                                     10

                                                                                                                                                                                           Hotwater
                                                                      9
Better Metering Toolkit                             Home      |   Acknowledgements
                                                                      8
                                                                                                |   Glossary                                                Print      Email               Contact us
                                                                                                                                                                                           Heating
54
  Introduction           Contents           Benefits          Meters           Systems            Using Data            Case Studies


  Glossary
  Automatic Metering Reading (AMR)/                                     Carbon Reduction Commitment (CRC Energy                           Display Energy Certificate (DEC)
  Advanced Meter                                                        Efficiency Scheme)                                                A certificate which shows the energy performance of a
  In addition to traditional metering functionality                     A UK-based carbon emissions trading scheme for large public       building based on its annual energy consumption and the
  (measuring and registering the amount of energy                       and private sector organisations. It is a mandatory scheme        associated CO2 emissions. This is shown as a rating from
  which passes through it), AMR or advanced meters                      which aims to both improve energy efficiency and regulate         A to G, where A has the lowest CO2 emissions (best) and
  are capable of one-way communication allowing                         the amount of greenhouse gases that are released from the         G the highest CO2 emissions (worst).
  them to transmit meter readings remotely.                             burning of fossil fuels by an organisation.
                                                                                                                                          Global System for Mobile Communications (GSM)
  Automatic Monitoring and Targeting                                    Check Meter                                                       A form of cellular wireless communication. GSM modems
  (aMT) software                                                       A meter required for validation purposes by comparing             are used to transmit metering data over long ranges external
  Software that collates and analyses data provided by AMR              readings against the main meter’s reading to ensure that          to the metered building. This may be to a data collection
  meters (both half-hourly and manual readings)  Utility               it is operating correctly. Check meters are required buildings    service or central storage point. Data is sent in the form of
  bills. aMT software can then be used to produce reports              with over 1MW electrical supply, the utility company provides     SMS messages.
  (including automatic ‘out of range’ reports) to enable building       both the main utility meter and a check meter.
  management to more effectively manage the energy use in                                                                                 Half-hourly Contracted Site
  a building.                                                           Corporate Social Responsibility (CSR)                             A site or building where an AMR main utility electricity meter
                                                                        A concept whereby companies integrate social and                  is a mandatory requirement by the utility company. This
  Building Management / Energy Manager                                  environmental concerns in their business operations and in        is required for a site or building where the average peak
  The person(s) responsible for the energy management                   their interaction with their stakeholders on a voluntary basis.   electricity demand over a three month period exceeds 100kW.
  of the building.
                                                                        Data Collection Service                                           Half-hourly Data
  Building Management System (BMS)                                      An external provider who collects AMR metering data on            The interval which metered data is typically sent from AMR
  A computer-based control system installed in a building               an owner or occupier’s behalf. They may also provide other        meters. This is also the interval at which utility companies
  which controls and monitors the building’s plant and systems          services such as designing and installing metering systems and    collect AMR data from main utility meters.
  such as HVAC, lighting and power systems. A BMS can be                analysing the collected data on an owner or occupier’s behalf.
  configured to receive half-hourly data from AMR meters and                                                                              HVAC
  used to analyse and report on performance to improve energy           Data Logger                                                       Heating, Ventilation and/or air conditioning plant in the
  management.                                                           An electronic device which stores half-hourly data readings       building. This is normally centrally provided and managed
                                                                        from AMR meters.                                                  by the building management for all occupied areas.


                                                                                                                                            Continue


Better Metering Toolkit                             Home      |     Acknowledgements       |   Glossary                                                         Print         Email          Contact us
55
  Introduction           Contents           Benefits          Meters          Systems            Using Data             Case Studies


  Glossary
  Main Utility ‘Fiscal’ Meter                                          Sub-meter
  A measuring instrument that records the quantity of electricity      Sub-meters are used to measure part of the energy load
  and gas (or water) supplied to a building. It is used by a utility   in the building. This may either by location based e.g. the
  company for billing purposes. A basic main utility meter allows      energy use of a floor or occupier, or energy load specific
  manual reads only, while AMR main utility meters provide             e.g. lighting or chillers A sub-meter can be manual-read
  automatic readings to a utility company at regular intervals         only or have AMR functionality.
  (typically half-hourly).
                                                                       ‘Virtual’ Meter
  Short Message Service (SMS)                                          The use of algebra to calculate the energy consumption of a
  A text communication service component of phone, web,                specific energy load which otherwise would have required an
  or mobile communication systems, using standardised                  ‘actual’ sub-meter. This form of metering is also known as
  communications protocols that allow the exchange or short            ‘in difference’ metering and is used when the total energy
  text messages between fixed line and mobile devises.                 supply and specific downstream sub-metering is used.
  Metering data from GSM modems are sent via SMS                       Actual sub-metering data is then subtracted from the total
  messages.                                                            with remainder being used to provide the ‘virtual’ meter reading.

  Smart Meter
  In addition to traditional metering functionality (measuring
  and registering the amount of energy which passes through
  it), smart meters are capable of two-way communication
  allowing them to transmit meter reads and receive data
  (e.g. tariff changes) remotely.


Better Metering Toolkit                             Home      |   Acknowledgements        |   Glossary                                     Print   Email        Contact us
56
  Introduction           Contents              Benefits    Meters       Systems          Using Data   Case Studies


  BBP Members


    The Building Centre
    26 Store Street
    London WC1E 7BT
    t:	 020 7580 0510
    e:	info@betterbuildingspartnership.co.uk
    www.betterbuildingspartnership.co.uk


Better Metering Toolkit                             Home   |   Acknowledgements   |   Glossary                       Print   Email        Contact us

BBP Better Metering Toolkit

  • 1.
    Better Metering Toolkit Aguide to improved energy management through better energy metering Enter Print Email Contact us
  • 2.
    2 Introduction Contents Benefits Meters Systems Using Data Case Studies Acknowledgements The Better Buildings Partnership (BBP) brings together a number of the largest commercial and public property owners in London in one collaborative organisation. All members are working together to improve the sustainability of London’s existing commercial building stock and accelerate the reduction in CO2 emissions from these buildings. Authors: David Ross Christopher Botten Keith Bugden Quinten Babcock AECOM BBP BBP Transport for London Working Group: Matt Webster Niall Tipping Simon Mendham Martin Russell Croucher British Land Grosvenor Land Securities RICS David Hodge Tatiana Bosteels Pippa Burchett Canary Wharf Group Hermes Real Estate Legal & General Property Hywel Davies Nick Hogg Siobhan Hewitt-Devine CIBSE Jones Lang LaSalle PRUPIM David Short Matthew Tippett Louise Ellison GE Captial Real Estate Jones Lang LaSalle Quintain Estates & Development The BBP also wishes to thank the following for their valuable contribution: Steve Irving Jennifer Eastman Percival Albuquerque AECOM Esight Energy PA Energy Brett Goodyear William Negus Andy Stanton EP&T Johnson Controls Transport for London The views expressed in this document are not necessarily those of either the individuals who provided input or their organisations. Copyright © 2011 BBP. All rights reserved. Better Metering Toolkit Home | Acknowledgements | Glossary Print Email Contact us
  • 3.
    3 Introduction Contents Benefits Meters Systems Using Data Case Studies Chairman’s Statement | Introduction Chairman’s Statement Commercial buildings are responsible for approximately one fifth of the However, the opportunities for confusion are significant. An increasing UK’s CO2 emissions, however the sector as a whole has historically number of suppliers offering a perplexing variety of different metering been profligate in its attitude to energy use. Such energy wastage systems, coupled with an understandably confusing variety of terms not only results in unnecessary cost to business, but is fundamentally such as ‘smart’, ‘AMR’, ‘advanced’, ‘sub’, ‘fiscal’ and ‘check’ meters, detrimental to the industry’s efforts to drive down CO2 emissions in creates potential for a disjointed industry approach to such a key area line with the government’s ambitious, but necessary reduction targets. of environmental management. Effective energy management is therefore an essential part of any sustainability strategy. The BBP, tasked with developing practical guidance on the subject, has produced this Toolkit. It sets out the metering options currently A critical first step in any energy management programme is the available for commercial buildings, considers the costs and benefits accurate measurement and monitoring of how much energy a building and provides advice on how metering data can be used to make uses. This is by no means an easy process and is an area which Better energy and cost reductions. Building Partnership (BBP) members find extremely challenging. I hope that this Toolkit provides a helpful guide for ‘non-technical’ Appropriate metering systems, installed so as to record consumption decision makers and supports both owners and occupiers when throughout a building, are able to provide owners and occupiers with engaging with metering system designers, suppliers and utility the information necessary in order to take the first steps towards companies in order to ensure that the most appropriate and improving the energy efficiency of their buildings. The property industry effective solutions are implemented in their buildings. is becoming increasingly interested in the use of metering systems given their many benefits, including the potential for energy, cost and CO2 savings, as well as the provision of data to support corporate reporting and compliance with increasing environmental legislation such as the CRC Energy Efficiency Scheme. The likely future mandatory roll-out of Display Energy Certificates to commercial buildings is an added driver. Quinten Babcock Chairman, Sustainability Benchmarking Working Group Better Metering Toolkit Home | Acknowledgements | Glossary Print Email Contact us
  • 4.
    4 Introduction Contents Benefits Meters Systems Using Data Case Studies Chairman’s Statement | Introduction 1. Introduction The UK Government has committed to a binding target of reducing carbon emissions by 80% relative to the 1990 levels by 2050. The absolute level of CO2 emissions has fallen less than 20% since 1990, and so substantial improvements will have to be made over the next 40 years if the target is to be met. Since 18% of national carbon emissions come from the operation of non-domestic buildings a significant reduction in the amount of energy we use to heat, cool and power buildings will be needed. As a significant proportion of the building stock that will exist in 2050 is already constructed, carbon emission reductions cannot just come from increasing the efficiency of new buildings. A substantial improvement in energy efficiency will be required from the whole sector – every building and every occupier of every building will have to contribute to delivering the necessary savings. Continue Better Metering Toolkit Home | Acknowledgements | Glossary Print Email Contact us
  • 5.
    5 Introduction Contents Benefits Meters Systems Using Data Case Studies Chairman’s Statement | Introduction EM1 EM2 Introduction Main Utility AMR meter AMR Sub-meter EM3 One of the biggest challenges to improving the energy AMR This Toolkit is about ‘better energy metering’, an approach This guide is designed to provide a better understanding Sub-meter efficiency of commercial buildings is a lack of performance that offers owners and occupiers energy consumption data of energy metering systems, and to inform decision-makers data. Owners and occupiers are generally unaware of how well VM1at a greater degree of detail than is provided for basic Virtual about the choices available when procuring and installing or badly their building is performing. It is often said that ‘if you Meter billing purposes. It allows building owners and occupiers to systems. Section 2: Benefits summarises the benefits of better can’t measure it, you can’t manage it’. An appropriate energy understand how, where and when energy is being used in their energy metering. A detailed description of the different types By metering whole building supply and sub-metering occupier and server room consumption, the remaining electricity used to power building services and metering system helps tackle this calculated using the formula above. This ‘virtual’building andreduces the need and cost for additional sub-metering of potentially HVAC loads can be issue by enabling owners meter therefore to identify and assess savings opportunities (see of meter is given in Section 3: Meters. Section 4: Systems multiple other supply cables. and occupiers to measure how much energy their buildings are Figure 1). However, it is important to note that better metering provides guidance on the current options available when consuming on a daily basis. This information can then be used does not guarantee savings. Rather it is a tool that enables selecting a better energy metering system, including some of to help deliver energy and cost saving opportunities. better understanding of where and how savings can be made. the costs and benefits. Section 5: Using Data then illustrates To achieve actual energy and cost savings, someone with the ways in which the information generated through better These opportunities fall into two distinct categories: the appropriate responsibility and authority to implement an metering can be used to improve energy efficiency. energy saving programme will be required. • mproved energy management: these are generally I no or low cost actions that better match the operation of the building services to the operational use of the Figure 1: Example weekly half hourly profile of electricity consumption building. Examples include making sure lighting, heating which can be produced through better metering of a commercial building and air conditioning is not being used when the building is un-occupied. 900 800 • nvestment in new or enhanced energy efficiency I 700 measures: these can have very short payback periods. 600 In addition, they often improve the comfort and satisfaction of the occupier, and there may be added value in terms 500 of attracting occupiers and increasing retention rates. 400 Choosing where to invest in energy efficiency measures 300 baseload and preparing the appropriate business case should be 200 The troughs in the graph show the baseload of the building – i.e. the minimum amount of electricity guided by an understanding of how and where energy is consumed by the building. This occurs overnight when the building is empty. An optimised standard 100 M T W T F S S occupancy building operating during normal working hours should have a baseload of between 10 used in a building. 0 consumption during occupied hours operated buildings having approx. 40% baseloads. hours and 15% of peak consumption, with 24/7 consumption during unoccupied M T W T F S S The troughs in the graph show the baseload of the building – i.e. the minimum amount of electricity consumed by the building. This occurs overnight when the building is empty. An optimised standard occupancy building operating during normal working hours should have a baseload of between 10 and 15% of peak consumption, with 24/7 operated buildings having approx. 40% baseloads. Better Metering Toolkit Home | Acknowledgements | Glossary Print Email Contact us
  • 6.
    6 Introduction Contents Benefits Meters Systems Using Data Case Studies Contents Acknowledgements 2 Technical Detail 24 1. Introduction 3 1 Metering 24 2 Data transmission to a central point 31 Chairman’s Statement 3 3 On-site data collection 33 Introduction 4 4 External transmission for off-site analysis 35 2. The benefits of better energy metering 7 5 Data storage 37 6 Data visualisation and analysis 39 2.1 Understanding the energy performance 8 of a building 5. Using Data 41 2.2 Reporting the energy performance of a building 9 1 Overview 42 2.3 Improving owner occupier relationships 11 2 Comparing a building with other, similar buildings 43 3. What is better energy metering? 12 3 Comparing how the demand for energy 44 varies with time service provision 3.1 Main Utility Meters 13 4 Comparing different areas of a building 45 3.2 Sub-meters 14 5 Comparing how the demand for energy 46 3.3 What better energy metering options are available? 16 varies with the weather 4. Choosing a better energy metering system 18 6 Maintain good records 47 Overview 19 6. Case Studies 48 AMR Schematic 20 British Land 49 GE Capital Real Estate 50 Cost Table 21 Land Securities 51 Transport for London 52 Glossary 54 Contact us 56 Better Metering Toolkit Home | Acknowledgements | Glossary Print Email Contact us
  • 7.
    7 Introduction Contents Benefits Meters Systems Using Data Case Studies 2. The benefits of better energy metering There are numerous benefits available to both owners and occupiers from installing better energy metering systems. These are summarised in this section under the following three headings: • nderstanding the energy performance U of a building • eporting the energy performance R of a building • mproving owner occupier relationships I Continue Better Metering Toolkit Home | Acknowledgements | Glossary Print Email Contact us
  • 8.
    8 Introduction Contents Benefits Meters Systems Using Data Case Studies Benefits 2.1 Understanding the energy performance of a building 2.1 Understanding the energy performance of a building Understanding when and where energy is being used is the first Reducing costs and most important step in reducing energy consumption. Most, Enhanced understanding of when and where energy is being used organisations rely on meter readings provided by the utility company 2.2 eporting the energy R through automated meter readings allows waste to be identified within their bills. However, utility companies typically manually read performance of a building and suitable corrective measures to be taken (see Section 5: Using the meters on an annual basis. Hence, monthly or quarterly bills will Data). This saving of energy leads to reductions in energy bills and 3.3 Improving owner be produced on the basis of estimated usage, which may not be an carbon emissions. It is for this reason that better energy metering occupier relationships accurate reflection of actual usage, especially if there has been a systems are seen by Government as an important tool in reducing change in activity in part of the building. UK carbon emissions. It is anticipated that certain types of meters Better metering can provide more timely and detailed information will be required by law for all buildings over time. Further details on on how energy is being used in a building. It does this by: the regulatory requirements of different types of meters are provided in Section 3: Meters. • roviding measurements on the amount of energy used during P each half-hour period. This enables users to understand how Bill validation and tariff selection energy demand varies through the day, and can provide instant Automated meter readings allow owners and occupiers to cross check feedback on performance. that they are being billed correctly. For example, billing errors can • roviding a disaggregation of the energy demand into its different P result from inaccurate manual meter readings by the utility company. end uses, such as lighting and small power for individual occupiers, Utility companies are also very interested in managing their supply and major plant items such as chillers etc. This is achieved through network, and balancing supply and demand. With a detailed sub-metering and gives a much enhanced understanding of the understanding of the energy demand profiles of a building, it may patterns of energy demand within a building. be possible to negotiate a more beneficial tariff. • roviding automated reading and logging of meters. If this is P linked into a suitable energy management system, then the data Maintenance contract fees can be analysed and automated reports prepared. Automated meter readings can reduce facilities management costs in a building where regular manual readings take place by reducing • hecking actual consumption against expected profiles and C the requirement for manual meter inspections. Finding, recording and providing ‘out of range’ alarms to warn building management consolidating meter readings, especially in a large building, can be a that corrective action may be required. time consuming exercise. Automating the meter readings can eliminate this task, and also improve the accuracy of data that is recorded. This saving alone can often pay for the cost of installing the improved metering. However, it is prudent to undertake manual readings in the initial period after installation to validate that the automated system is operating correctly and then occasional readings (e.g. twice per year) to confirm the system is still reporting accurately. Better Metering Toolkit Home | Acknowledgements | Glossary Print Email Contact us
  • 9.
    9 Introduction Contents Benefits Meters Systems Using Data Case Studies Benefits 2.2 Reporting the energy performance of a building 2.1 Understanding the energy performance of a building Corporate Social Responsibility (CSR) reports Public perceptions of owner’s and occupier’s commitment to effective energy management will be influenced by their building’s DEC rating. Given the increasing public concern over environmental issues, there Better metering will help owners and occupiers obtain good quality 2.2 Reporting the energy is growing moral and indeed legal pressure to report environmental data that can help improve the energy rating, both through discounting performance of a building performance. Corporate social responsibility demands that building defined ‘separable’ energy uses (e.g. through sub-metering of owners and occupiers understand the environmental impact of their 2.3 Improving owner regional server rooms or trading floors in offices) and improved energy business activities and take active steps to reduce it. Energy use and occupier relationships management. It will also assist building management to prioritise the consequent carbon emissions rank high on the environmental agenda, list of recommended energy efficiency improvements identified by the and so understanding and managing energy consumption should be a assessor who produces the certificate. key part of the management function in every responsible business. Figure 2: Example of a DEC certificate The classic environmental management cycle is: • Measure and report current performance. • Compare that performance against appropriate benchmarks. • dentify areas of improvement and implement an action plan. I • Measure the success of the implementation plan. • Repeat the cycle. Better metering can support these objectives, as part of a suite of environmental reporting initiatives. The range of environmental reporting possibilities is diverse, from an internal report to senior management through to initiatives such as the Carbon Disclosure Project (CDP). Display Energy Certificates The public display of Display Energy Certificates (DECs) is now a legal requirement in public buildings over 1,000m2 and is likely to be rolled out to the commercial property sector following the publication of the government’s Carbon Plan. A DEC includes an energy rating, which indicates how well the building is performing compared to its peers, and how energy performance is changing with time (see Figure 2). Continue Better Metering Toolkit Home | Acknowledgements | Glossary Print Email Contact us
  • 10.
    10 Introduction Contents Benefits Meters Systems Using Data Case Studies Benefits 2.2 Reporting the energy performance of a building (continued) 2.1 Understanding the energy performance of a building CRC Energy Efficiency Scheme Figure 3: Example four weekly league table of out of hours energy consumption at Transport for London’s Windsor House The introduction of the Carbon Reduction Commitment Energy 2.2 Reporting the energy Efficiency Scheme for organisations using more than 6,000MWh % Out performance of a building of electricity per annum is a further incentive to have accurate Group Name of hours Cost % Change and timely energy consumption data. The government is currently 2.3 Improving owner consulting on the operation and design of the scheme. Ultimately, 6th Floor 32% £101 4% occupier relationships it is expected to increase the cost of energy consumption and thus 13th Floor 32% £80 9% encourage energy efficiency. 7th Floor 37% £140 -7% Influencing behavioural change 8th Floor 37% £128 -6% As well as reporting up the management chain, the reporting of energy 5th Floor 38% £122 0% performance is a powerful motivational tool that can influence the 10th Floor 40% £147 2% behaviour of all staff. For example, publishing league tables highlighting 15th Floor 40% £121 -4% the out-of-hours energy consumption on different floors of a building can encourage the switching off of equipment at the end of the working day. 17th Floor 40% £122 7% Figure 3, supplied by Transport for London, illustrates the percentage of 9th Floor 41% £155 0% energy consumption out of hours (from 19.00-07:00 Mon-Fri and all day 11th Floor 41% £147 1% Sat-Sun) at Windsor House, which they use to stimulate behavioural change among employees. In addition, the use of an energy 14th Floor 41% £113 4% dashboard (a visual display of energy consumption e.g. TV screens 12th Floor 42% £154 2% or online portal) can help to effectively present energy savings data 16th Floor 42% £147 5% to company staff, management and visitors. An example of an energy dashboard can be viewed on the Department of Energy and Climate 18th Floor 44% £116 12% Change Homepage. Ground Floor 48% £19 -34% 3rd Floor 53% £108 -7% 4th Floor 53% £150 8% 1st Floor 65% £13 41% Better Metering Toolkit Home | Acknowledgements | Glossary Print Email Contact us
  • 11.
    11 Introduction Contents Benefits Meters Systems Using Data Case Studies Benefits 2.3 Improving owner occupier relationships 2.1 Understanding the energy Better metering can deliver improved customer service to occupiers. performance of a building Currently, many occupiers’ bills are simply estimated as a proportion of the total energy bill for the building e.g. pro-rated by occupied floor 2.2 eporting the energy R area. Better metering systems enable a more accurate measurement performance of a building of energy use by each occupier. It allows owners to itemise actual 2.3 Improving owner energy consumption in the service charge, which results in fairer billing occupier relationships and reduced complaints as to the accuracy of bills. Furthermore, because occupiers will then be paying for the energy they actually use, they will have a direct incentive to engage in energy reduction measures within their occupied area. Offering occupiers a better managed building with a lower total cost of occupancy, and moreover one which aligns with their own carbon reduction and sustainability commitments, can be an attractive proposition. Owners benefit too, because the approach provides an opportunity to increase retention rates and to reduce building obsolescence. The LES-TER initiative (landlord’s energy statement and tenant’s energy review) provides a tool for recording, benchmarking and sharing owner and occupier energy consumption data. Further information on improving owner occupier relationships can be found in the BBP Green Building Management Toolkit. Better Metering Toolkit Home | Acknowledgements | Glossary Print Email Contact us
  • 12.
    12 Introduction Contents Benefits Meters Systems Using Data Case Studies 3. What is better energy metering? This section defines the types of meters that are likely to be present in a building and the options available for better metering which can be installed, covering: • ain utility meters M • ub-meters S • MR, Advanced and Smart meters A Continue Better Metering Toolkit Home | Acknowledgements | Glossary Print Email Contact us
  • 13.
    13 Introduction Contents Benefits Meters Systems Using Data Case Studies Meters 3.1 Main Utility Meters 3.1 Main Utility Meters Many commercial buildings (particularly ones constructed pre-2002 Part L Building Regulations) will only have basic energy metering BOX 1 3.2 Sub-meters comprising main utility meters (also known as ‘fiscal’ meters): one Check meters 3.3 What better energy metering each for gas and electricity (see Figure 4 and 5). These are usually located at the point of entry of the supply to the building and are used For buildings with over 1MW electrical supply, the utility company options are available? by the utility company for billing purposes. These meters are very provides both the main utility meter and a ‘check’ meter. The basic and are similar to those used in domestic buildings. Customers check meter is required for validation purposes and its reading typically receive a monthly or quarterly bill that provides the cumulative is compared against the main meter’s reading to ensure that it is energy consumption since the last bill. In many cases, the bill will be operating correctly. The term ‘check’ meter is also often used to based on estimated energy use unless manual (or automatic) meter describe any ‘unofficial’ sub-meter used to compare against any readings have taken place. main utility or sub-meter. These meters provide limited information with which to manage the energy consumption and cost in a building. The energy data can be used to assess the relative energy performance of a building by benchmarking it against similar data from other buildings of a similar type. However, it does not provide information on how, when or where energy is consumed within a building, which makes it difficult to establish why energy performance may be poor and how to improve it. Figure 4: Main electricity meter Figure 5: Main gas meter Better Metering Toolkit Home | Acknowledgements | Glossary Print Email Contact us
  • 14.
    14 Introduction Contents Benefits Meters Systems Using Data Case Studies Meters 3.2 Sub-meters 3.1 Main Utility Meters What is sub-metering Developing a sub-metering strategy 3.2 Sub-meters Sub-metering is used to measure part of the energy load in a A clear sub-metering strategy is an important tool in ensuring costs are building. Depending on the overall metering aims, sub-metering minimised when installing a sub-metering system. Some best practise 3.3 What better energy metering is likely to include a combination of both location based and energy principles include: options are available? load specific measurements. 1. Use what sub-meters are already installed and upgrade where • ocation based: Sub-metering may be installed to separately L necessary measure the energy use of each floor or occupier. Such sub- 2 M . inimise the number of sub-meters to install by using ‘virtual’ metering helps the building owner determine an occupier’s consumption to fairly assign their part of the bill. meters. See Figure 7 as an example 3 A . ssess the opportunities to install gas, water, heat and coolth • nergy load specific: Sub-metering may be installed for different E sub-meters rather than just electricity energy loads to measure their consumption (e.g. lighting, power, 4. Use the existing Building Management System to collect metering heating and cooling energy). This helps both building owners data where feasible and occupiers to better manage their energy consumption 5. Always look to improve the sub-metering capacity when undertaking (see Figure 6). a refurbishment or an extension to an existing building, or For many buildings, there will be no overall sub-metering strategy to embarking on major HVAC plant renovation/replacement fully understand a building’s energy use. Although sub-meters may have 6. Produce a clear metering schematic which is kept up to date been installed, the infrastructure required to automatically read and collect the data may not be in place. Therefore, the first stage of any See CIBSE TM39 for in-depth details on how to design, implement metering strategy should be an audit of each existing meter to document and document sub-metering strategies. the location, function, type and data collection facilities available. Figure 6: Lift sub-meter Figure 7: Example of ‘virtual’ metering Whole building EM1 EM2 Occupier riser electrical supply for analysis of floor lighting and power loads Main Utility AMR electicity supply AMR meter Sub-meter ‘Virtual Meter’ EM3 Regional server room electrical supply for analysis of baseloads and DEC separables AMR calculation Sub-meter VM1=EM1-EM2- EM3 VM1 All other electrical supplies for analysis of building services HVAC plant loads Virtual Meter By metering whole building supply and sub-metering occupier and server room consumption, the remaining electricity used to power building services and HVAC loads can be calculated using the formula above. This ‘virtual’ meter therefore reduces the need and cost for additional sub-metering of potentially Continue multiple other supply cables. Better Metering Toolkit Home | Acknowledgements | Glossary Print Email Contact us
  • 15.
    15 Introduction Contents Benefits Meters Systems Using Data Case Studies Meters 3.2 Sub-meters (continued) 3.1 Main Utility Meters Regulations 3.2 Sub-meters The provision of sub-metering is also part of the guidance on ways of satisfying Part L of the Building Regulations: 3.3 What better energy metering • Sub-metering within new buildings was introduced in Part L 2002. options are available? • ub-metering of building services provided as part of the work to S existing buildings was introduced in Part L 2006. • ince 2006, for buildings which have a floor area greater than S 1000m2, sub-metering should be capable of automatic data reading and collection. Reasonable provision to comply with Part L is to install metering that enables at least 90% of the energy consumption for each energy Figure 8: Gas sub-meter for a Combined Heat and Power type (electricity and gas) to be assigned to its various end uses (CHP) engine (e.g. heating, lighting etc.) (see Figure 8). Heat and coolth sub-meters In addition to typical electricity and gas sub-metering, heat and coolth sub-metering can be used to apportion the energy supplied from central heating and cooling systems to the occupiers in a building (see Figure 9). • Heat’ sub-meters can separately measure the hot water flow ‘ from a central heating system to each occupier and estimate their energy use. • Coolth’ sub-meters can be used to separately measure the cold ‘ water flow from a central chilled water air conditioning system to each occupier and estimate their energy use. This type of metering is particularly relevant where there is a disproportionate use of heating or cooling amongst the different occupiers in a building e.g. where there is a large data centre, or Figure 9: Heat and coolth sub-meter 24/7 trading floors. Occupiers can be supplied with more accurate and fairer billing, resulting in fewer complaints and a greater incentive to engage in energy reduction initiatives. Better Metering Toolkit Home | Acknowledgements | Glossary Print Email Contact us
  • 16.
    16 Introduction Contents Benefits Meters Systems Using Data Case Studies Meters 3.3 What better energy metering options are available? 3.1 Main Utility Meters Better energy meters are available which provide more useful Regulatory requirements information on the energy consumption in a building. The 3.2 Sub-meters AMR metering is mandatory for large users of energy, as follows: most common names for these meters are ‘advanced meters’, 3.3 What better energy metering ‘automatic meter reading (AMR)’ and ‘smart meters’. • lectricity: AMR meters which provide half-hourly interval E options are available? consumption data are required in situations where the average Automatic meter reading (AMR) or peak electricity demand over the three months of highest ‘advanced’ metering consumption within a year exceeds 100kW. What is AMR/advanced metering • as: Daily AMR meters are required where gas is supplied to G AMR technology provides the ability to read a meter remotely, sites where the annual consumption level is 58,600MWh or more. automatically and at frequent intervals. Such meters are also often By 6th April 2014, the following buildings must also have AMR metering. termed ‘advanced’. The technology is applicable to both main utility meters and sub-meters. It is important to note that existing meters can • lectricity: Non-domestic premises which fall into electricity tarriff E either be replaced with new AMR capable meters or retrofitted with profile classes 5, 6, 7 and 8. AMR technology (see Section 4: Systems) for more details. • as: Non-domestic premises with an annual consumption G AMR capable main utility meters allow a utility company to remotely of more than 732MWh. access energy consumption data. Energy readings are typically F or further information see Department of Energy and recorded on a half-hourly basis, providing much more accurate Climate Change. and ‘up to date’ energy usage data (than available through monthly or quarterly bills). This type of meter also reduces the need for AMR sub-meters manual readings and provides the client access to the information AMR capable sub-meters operate in much the same way as AMR e.g. via internet ‘portals’. main utility meters. They provide more accurate and ‘up-to-date’ energy consumption data for a sub-meter which measures a specific location or energy load – storing and transmitting readings typically on a half-hourly basis. Data for these meters is not transmitted to a utility company but is used by building management where performance can by analysed to ensure efficient operation and identify energy reduction opportunities (See Section 5: Using Data for more information). Continue Better Metering Toolkit Home | Acknowledgements | Glossary Print Email Contact us
  • 17.
    17 Introduction Contents Benefits Meters Systems Using Data Case Studies Meters 3.3 What better energy metering options are available? (continued) 3.1 Main Utility Meters ‘Smart’ metering Common misconceptions 3.2 Sub-meters What is a smart meter? Within the property industry there is some confusion over the term ‘smart meter’. It is often used by trade press, equipment suppliers A ‘smart’ meter allows the utility company to both remotely read and 3.3 What better energy metering instruct the meter. It therefore provides two-way communication and others to cover all types of intelligent energy meters, including options are available? whereas advanced/AMR meters only allow one-way communication. AMR meters and energy display devices. This additional functionality (of a utility company being able to instruct In the UK, the government has committed to roll-out of smart electricity the meter) allows a number of additional operations, which include: and gas fiscal meters to all households and smaller non-domestic premises by 2019. A Smart Metering Prospectus jointly published by • updating metering software . DECC and Ofgem in July 2010 set out proposals on the key elements • changing the read frequency. of a smart metering roll-out. A Response to the Consultation was released in March 2010 which sets out the government’s conclusions • emotely controlling an agreed portion of a customer’s consumption r on how the smart metering roll-out will be organised and regulated in order to help balance grid electrical generation and demand. and provides details on the high-level functionalities and technical • pdating the metering tariff. u specifications of a smart meter. The planned roll-out is expected to • terminating energy use in the event of non-payment. start in 2014, however, for smaller non-domestic buildings where AMR metering has previously been installed, these meters will not need to be replaced with smart meters. No proposals have currently been outlined regarding requirements for larger commercial buildings. Better Metering Toolkit Home | Acknowledgements | Glossary Print Email Contact us
  • 18.
    18 Introduction Contents Benefits Meters Systems Using Data Case Studies Overview | AMR Schematic | Cost Table | Technical Detail 4. Choosing a better energy metering system This section provides guidance on the separate components of an AMR metering system. It is not intended to be a fully comprehensive guide and the reader may need additional technical support when selecting the most appropriate system for their building(s). However, this section will help when engaging with system designers, meter system suppliers and utility companies. It outlines the key decisions to be made and the main advantages and disadvantages of options available in the UK today. Continue Better Metering Toolkit Home | Acknowledgements | Glossary Print Email Contact us
  • 19.
    19 Introduction Contents Benefits Meters Systems Using Data Case Studies Overview | AMR Schematic | Cost Table | Technical Detail Overview It should be noted that while this section is written principally for a non- 4. External transmission for off-site analysis BOX 2 technical audience it does provide same detail over and above that In many cases, metering data is transmitted externally from the which a non-technical reader may wish to know. The Enhanced Capital metered building for central storage. This allows data from a portfolio of buildings to be easily compared and analysed. Allowance Scheme Estimated costs of various options are provided (see Cost Table), but it must be emphasised that the costs are illustrative only – actual outturn The Enhanced Capital Allowance 5. Data storage costs will depend on a number of factors including client needs, the (ECA) scheme helps reduce the layout of the building, the potential to use existing infrastructure and The transmitted data is centrally captured and stored. costs of investing in AMR metering the ease of installing the new system. systems. It provides tax relief for a 6. Data visualisation and analysis range of specified energy saving A general schematic of an AMR metering system and its associated The data is analysed using automatic Monitoring Targeting (aMT) technologies, including (Automatic benefits is provided (see AMR Schematic). The schematic comprises software. It is this element that is vital in developing an understanding Monitoring and Targeting (aMT) a number of key components. These are summarised below and are of how energy is being used in a building. The data itself has little systems). This includes the meters, dealt with in more detail later in this section: (see Technical Detail) value; it is the analysis of the data that leads to understanding, the meter reading system and the which can then drive positive action. analytical software. The tax relief is 1. Metering not granted on software when using This includes the main utility meters and any sub-metering. The meters 7. Energy management an external service provider, although measure the amount of electricity and gas passing through them. Some tax relief can still be gained on the As well as procuring the hardware, it is essential to appoint someone meters will incorporate memory storage capacity to record half-hourly to be responsible for the energy management of a building. They other components of the system. energy consumption. Other meters will only have the capacity to Further details can be found from need to review the information provided by the data analysis and then produce half-hourly ‘pulses’ related to the units of consumption. take the necessary action to make appropriate savings. Arguably, ECA’s web-site: www.eca.gov.uk the energy manager is the most important part of the system, and As an example, through the ECA 2. Transmission to a central point appointing someone with the appropriate skills and authority should scheme, Transport for London The half-hourly data needs to be transmitted over a communications be an integral part of the process. (TfL) received a rebate of 19% of network from the meter to a central point for aggregation / consolidation. their costs for metering and aMT Continue software systems for their Palestra 3. On-site data collection building in Southwark. Data loggers or a central data server can provide this aggregation / consolidation function by storing readings from the various meters within the building. This stage is not necessarily required if all data storage and analysis is being carried out off site. Better Metering Toolkit Home | Acknowledgements | Glossary Print Email Contact us
  • 20.
    20 Introduction Contents Benefits Meters Systems Using Data Case Studies Overview | AMR Schematic | Cost Table | Technical Detail AMR Schematic General schematic of an AMR metering system and its associated benefits 1 2 3 4 5 6 7 Transmission to On-site data External transmission Data Data visualisation Energy Metering a central point collection for off-site analysis storage and analysis management Benefits Reduction Low carbon projects retrofits prioritisation Data for main utility Chatterbox/relay/ meters only Communication optical reader Benchmarking to occupiers / staff Data collector Gas DECs/CRC CSR reporting Electricity Bills Tariff analysis Data Loggers External Utility providers Energy Water and contract or Central Server Transmitter database Manager negotiations Heat Bill validation Portal financial reporting budgeting Coolth Main sub- meter analysis Data transmitted Building directly from aMT management meters database made aware of issues Data for Automatic all meters alarms Better Metering Toolkit Home | Acknowledgements | Glossary Print Email Contact us
  • 21.
    21 Introduction Contents Benefits Meters Systems Using Data Case Studies Overview | AMR Schematic | Cost Table | Technical Detail Cost Table Component Option Initial cost On-going cost Comments (capital + installation) Meter Enabling existing main utility £100-£500 per meter See relevant box below for AMR meter installing a new main electricity or gas AMR meter Installing a new main £300-£500 per meter Meter maintenance costs typically Initial costs assume that there are electricity AMR meter met by the meter operator. Their existing current transformers in data collection and support costs electrical switch gear panels would be £50-340 per annum depending on external transmission method Installing a new main gas £600-£5000+ per meter Meter maintenance costs typically Initial cost example: fitting a new AMR meter met by the meter asset manager. 80mm rotary meter including new Their data collection and support pipe work will be £3,000 - £3,500, costs would be £50-180 per but in existing metering pipe work annum depending on external it would be £2,000. Then add £800 transmission method for provision of gas logger and ancillaries. The higher costs of data collection may include some elements of external analysis. Initial costs can potentially be free if utility provider can take over meter asset manager role from national grid, but this will tie the client to their data collection contract Retrofitting a gas or electricity £300-£600 per meter See relevant main utility or meter sub-meter costs as appropriate Installing an electricity or gas £200-400 per electricity sub-meter See data collection and storage Initial costs assume that there are AMR sub-meter £600-2,000 per gas sub-meter existing current transformers in electrical switch gear panels Continue Better Metering Toolkit Home | Acknowledgements | Glossary Print Email Contact us
  • 22.
    22 Introduction Contents Benefits Meters Systems Using Data Case Studies Overview | AMR Schematic | Cost Table | Technical Detail Cost Table (continued) Component Option Initial cost On-going cost Comments (capital + installation) Internal transmission Hard-wire £60 per 100 metre of cable See data collection and storage This is the capital cost of the cable. The installation costs should be small during a refurbishment but potentially prohibitively expensive during other times Wireless £175-300 per meter See data collection and storage Installation costs not included On-site data collection Bespoke data-logger £30-50 per meter channel, See data collection and storage stand alone GSM data logger equipment cost £600 BMS (already present) £600 per day for commissioning See data collection and storage It should be possible to commission up to 10-20 meters per day if located in close proximity Data Server £1,000-2,000, plus £600 per See data collection and storage It should be possible to day for commissioning commission up to 10-20 meters per day if located in close proximity External transmission Cellular wireless transmitter £100-300 per meter £35-50 per annum On-going costs are for data transmission only Landline £150-200 per landline £150-£200 per year On-going costs are for data transmission only Continue Better Metering Toolkit Home | Acknowledgements | Glossary Print Email Contact us
  • 23.
    23 Introduction Contents Benefits Meters Systems Using Data Case Studies Overview | AMR Schematic | Cost Table | Technical Detail Cost Table (continued) Component Option Initial cost On-going cost Comments (capital + installation) Data collection and storage Data collection by third party (i) £20-50 per meter per year On-going costs are for for daily data transmission data collection only (ii) £10-20 per meter per year for weekly data transmission Self-collection £0-180 per year On-going costs depend on transmission solution (e.g. Ethernet vs. phone line costs) Data visualisation and analysis aMT software £2,000-£50,000 Yearly license and maintenance Cost will depend on functionality typically 12.5% of original required from software acquisition cost External analysis £100-200 per meter per year Costs assume basic consumption reporting and alerts. The external provider may provide additional services such as acting as a virtual energy manager Better Metering Toolkit Home | Acknowledgements | Glossary Print Email Contact us
  • 24.
    24 Introduction Contents Benefits Meters Systems Using Data Case Studies Overview | AMR Schematic | Cost Table | Technical Detail Detail 1. Metering 1 Metering The first component in the system is the meter, which measures the Electricity meter with enabled AMR capability amount of energy being consumed. This section discusses the key 2 Data transmission to a If the existing meter already has enabled AMR capability, the data will decisions necessary in procuring: already be automatically collected and transmitted to a utility company central point for billing purposes at half-hourly intervals. If so, there is no need for any • main utility meters to measure the total energy use in a building 3 On-site data collection changes to be made to the meter. All that is required is to gain access to • ub-meters to measure energy used by specific areas of the s the data. There are three options for obtaining the data: 4 External transmission building or particular end-uses (e.g. the chiller). for off-site analysis • equest that the utility company provides the data, either by R Main Utility Electricity Meters providing access via a web-portal, or by emailing the data. 5 Data storage Every building will already have a main utility electricity meter (see • ppoint a licensed Data Collector to collect the metering A Figure 10). It is necessary to check whether it is a half-hourly capable data for both the utility company and the owner / occupier 6 Data visualisation and analysis meter (i.e. has AMR capability). If not, the meter will need to be either (see Data Storage). replaced or retrofitted to provide AMR capability. The three typical • equest that the utility company fit a Customer Access Terminal R scenarios are discussed below. box (‘CAT box’) to enable access to the data feed for an onsite data logger or central server. Electricity meter with un-enabled AMR capability The meter may have the capability of producing half hourly data but it is not currently being remotely accessed for billing purposes. In this instance, retrieving data from the meter should be relatively straightforward by either: • Installing an external transmitter direct to the meter • equesting that the utility company fit a ‘CAT box’ to enable access R to the data feed for collection by a data logger or central server. The cost will typically range from £100 to £500 depending on what type of device is fitted. Continue Figure 10: Main electricity meter Better Metering Toolkit Home | Acknowledgements | Glossary Print Email Contact us
  • 25.
    25 Introduction Contents Benefits Meters Systems Using Data Case Studies Overview | AMR Schematic | Cost Table | Technical Detail Detail 1. Metering (continued) 1 Metering Non-AMR capable electricity meter The cost for the supply and fitting of a meter is around £300-£500 per meter. This is likely to be higher if installed outside of normal working hours. 2 Data transmission to a If the current electricity meter does not have AMR capability central point (see Figure 11), in order to automatically collect meter readings, An alternative solution which does not involve shutting down the the meter must either be replaced or retrofitted. electricity supply of the building is to install a new AMR ‘sub’ meter just 3 On-site data collection downstream of the main utility meter, using split current transformers Replacing a non-AMR capable electricity meter (CTs) clamped around the mains supply. This provides the same 4 External transmission If choosing to replace a meter, one option is to contact the utility information as if the main utility meter was AMR capable (i.e. total for off-site analysis company to request that the meter be upgraded. The upgrade might energy consumption in the building) but instead there is simply an be provided by the utility company at no charge, but if not, they will additional AMR capable meter alongside. 5 Data storage usually agree that the meter be replaced at the organisation’s cost, subject to using a licensed meter operator (who is responsible for Retrofitting a non-AMR capable electricity meter 6 Data visualisation and analysis installing and maintaining electricity meters). Rather than replacing the existing meter, it can be modified to allow For further information on the key players within the electricity and AMR capability. The key component is a reading device to transform gas markets and their respective rules see Carbon Trust CTV027. the analogue meter reading to a data output which expresses energy consumption on a half hourly basis. For example, an optical reader The main advantages of replacing the meter are that the newly- can be fixed to the front of the existing meter which ‘watches’ the installed meter will be designed for AMR-use, be based on latest rotation of the meter dials and converts this information into data technology and have greater functionality. outputs (see Figure 13). The main disadvantage of replacing the meter is that there may The main advantage of this option is that it is simpler to install than need to be a total or partial electricity shutdown of the building replacing the meter and does not require a building shut down. which can raise several issues: However, the cost can be similar to replacing the existing meter (around £300-£600 per meter) when allowance is made for • lanning an electrical shut-down for, e.g. a commercial office P commissioning the retrofitted meter. building is a complex process and may involve shutting down occupier’s server rooms (which may be serving a wider national The disadvantage of retrofitting is that many older meters do not have or international area) and other plant. This may often need to be bespoke optical readers available on the market and therefore generic undertaken outside of normal working hours, which raises both ones need to be attached, often using glue or sticky tape. This can the cost and complexity of planning involved. lead to reliability problems e.g. the reading device can come loose or knocked out of place (particularly when manually read by the utility • nce equipment is turned off, it may not start again. This could O Figure 11: Non-AMR meter provider). This is likely to result in the loss of data and the additional happen, for example, with services which are approaching the expense of re-commissioning the system. end of their life. Continue Better Metering Toolkit Home | Acknowledgements | Glossary Print Email Contact us
  • 26.
    26 Introduction Contents Benefits Meters Systems Using Data Case Studies Overview | AMR Schematic | Cost Table | Technical Detail Detail 1. Metering (continued) 1 Metering Main Utility Gas Meters 2 Data transmission to a As with main utility electricity meters, the first thing to check is central point whether the current main gas meter (see Figure 12 is being remotely read by the utility company. This will typically not be the case for a small 3 On-site data collection to medium-sized commercial building due to its relatively small energy demand compared to the current mandatory requirements for an AMR 4 External transmission meter. In this situation, the meter will need to be either replaced or for off-site analysis retrofitted to provide AMR capability. The three typical scenarios 5 Data storage are discussed below. Gas meter with enabled AMR capability 6 Data visualisation and analysis In this case, a meter may be installed where the data is already being automatically collected and transmitted to the utility company. However it will probably be recording daily or monthly totals only BOX 3 (not half-hourly). Whilst useful for billing purposes, it is far less useful Figure 12: Main gas meter Gas safety issues for energy management. If the utility company is not prepared to provide the data direct on a half-hourly basis then a pulsed repeat - It is important to note that to obtain termed Meter Pulse replication Unit (MPU) - can be requested instead half-hourly data from a gas meter for connection and collection of data by an on-site data logger or it must not be connected directly central server. The cost of supplying and fitting such a device is in to an electrical supply for safety the order of £400. reasons. Therefore, a battery powered pulse relay switch (often called a Gas meter with un-enabled AMR capability ‘chatterbox’), or an optical reader In situations where a meter is not currently being remotely accessed will be required prior to connection but can produce half-hourly data, it should be relatively straightforward and collection of data by a data to fit a chatter box (see Box 3) for the collection of data by an on-site logger or central server. data logger or central server. The cost of supplying and fitting such a device is in the order of £100-500. Non-AMR capable gas meter If the current gas meter does not have AMR capability, in order to automatically collect meter readings, the meter must either be Figure 13: Optical reader (courtesy of PA Energy) replaced or retrofitted. Continue Better Metering Toolkit Home | Acknowledgements | Glossary Print Email Contact us
  • 27.
    27 Introduction Contents Benefits Meters Systems Using Data Case Studies Overview | AMR Schematic | Cost Table | Technical Detail Detail 1. Metering (continued) 1 Metering Replacing a non-AMR capable gas meter Retrofitting a non-AMR capable gas meter 2 Data transmission to a The cost of fitting a replacement gas meter is more variable than As with a non-AMR electricity meter, the existing gas meter can be central point for an electricity meter. similarly modified to be read remotely by coupling it with a reading device to provide a pulse output e.g. optical reader. The cost of • or a small domestic style gas meter, the cost is around £600-£800 F retrofitting an existing meter is similar to retrofitting an electricity meter 3 On-site data collection for full AMR capability. (£300-£600). Hence, particularly for larger gas installations, retrofitting 4 External transmission • hen replacing a larger gas meter, the cost can be in the region W can be an attractive option. Note the same issues for retrofitting for off-site analysis of £5,000 due to the greater amount of installation work involved. electricity meters also apply to gas meters. (See Retrofitting a non-AMR capable electricity meter). 5 Data storage It is always worth checking whether the utility company will upgrade the gas meter free of charge. However, there are costs associated with It is important that all bolt-on retrofit devices fitted to utility meters are 6 Data visualisation and analysis this upgrade as the utility company will now become the meter asset registered with the utility provider or they are likely to be removed when manager for the ‘free’ upgrade. It is usually necessary to sign up to the the meter is next read manually. utility company’s AMR contract with annual costs of circa £200 per year. For further information on the key players within the electricity and BOX 4 gas markets and their respective rules see Carbon Trust CTV027. AMR Water Metering To be able to measure the gas flow, gas meters are always fitted It may be beneficial to implement an AMR water metering in-line. Therefore, adding or changing a meter requires disruption to strategy. Main water meters can be replaced or retro-fitted, the gas feed. Whilst this requires greater installation effort than for and sub-meters can be installed, to provide more detailed an electricity meter (pipes need to be emptied, purged, cut, re-sealed information on water consumption (see Figure 14). Such a and tested prior to re-commissioning) it may well be less disruptive to strategy can used to deliver improved water management and the organisation e.g. it will not affect the operation of vital IT services. occupier billing, comparable to energy metering. AMR water Installation can be carried out outside normal working hours or during meters act in a similar manner to gas metering in that they the summer months when no space heating is required. measure the flow (in this case of water) and produce pulsed outputs related to units of consumption. This data can be used Gas meters may also impose a significant pressure drop. Since gas to identify normal and abnormal flow rates which help identify appliances usually require a minimum supply pressure, installing leaks and potential efficiency improvements. Many of the issues a new meter may require a re-commissioning exercise, with related to the installation of an AMR water metering system are consequent cost and business disruption. There are various options similar to those outlined here for gas, however it is important to Figure 14: AMR capable water for replacement metering systems and it is worth discussing with seek specialist advice for water metering. sub-meter potential meter providers any solutions that might be available to minimise disruption. Continue Better Metering Toolkit Home | Acknowledgements | Glossary Print Email Contact us
  • 28.
    28 Introduction Contents Benefits Meters Systems Using Data Case Studies Overview | AMR Schematic | Cost Table | Technical Detail Detail 1. Metering (continued) 1 Metering Sub-metering Figure 15: Electricity sub-metering of a photovoltaic array 2 Data transmission to a Section 3: Meters described how sub-metering can be used to measure central point part of the energy load in a building. The key decisions to be made are whether to sub-meter the building and, if so, the sub-metering strategy 3 On-site data collection to be adopted i.e. what areas or part-loads to sub-meter. 4 External transmission Do you need to sub-meter your building? for off-site analysis The decision as to whether to sub-meter a building depends on the reasons for installing the new metering system. 5 Data storage • o improve energy management: In buildings that are not T 6 Data visualisation and analysis complex e.g. a single HVAC system, quick and large wins can often be made by initially focussing on analysing the main utility meter readings (see GE Capital Real Estate case study). Sub-metering is particularly helpful for buildings with more complex building services systems and for investigating power load issues that Renewables and low carbon technologies (e.g. photovoltaics, cannot be resolved from the main meter readings. By knowing the solar thermal, wind turbines and Combined Heat and Power (CHP) expected power loads of the specific energy consuming appliances plant can also be sub-metered and monitored to ensure the technology (e.g. chillers and or handling units) and the times that they should is performing according to expectations, as well as for reporting be operating, a quick check can be made to see if they are operating purposes (see Figure 15). as intended. • o improve occupier billing: in this case, sub-meters should be T For the purposes of improving energy management, the recommended installed to separately measure the energy use of each occupier. approach is to only install meters where the potential cost saving from reduced energy consumption is likely to outweigh the cost of the What to sub-meter in a building metering point (see Box 6). As a guide, action taken as the result of Most sub-metering systems solely measure electricity consumption installing a meter can save a minimum of between 5-10% of the energy within the building. Sub-metering for gas is less common as, for many flowing through it. For more information CIBSE TM39 provides detailed office buildings, the gas supply principally feeds a single heating explanations on location based sub-metering system and there are no other significant loads to measure. However, The cost of the supply and installation of an electricity sub-meter with it can be relevant where there are multiple heating systems (e.g. a AMR capability is similar to the cost of a main utility meter (£200 to £400). hotel or large office may have separate space and hot water heating In addition, there will be an on-going cost for maintenance. The number systems) or there is a significant use of gas other than for heating of sub-meters installed will depend on the overall metering strategy. (e.g. a building includes a large catering facility). Continue Better Metering Toolkit Home | Acknowledgements | Glossary Print Email Contact us
  • 29.
    29 Introduction Contents Benefits Meters Systems Using Data Case Studies Overview | AMR Schematic | Cost Table | Technical Detail Detail 1. Metering (continued) 1 Metering Challenges to sub-metering 2 Data transmission to a There are some practical issues associated with sub-metering that BOX 6 central point need to be considered at the procurement stage as they could affect Cost of sub-metering the cost and appropriateness of a sub-metering system. This example evaluates whether it is cost-effective to install a 3 On-site data collection • n existing buildings, a major problem with installing electricity sub- I lighting sub-meter in a building. A similar calculation could be 4 External transmission metering is the lack of accurate schematics. These are needed applied to the sub-metering of any energy load. for off-site analysis in order to accurately associate the meter with the various loads connected to it. Often, distribution board schedules are inaccurately In an office having a floor area of 500m2, with a lighting load labelled or not labelled at all! Tracing the circuits can take of 12W/m2, intended to be operating for 10 hours per day on 5 Data storage considerable time, effort and cost. weekdays only, the running cost of the lighting, at 10p/kWh, is of the order of £1,500 per year. 6 Data visualisation and analysis • ervices in most existing buildings were not designed with sub- S metering in mind. For example, lighting and power circuits may To evaluate whether it is cost-effective to install a lighting sub- both have been originally served from the same distribution board. meter, the cost of the meter should be compared with the cost BOX 5 New loads may be added to existing electrical circuits in the most of the additional energy that would be used if the lighting were Portable sub-meters convenient and cost-effective way. This can make it challenging left on longer than intended as, without the meter, the building to separate and measure the desired energy loads. operator would probably not be aware of this wastage. If the Portable meters with a data logging lights were needlessly left on for an additional 2 hours per day, capability can be a cost-effective • ome non-AMR sub-metering may already be present in a building. S this would equate to an extra £300 per year spent on electricity. alternative to identify energy wastage In this case, there are similar issues as main utility meters when If having the sub-meter helped to ensure that the lights were in areas where fixed, permanent considering whether to replace or retrofit. It is quite possible that switched off when not required, then the simple payback period sub-metering cannot be justified sub-metering is present, but no record of where the meters are for the sub-meter would probably be very short, and installation financially. Once any inefficiencies are located and what they are measuring. of the meter would be considered cost-effective. identified and corrected, the portable Installing sub-metering when unsure of the connected loads is unlikely sub-meter can easily be removed and, The ease with which data from the sub-meter can be used by to deliver meaningful information. Therefore it is recommended that the if required, redeployed elsewhere. the building operator should also be considered, as well as the first step must be a survey of the existing infrastructure (including ‘clamp However, specialist knowledge is building operator’s willingness to act on this information to keep on’ load surveys) so that the metering strategy and subsequent energy required to connect the portable sub- the lights switched off when they are not required. management actions are based on reliable information. meter safely and access the data for analysis using the device’s bespoke (Reproduced from CIBSE TM39: 2009 by permission of software application. the Chartered Institution of Building Services Engineers). Continue Better Metering Toolkit Home | Acknowledgements | Glossary Print Email Contact us
  • 30.
    30 Introduction Contents Benefits Meters Systems Using Data Case Studies Overview | AMR Schematic | Cost Table | Technical Detail Detail 1. Metering (continued) 1 Metering Heat and coolth sub-meters Owner sub-metering for occupier billing 2 Data transmission to a As mentioned in Section 3: Meters, heat and coolth sub-metering In buildings where an owner has responsibility for the main utility central point can be used to apportion the energy supplied from central heating supplies to the building and on floor lighting power consumed within and cooling systems to the occupiers in the building. the occupier’s demise is recharged to occupiers through the use of 3 On-site data collection occupier billing sub-meters, under the Electricity Act 1989 the owner Heat and coolth sub-meters both comprise of two key components: is ‘on-selling’ electricity and for this reason the meters must be Ofgem 4 External transmission • flow meter to measure the volume of water flowing through A certified. By 2016 all new occupier meters used for billing purposes for off-site analysis the pipe-work must conform with the EU Measuring Instruments Directive (MID). Typical costs vary from £200-£500 (not including installation and 5 Data storage • wo temperature sensors to measure the temperature difference T commissioning), however on-selling electricity meters can require between the flow and the return pipe-work. recalibration or replacement every 10 years. 6 Data visualisation and analysis The flow meter and temperature sensors can be locally connected to For further information see the National Measurement Office a heat calculator which determines the energy used by the specific energy load e.g. individual occupier heating or cooling (see Figure 16). The heat calculators then output data related to units of energy consumption via pulse cable connection or via ‘data packages’ over Ethernet connections. As an alternative, the flow meter and temperature sensors can be hard-wired to a Building Management System (BMS). The BMS calculates the energy consumption of each occupier. There may be practical issues in installing the meters. For example: • pace is required to access the pipe work and install the meter. S This can be difficult where there are other building services co-located in the same area. • here will need to be disruption to the heating or cooling system T to install an in-line flow meter. This can be effectively managed by undertaking the necessary work during summer or winter months as appropriate. As with all water flow sub-metering a non-intrusive alternative to in-line metering is to use an ultrasonic flow meter that clamps on to existing Figure 16: Heat/Coolth calculator pipe work and measures temperature change and flow rate. However, this form of metering is less accurate and will also require a permanent power supply which may not be available in the required location. Better Metering Toolkit Home | Acknowledgements | Glossary Print Email Contact us
  • 31.
    31 Introduction Contents Benefits Meters Systems Using Data Case Studies Overview | AMR Schematic | Cost Table | Technical Detail Detail 2. Data transmission to a central point 1 Metering Once a meter reading has been taken the data needs to be transmitted There may however, be issues of signal strength for internal wireless to a central point for storage. This may be a multi-staged approach communication depending on the relative location of the meters and 2 Data transmission to a depending on the complexity of the situation. For example: main transmitter. An alternative is to use a mesh network (e.g. using central point the Zigbee communications standard) whereby all of the meters • n a single building, the metering data may simply be internally I 3 On-site data collection communicate wirelessly with each other, which effectively boosts transmitted to a central server within the building. This may be each meter’s signal strength to the main transmitter (see Figure 17). via a direct connection from the meters to the server or via data 4 External transmission loggers connected to the server. As a rule, wireless communication, no matter how advanced, is prone for off-site analysis to data gaps if there is a break in communication. However, this is only • or a multi-building portfolio, it is likely to be a combination of F internal and external transmission using both data loggers and an issue if a major spike in consumption occurs that requires analysis 5 Data storage external transmitters. within the specific half-hour period of data that has been lost. 6 Data visualisation and analysis This section first deals with internal transmission options for connecting Figure 17: Comparison between traditional and mesh meters to data loggers, central servers or external transmitters. There network communications are many possible means of internal data transmission. Some common options are outlined here, but the list is not exhaustive. Traditional hard wired or Mesh network wireless communication Wireless transmission wireless communication Wireless transmission is communication without the use of physical wires. Data is transmitted through the use of a transmitter and receiver at the two connected locations. An internal wireless network has a number of advantages for existing buildings where installation of a wired network is prohibitive. In particular, • t allows different components of the system to be located anywhere I in the building. Datalogger/external AMR capable meter • t is simple to expand the capacity of the network – new components I transmitter can be added without the need to install new cabling. • t is less expensive when connecting over long distances where I cabling becomes difficult or transmission of data weakens. Continue • n a building where there are no risers or containment options I e.g. shopping centres Better Metering Toolkit Home | Acknowledgements | Glossary Print Email Contact us
  • 32.
    32 Introduction Contents Benefits Meters Systems Using Data Case Studies Overview | AMR Schematic | Cost Table | Technical Detail Detail 2. Data transmission to a central point (continued) 1 Metering Hard wired cabling 2 Data transmission to a In this case, data cables are installed within a building (see Figure 18). central point The main advantages of this approach are that it is a very reliable form of communication and provides fast transmission speeds. This could 3 On-site data collection be via ‘twisted pair’ pulse cables or Ethernet cables depending on the meters’ data output capabilities. 4 External transmission for off-site analysis Hard wired cabling is a practical option when connecting components located close to each other. However, if components need to be 5 Data storage connected over a long distance e.g. to a central server, installation of a new cabled communication network in an existing building can 6 Data visualisation and analysis be disruptive and expensive. The cabling routes must fit within the existing building structure, potentially involving routing channels in the fabric of the building or accessing cramped and confined spaces. Other options A building’s data telecommunication network could be utilised. However, this is subject to: • greement from the IT team who for security reasons may a not wish to include additional devices on the IT system; and • dequate capacity being available near meter locations (which a are usually in the plant room away from IT infrastructure). Another option which exists is to use the building’s electrical wiring network to transmit data (i.e. Ethernet over power). Any meter or data logger with Ethernet output can use this communication facility. However, power outlets and proprietary products are required to deliver Figure 18: Hard wired cabling installation for internal transmission this approach and it is not possible to transmit between sites or areas of main water meter pulses of a building wired on different phases or incoming supplies. Better Metering Toolkit Home | Acknowledgements | Glossary Print Email Contact us
  • 33.
    33 Introduction Contents Benefits Meters Systems Using Data Case Studies Overview | AMR Schematic | Cost Table | Technical Detail Detail 3. On-site data collection 1 Metering Each data output from an AMR meter corresponds to a fixed amount Data logger of energy consumption, expressed as pulses per kWh or ‘packages’ 2 Data transmission to a Traditionally, a data logger (see Figure 19) is separate to the meter. of data depending on the type of meter that is installed: central point The logger has one or multiple input channels, with each one being • tandard electricity AMR meters will produce pulse outputs, while S able to be connected to a different meter to collect pulse outputs. 3 On-site data collection more high-end electricity meters (meters with greater functionality) The logger will also have one or more output channels to allow can send ‘data packages’ via ethernet connections. These data on-going data transmission e.g. connecting multiple data loggers in 4 External transmission packages can contain a number of additional electrical parameters a row (often referred to as daisy chaining) to one central server or for off-site analysis which may be of interest to building management to understand external transmitter. the power consumption and base loads of specific equipment 5 Data storage There are a wide variety of data loggers, however most operate with e.g. a chiller, however these meters are more expensive. a proprietary data collection application and it may be necessary to 6 Data visualisation and analysis • as and water meters only have the ability to produce G seek specialist advice on the most appropriate technology. pulse outputs. In which ever form data is sent from the meter, the information needs to be captured by a storage device before the information can be analysed. Typically, such storage devices count and store data emitted by the meters in each half-hourly period and then convert this into half-hourly energy or water consumption. This may be either: • emporary data collection via a data logger prior to on-going T e.g. daily or weekly data transmission to an internal or external central server. Data loggers can generally only store pulse data outputs • entral storage via a central metering server or BMS. These C can store pulse data outputs as well as data packages from high-end electricity meters. Figure 19: Data logger Continue Better Metering Toolkit Home | Acknowledgements | Glossary Print Email Contact us
  • 34.
    34 Introduction Contents Benefits Meters Systems Using Data Case Studies Overview | AMR Schematic | Cost Table | Technical Detail Detail 3. On-site data collection (continued) 1 Metering Central metering server • areful commissioning will be required to ensure the BMS is C recording accurate data. This is particularly true for calculated 2 Data transmission to a It is possible to set up a bespoke central metering server to store the meters such as heat and coolth meters central point captured metering data. Central servers can receive data via data loggers or direct from the AMR meters themselves. Whilst costing • pecific data logging and scheduling standards will need setting out S 3 On-site data collection significantly more and possibly requiring the setting up of additional in order to capture data consistently for any onward transmission. communication structure in a building, this option may be selected 4 External transmission for the following reasons: for off-site analysis • Central storage for on-site data analysis. BOX 7 5 Data storage • Central storage before external transmission for analysis. Combined AMR meters • o receive ‘data packages’ containing additional electrical T AMR meters can be supplied with a combined meter, logger 6 Data visualisation and analysis parameters from high-end electricity meters which traditionally and transmitter all in one box. This option is most common for data loggers are unable to receive. new main electricity meters. The unit may have multiple input channels e.g. it may be possible to use an electricity meter Building Management System (BMS) with an integral data logger to capture data from the main gas and water meters and thus provide a simple solution for whole In a similar way to having a central server, it may be possible to use building multi-utility AMR monitoring. This integral unit may be an the existing BMS to store the captured metering data. This option attractive option as it avoids the need to separately purchase and can achieve significant cost savings, since the communication connect multiple components, although it is then not possible to infrastructure and data storage is already in place. change one component in isolation. The cost for this option is in However, it is important that the BMS is assessed thoroughly to the region of £400-£600 per meter. make sure it has the capability to deliver the proposed additional functionality. For example: • he BMS may not be designed for, or have the capacity for T the continuous acquisition of data from multiple meters. • here may be insufficient hard-wire connection points on the T BMS out-stations to connect the sub-meters. Better Metering Toolkit Home | Acknowledgements | Glossary Print Email Contact us
  • 35.
    35 Introduction Contents Benefits Meters Systems Using Data Case Studies Overview | AMR Schematic | Cost Table | Technical Detail Detail 4. External transmission for off-site analysis 1 Metering In many cases, metering data is transmitted externally from the phone operators can be checked and a SIM card installed for the metered building prior to being provided to the end user. This can operator with the best signal. Alternatively, a remote antenna can be 2 Data transmission to a occur in instances when: installed to link the metering point to an area of the building where a central point better signal can be found. • he owner or occupier has a portfolio of properties and the T 3 On-site data collection metering data from these buildings is externally transmitted In terms of cost, it is advisable for an owner or occupier to check their to a central storage centre. SMS mobile tariff. Mobile tariffs exist with unlimited SMS messages 4 External transmission but are rarely selected on business contracts. Tariffs with free SMS for off-site analysis • he owner or occupier has contracted an external data collection T messages will significantly reduce costs of data transmission. service which collects the metering data on the organisation’s 5 Data storage behalf. The cost of data transfer and collection by a data bureau Landline communications service is typically £20-60 per year per meter (assuming daily An alternative option is to use landline communications where an 6 Data visualisation and analysis transmission of data). analogue telephone line is reserved for the transmission of metering data. • he utility company is collecting the AMR data from main utility T meters for billing purposes. This is a very reliable communication method and avoids problems of poor signal strength that can be associated with wireless There are many possible means of external data transmission. Some communication. As an example, a conventional telephone line is common options are outlined here, but the list is not exhaustive. the normal method of communicating with a half-hourly utility billing electricity meter. It can also be used to transmit data from other main Use of cellular wireless technology utility meters or sub-meters (see Transport for London case study As well as for internal communication, wireless technology can as an example). also be used for longer range external communication using cellular This method of communication can be more expensive than the technology (GSM). SMS messages are transmitted periodically wireless option, as there are additional costs of procuring the line (e.g. daily) from each data logger or central server comprising and paying a line rental charge (circa £150 per phone line). However all half-hourly readings since the previous transmission. for many large organisations, there may be no charge if transmitting The main problem with cellelar wireless communication is signal data between their own buildings. This may be relevant if, for example, strength. Meters are often located in areas of a building with either an owner or occupier is transmitting data from multiple buildings to a a significant amount of electrical interference or in basements with central server located in, say, their headquarters building. structural barriers. As a result, cellular signals may be very weak. When setting up the system, the signal strength from various mobile Continue Better Metering Toolkit Home | Acknowledgements | Glossary Print Email Contact us
  • 36.
    36 Introduction Contents Benefits Meters Systems Using Data Case Studies Overview | AMR Schematic | Cost Table | Technical Detail Detail 4. External transmission for off-site analysis (continued) 1 Metering Other communication options calls or SMS messages. The main benefit of high frequency data transmission is through the use of automated alerts which tell the 2 Data transmission to a There are many other communication options, which include: building management that energy consumption has gone outside a pre- central point • Walk by’ meter readings whereby a handheld meter reader with a ‘ defined tolerance range, allowing quick remedial action to be initiated. 3 On-site data collection built-in or attached receiver/transceiver (radio frequency or touch) In most cases, receiving ‘live’ data is unlikely to be worthwhile. is used to collect meter readings from an AMR capable meter. The cost of having someone constantly available to take action, 4 External transmission This is a simple option to set-up as it only requires a meter reader and the associated transmission costs of live data, are likely to for off-site analysis to pass each meter on a meter reading route, however, it is likely outweigh the benefits of being able to take immediate action. to be a more labour intensive (and costly) solution for the energy 5 Data storage management of a large building portfolio where there may be a More common is the transmission of data on a day-to-day or weekly requirement for frequent data collection from hundreds of meters. basis. Whereby data is transmitted overnight (daily) or over a weekend 6 Data visualisation and analysis • computer network and internet connection. However, this will A (weekly) and the building management receives the information when be subject to approval of corporate IT teams who may have they next log in. concerns with connecting devices to their networks and especially The main issues with longer transmission frequencies are: external parties accessing devices on that network from outside a corporate firewall. • s periods get less frequent, the longer the time before the building A • ower Line Communications (PLC) where metering data is P management is alerted to an issue and is able to take appropriate transmitted over electricity power lines. While not a common remedial action. transmission option in the UK, it may be used more extensively in • f the identified issue is a transient one, it will be more difficult to I the future. Utility companies are working towards the development find out what was occurring at a given point in time, particularly of this transmission option as it will be an attractive communication if significant time has passed since the issue occured. method considering the government’s plans for the roll-out of smart meters and development of ‘smart grids’. • here is greater chance of data loss if a communication problem T develops during a longer period between data transmissions. Frequency of transmission Longer data transmission periods (e.g. monthly) are more appropriate Once a decision on how data will be transmitted externally has when the focus of a AMR system is simply to provide more accurate been made, a further decision on the frequency of data transmission occupier billing. Note that the data logged is still half-hourly but the is required. data is transmitted at differing intervals e.g. 48 readings are sent per day, or 336 readings per week etc. The decision will depend on the benefits gained from having data provided more frequently. As a general rule, the more frequent the transmission, the greater the cost e.g. the cost of additional phone Better Metering Toolkit Home | Acknowledgements | Glossary Print Email Contact us
  • 37.
    37 Introduction Contents Benefits Meters Systems Using Data Case Studies Overview | AMR Schematic | Cost Table | Technical Detail Detail 5. Data storage 1 Metering Externally transmitted data is received and stored in a central storage There is likely to be a small fee for the second option e.g. a daily read unit. The organisation receiving the data might be: over GSM could cost between £20-£50 per meter per year whereas 2 Data transmission to a the cost of a weekly read could be around £10-£20 per meter per central point • he utility company, who then make the data available to the T year, however, it does provide data tailored for the organisation’s building owner and/or occupier via web access or e-mail. This is use whereby: 3 On-site data collection most likely for single buildings, where sub-metering is not required. • ata can be put into an appropriate format to aid input to an D 4 External transmission • he organisation that manages the building: This is most likely T aMT system (see Section 5: Using Data). for off-site analysis where an owner, occupier or managing agent is responsible for a portfolio of buildings. Assembling the data across the portfolio allows • ata will be unprocessed and can be reviewed to identify any D 5 Data storage a consistent approach to data analysis and reporting, and facilitates missing information. This can highlight any data transmission comparison of performance between buildings of similar type/use. and collection problems. 6 Data visualisation and analysis • specialist data collection service, which may additionally provide A Where an existing main utility meter has been enabled by an owner data analysis and reporting services. This is most likely for large or occupier to provide AMR data (i.e. the meter had not previously and/or complex portfolios of buildings. been enabled to provide AMR data to the utility company), there is an advantage in using a licensed Data Collector to collect this data as Main utility meter providing half-hourly data to they are able to make the data available to the utility company. The utility utility company company can then produce a customer read bill in place of an estimated Where the main utility meter data is being transmitted to the utility bill which will result in more accurate monthly/quarterly bills than a large company at half-hourly intervals, there are two options, depending reconciliation when the meter is only read manually once a year. on the electricity supply contract in place: Continue • or half-hourly contracted buildings, request that the utility company F provides the data, either by providing access via a web-portal, or by emailing the data. • or non-half hourly contracted buildings appoint a licensed Data F Collector to collect the metering data for both the utility company and the organisation. Better Metering Toolkit Home | Acknowledgements | Glossary Print Email Contact us
  • 38.
    38 Introduction Contents Benefits Meters Systems Using Data Case Studies Overview | AMR Schematic | Cost Table | Technical Detail Detail 5. Data Storage (continued) 1 Metering Sub-meters 2 Data transmission to a There are two main options for the collection and storage of sub- central point metering data: 3 On-site data collection • ata collection service: A third-party accesses and stores the data D on an owner or occupier’s behalf, which the organisation may wish 4 External transmission to subsequently download (see British Land, GE Capital Real Estate for off-site analysis and Land Securities case studies). • elf-collection: The owner or occupier accesses and stores S 5 Data storage the metering data via a modem or IT network (see Transport for London case study). 6 Data visualisation and analysis The main advantage of selecting a data collection service over self- collection is that it can greatly increase the ease and cost effectiveness of data collection and storage when collecting data for a number of buildings. For example, a building owner may have a large portfolio of buildings which has been acquired over time. Each building has its own separate AMR metering system and the owner wishes to collect all the metering data onto one central database. Each metering system has different communication protocols and therefore requires separate approaches to communicate with each building, making it a complex and costly exercise to buy all the necessary equipment if a self-dialled option is chosen. By selecting a data collection service, a third party who already has the specialist knowledge and necessary communication equipment required to collect all the data, can collect and provide the data to the owner in the desired format, removing the burden from the owner. Better Metering Toolkit Home | Acknowledgements | Glossary Print Email Contact us
  • 39.
    39 Introduction Contents Benefits Meters Systems Using Data Case Studies Overview | AMR Schematic | Cost Table | Technical Detail Detail 6. Data visualisation and analysis 1 Metering Once data has been collected, this information needs to be analysed and automatic alerts if the energy consumption goes outside a to understand how energy is being consumed in a building. This will pre-defined tolerence range. The cost would increase if additional 2 Data transmission to a help the owner/occupiers realise the benefits outlined in Section 2: services were required. As an example, the service provider can central point Benefits, e.g. ensuring efficient operation and identifing energy saving additionally act as a ‘virtual’ energy manager, providing bespoke 3 On-site data collection opportunities. This analysis is carried out by automatic Monitoring and advice to reduce consumption. The cost of such services obviously Targeting (aMT) software. There are a number of different packages depends on the size of the building portfolio. Some providers 4 External transmission on the market that provide a variety of services depending on the guarantee an agreed level of energy savings from using their for off-site analysis owner’s / occupier’s requirements e.g. bill validation and alert functions. energy management service (See British Land case study). 5 Data storage Who analyses the data? The choice between these two options will depend on a number of There are two main options for how data can be analysed: factors, including the number of meters in the system, the level of 6 Data visualisation and analysis flexibility required from the software and the availability of in-house • he building management can access the information stored directly T staff to run software on their PC. It should be noted that in the former or via a data collector and download it into a software package. option, there may be significant manual effort in transferring the data The software could be on their PC, on their company server or into the software package. on a web-server usually hosted by the owner of the software. A BOX 8 key advantage of the latter option is that it can be accessed from Software options Selecting the right aMT anywhere by anyone who needs to analyse or review the data. It Whichever of the two options is selected, a further decision needs software package is possible to undertake analysis using a spread sheet or software to be made as to which software package to select. tools that are freely available, but this is unlikely to be sufficient It is recommended that the building for a commercial property owner or occupier with a large portfolio • n the first option, the owner / occupier will be able to choose from all I management request a trial before and multiple meters in each building. The cost of dedicated aMT of the available software packages and the different alternatives purchasing an aMT software software ranges from £2,000 to upwards of £50,000 depending on within these packages (e.g. a basic version or a more expensive package. The supplier should be the capabilities required. In addition, there may be an annual license version with enhanced functionality). asked to populate the software with fee and a maintenance contract for technical support. some data relevant to the owner • data collection service will have already produced or purchased A / occupier which will allow for • n external service provider undertakes the analysis, with the A their software. The owner / occupier will need to decide which of the appropriate testing and ensure the information being accessed via the internet. The cost is typically available analysis and reporting functions they wish to pay for. chosen software package has the £100-200 per year for a main utility meter, often less for each sub- desired reporting functionality. meter. This provides basic periodic reporting of energy consumption, Continue Better Metering Toolkit Home | Acknowledgements | Glossary Print Email Contact us
  • 40.
    40 Introduction Contents Benefits Meters Systems Using Data Case Studies Overview | AMR Schematic | Cost Table | Technical Detail Detail 6. Data visualisation and analysis (continued) 1 Metering aMT software packages may include one or more of the • Energy procurement – to help select and negotiate the best tariff following features: 2 Data transmission to a • tatutory reporting – production of DECs or CRC compliance S central point • Energy management – consumption reporting, exception alerts reports (see Section 2: Benefits). • ccupier billing – to manage the process of creating invoices for O The requirements set by Transport for London in a tendering exercise to 3 On-site data collection sub-metered occupiers select an aMT software package that fully integrated the capture, analysis 4 External transmission • nvoice validation – to identify billing errors and help reclaim I and reporting is provided in Box 9. Half hourly data from AMR meters is for off-site analysis overcharges referred to as High Frequency (HF) data, while weekly manual meter reads • Financial forecasting – future energy consumption and costs and invoice based data is referred to as Low Frequency (LF) data. 5 Data storage 6 Data visualisation and analysis BOX 9 aMT software requirements for Transport for London Low frequency (LF) data High frequency (HF) data • Manual invoice data entry • mport of data – supplier and bureau based I • lectronic data entry and compatibility with different supplier formats E • Data validation • nvoice validation – user readings or HF data based I • Data management • Management of invoice queries • Standard reporting capability • Invoice audit trails • User defined reporting • Accrual management • Profile targeting • Target setting • roduction of ‘out of hours’ Energy League Table P • Regression analysis • onversion of HF to LF data for ‘Occupier on-selling’ C • Forecasting • Cost Centre Accounting • Compatibility with TfL’s finance systems • Adverse trend identification • Integration with HF data handling • Standard reports • User defined reports • ccupier ‘off charging’ report development O • our weekly ‘Performance Analysis’ Reports and link to TfL intranet F Better Metering Toolkit Home | Acknowledgements | Glossary Print Email Contact us
  • 41.
    41 Introduction Contents Benefits Meters Systems Using Data Case Studies 5. Using Data This section provides an outline of the various techniques that can be used to analyse and manage energy performance. Each have their advantages and limitations and the different options available will depend on the extent and type of metering installed. Continue Better Metering Toolkit Home | Acknowledgements | Glossary Print Email Contact us
  • 42.
    42 Introduction Contents Benefits Meters Systems Using Data Case Studies How to use the data 1. Overview 1 Overview Installing meters is only the first stage in the energy management It is also important to realise that effective energy management is not a one off process but something that has to be undertaken on a 2 Comparing a building with process (see Figure 20). Meters generate data on utility consumption, continuing basis. The way a building is used changes with time, as new other, similar buildings but raw data has to be analysed to turn it into useful information. This information then has to be interpreted and understood. Understanding occupiers take space, as different working practices are adopted, 3 Comparing how the demand can then be used to make decisions. Decisions prompt appropriate or as bad habits creep back in. For example, one of the most frequent for energy varies with time actions, and it is the results of these actions that will deliver energy, causes of energy wastage is where the building systems have been cost and carbon savings. set up to service the way the building was being used by previous 4 Comparing different areas occupiers, but have never been adjusted to the meet the different of a building Figure 20: Energy management process needs of the current occupiers. This can result in plant running longer than necessary in all or parts of the building. Even routine events like 5 Comparing how the the change to/from summer time can mean that plant operating hours demand for energy can be out of synchronisation with occupancy patterns. varies with the weather Install A well considered metering strategy, coupled with analysis and Measure interpretation of the data will allow an owner or occupier to identify 6 Maintain good records such wastage. This will not only save energy, it may increase the life of plant, and may improve the comfort and satisfaction of occupiers. Assess Analyse Continue Implement Understand Decide Better Metering Toolkit Home | Acknowledgements | Glossary Print Email Contact us
  • 43.
    43 Introduction Contents Benefits Meters Systems Using Data Case Studies How to use the data 2. Comparing a building with other, similar buildings 1 Overview If there is no AMR metering in a building providing half-hourly If an organisation occupies several buildings, it can be particularly data then the most appropriate analysis is to compare the annual helpful to also compare a building with others similar in the portfolio 2 Comparing a building with energy performance with other similar buildings (see Figure 22). This (see Figure 23). By identifying good and poor performers in a portfolio, other, similar buildings assessment will be based on manual readings of the main utility it may be possible to identify trends that allow the application of lessons 3 Comparing how the demand meters. It is important to use actual readings and not estimated usage from the good performers to the poorer ones. There can also be a for energy varies with time as provided by the utility company. This is the approach adopted for the useful motivational spin-off from this peer benchmarking process. A key Display Energy Certificate (DEC), which generates an energy label for requirement for improved energy performance is enthusiastic buy-in 4 Comparing different areas a building. Although only required for public buildings over 1,000m2, from staff. Healthy competition can often provide the incentive that of a building private owners and occupiers can voluntarily choose to produce a DEC. repeated exhortation fails to deliver! The underpinning methodology provides a very useful starting point in understanding a building’s energy performance. The Operational For more information on sustainability benchmarking see BBP 5 Comparing how the Rating that is displayed on the DEC will indicate how well a building is Sustainability Benchmarking Toolkit for Commercial Buldings. demand for energy performing relative to the national stock of similar buildings (see Figure For further examples of how to report environmental performance varies with the weather 21). Clearly, some buildings would be expected to perform better than see BBP Green Building Management Toolkit. 6 Maintain good records the national stock average by virtue of the progressive improvement in Figure 23: Example CO2 intensity benchmarking of a portfolio energy efficiency standards imposed by successive revisions of Part of office buildings L of the Building Regulations. Therefore a newly constructed building that achieves an E-rating is more likely to be wasting energy than a 800 Figure 21: Example of a DEC certificate twenty-five year old building with the same E-rating. The owner of the 700 new building should therefore give particular attention to improved energy management. The older building should not neglect energy 600 management, but should also consider how the fabric or services might be improved to reduce energy demand. 500 kg CO2 / m2 / year Figure 22: Example comparison of a building’s annual energy 400 consumption against a set of pre-determined benchmarks 300 200 100 0 Electricity Non-AirCon AirCon - Standard AirCon - Prestige Gas The chart represents over 100 office buildings ordered in terms of carbon intensity by floor area (kgCO2/m2/year), categorised into three bands based on the type of installed HVAC Current Target Best Typical Portfolio system (provided by ECON 19). The green line (based on the median value) provides a performance practise performance average benchmark which individual buildings can be compared against. Better Metering Toolkit Home | Acknowledgements | Glossary Print Email Contact us
  • 44.
    44 Introduction Contents Benefits Meters Systems Using Data Case Studies How to use the data 3. Comparing how the demand for energy varies with time 1 Overview A more detailed understanding can be gained if information is available Figure 24: Example weekly half-hourly profile of electricity on how the energy demand of a building varies with time. This is consumption of a commercial office building 2 Comparing a building with possible if AMR metering is installed, since as well as measuring other, similar buildings 900 annual consumption, it is possible to consider how the energy 800 3 Comparing how the demand demand varies through the year, the week and even through the day. 700 for energy varies with time By comparing the energy demand during different periods (day/night, 600 weekday/weekend etc.), it is possible to identify energy wastage 500 4 Comparing different areas e.g. office equipment being left on, plant running over bank holidays 400 of a building etc. It is also useful to compare performance during different 300 weekdays – if there are significant differences, this may be a sign of 5 Comparing how the 200 waste. One example is to use energy demand time profiles from the demand for energy 100 use of office equipment to fine tune HVAC operating hours. Another varies with the weather 0 example of this is where early morning cleaners come in three days M T W T F S S per week and leave lights on when they leave. On mornings when the 6 Maintain good records The troughs in the graph show the baseload of the building – i.e. the minimum amount of electricity consumed cleaning service is not operating, staff arriving later accept the natural by the building. This occurs overnight when the building is empty. An optimised standard occupancy building operating during normal working hours should have a baseload of between 10 and 15% of peak consumption, light levels as being satisfactory and so do not switch the lights on. A with 24/7 operated buildings having approx. 40% baseloads. simple instruction to cleaners to turn non-essential lights off when they finish can deliver real savings at no cost. Occupied Unoccupied Figure 24 shows the time profile of the energy consumption of a Familiarity with the usual demand profiles can also be helpful in building over a week, with shades of blue indicating occupied and diagnosing problems more quickly. Any significant change in the unoccupied operational hours. It is clear that significant energy use profile of energy demand must be caused by a change in the building, occurs outside of occupied hours, both during the weekend period either in the way it is used, or in the operating regime of the plant. If and during weekdays both prior to and after occupancy. It is important the change cannot be explained by known alterations to the use of to understand the energy uses during the non-occupied hours to the building, then this signals a possible failure in the way the plant determine if they can be reduced. is operating. Quick identification and rectification of the issue will save money and provide more confortable conditions for occupier’s / staff. Better Metering Toolkit Home | Acknowledgements | Glossary Print Email Contact us
  • 45.
    45 Introduction Contents Benefits Meters Systems Using Data Case Studies How to use the data 4. Comparing different areas of a building 1 Overview If sub-meters are installed, it is possible to extend the benchmarking Figure 26: Example of weekly half-hourly profile of electricty process to different parts of the same building. This eliminates a consumption with sepaerated server and floor lighting loads 2 Comparing a building with further variable that causes differences in energy performance, other, similar buildings i.e. the age and design of the building itself. Comparing the energy 50 900 demand of different areas can help identify significant areas of waste. 3 Comparing how the demand 40 800 for energy varies with time The following charts provide examples of the type of analysis which 900 800 700 can be undertaken using aMT software to analyse sub-metering 30 700 4 Comparing different areas 600 data in a building. Figure 25 shows how a building’s sub-systems (the 50 kW 600 of a building blue bars) compare with industry benchmarks (the green areas). The 20 40 500 500 left edge of the green area represents good practice – anything under 400 5 Comparing how the 400 this is good. The right edge of the green area represents typical practice 10 30 300 kW demand for energy 300 – anything over this is poor. Figure 26 shows the weekly half-hourly 20 200 varies with the weather 200 profile of a building with separated server and lighting loads. Analysis 0 100 10 M T W T F S S 0 of individual systems over time such as this can make it easier to M 6 Maintain good records 100 locate areas of potential energy wastage within a building. Figure 27 0 Central Plant other W Central Plant other unmetered The troughs by the build 0 shows how a building owner can compare individual occupier energy M T T F S S operating d unmetered loads (occupied) loads (unoccupied) with 24/7 op consumption in a multi-occupied Th M T W building over a 24 hour period. S F S This type of analysis can be used to support the engagement process with Floor lighting Small Server Rooms and associated cooling The troughs in the graph show the baseload of the building – i.e. the minimum amount of electricity consumed by the building. This occurs overnight when energy efficiency opportunities. occupancy building occupiers when discuss the building is empty. An optimised standard Power only F S S operating during normal working hours should have a baseload of between 10 and 15% of peak consumption, P with 24/7 Figure buildings having approx. 40%breakdown of a buildings sub-systems operated 25: CO emissions baseloads. Figure 27: Example single day comparison of occupier 2 O compared to industry standards electricty consumption in a multi-occupied office 10 10 Occupier A Refrigeration 9 9 Occupier B Pumps controls 8 8 Occupier C 7 Office equipment kWh used in each half hour 7 6 Ground floor kWh used in each half hour Lighting 5 6 Humidification 4 5 3 Hotwater 4 2 Heating 3 1 0 2 00:30 01:00 01:30 02:00 02:30 03:00 03:30 04:00 04:30 05:00 05:30 06:00 06:30 07:00 07:30 08:00 08:30 09:00 09:30 10:00 10:30 11:00 11:30 12:00 12:30 13:00 13:30 14:00 14:30 15:00 15:30 16:00 16:30 17:00 17:30 18:00 18:30 19:00 19:30 20:00 20:30 21:00 21:30 22:00 22:30 23:00 23:30 00:00 1 0 Better Metering Toolkit Home | Acknowledgements | Glossary Print Email Contact us 00:30 01:00 01:30 02:00 02:30 03:00 03:30 04:00 04:30 05:00 05:30 06:00 06:30 07:00 07:30 08:00 08:30 09:00 09:30 10:00 10:30 11:00 11:30 12:00 12:30 13:00 13:30 14:00 14:30 15:00 15:30 16:00 16:30 17:00 17:30 18:00 18:30 19:00 19:30 20:00 20:30 21:00 21:30 22:00 22:30 23:00 23:30
  • 46.
    46 Introduction Contents Benefits Meters Systems Using Data Case Studies How to use the data 5. Comparing how the demand for energy varies with the weather 1 Overview Some aspects of energy demand are weather dependent, heating and Figure 28: Correlation of heating fuel use against degree days cooling being the main examples. Techniques are available to analyse 2 Comparing a building with the weather dependency of the building’s energy use. Such techniques other, similar buildings are often integrated within aMT packages and can provide a real kWh/m2 HDD 3 Comparing how the demand insight into the efficiency with which the building is being used. The for energy varies with time most common technique is based on the concept of ‘degree-days’, a measure of the severity and duration of cold weather. The Figure 28 4 Comparing different areas shows a correlation of heating fuel usage against degree days. Poor of a building energy management is identifiable where the general shapes of the two datasets do not match e.g. July as shown. More detailed analysis 5 Comparing how the is possible using regression statistical techniques (see Figure 29). demand for energy A consistent summer load can indicate a baseline demand for heat varies with the weather (usually the demand for hot water and catering services). This hot water demand can then be compared with established norms to 6 Maintain good records assess the efficiency of hot water generation and use. J F M A M J J A S O N D More sophisticated techniques can be applied to on-going monitoring, Figure 29: Correlation of gas consumption against by highlighting when there is a significant deviation from a long increasing coldness established pattern of performance. This can be used to identify emerging faults, but also to confirm expected savings have been 350 achieved following an investment in an energy efficiency measure. 300 The Carbon Trust Guide CTG004, Degree days for energy management Gas consumption 000s kWh provides an overview of these more detailed techniques. 250 200 150 100 50 0 increasing coldness The graph shows how gas consumption varies with the external temperature. The horizontal axis shows increasing coldness towards the right, the vertical axis shows how much gas was consumed in the building. Where the blue line meets the vertical axis shows the theoretical gas baseload of the building. The closeness of the points to the line (r2) show how well controlled the building’s heating system is. A perfectly controlled building will have an r2 value of 1.00. Better Metering Toolkit Home | Acknowledgements | Glossary Print Email Contact us
  • 47.
    47 Introduction Contents Benefits Meters Systems Using Data Case Studies How to use the data 6. Maintain good records 1 Overview In order for any energy management strategy to be effective, it is important to document: 2 Comparing a building with other, similar buildings • ow any new meters fit in with the overall metering strategy h for the building. 3 Comparing how the demand for energy varies with time • hanges made to the way the building systems are managed or c operated to ensure understanding of what has been done and why. 4 Comparing different areas • ny energy efficiency measures and monitor their effectiveness a of a building to aid learning for future opportunities and replication across other buildings. 5 Comparing how the demand for energy A building log-book is the appropriate place to store this information, varies with the weather so that is preserved in a consistent and readily accessible format for subsequent owners/occupiers. For more information on building log 6 Maintain good records books see CIBSE TM31 Building Logbook Toolkit. Better Metering Toolkit Home | Acknowledgements | Glossary Print Email Contact us
  • 48.
    48 Introduction Contents Benefits Meters Systems Using Data Case Studies British Land | GE Capital Real Estate | Land Securities | Transport for London 6. Case Studies The following case studies showcase examples of where a number of BBP member organisations have installed new AMR metering systems into existing operational commercial buildings. Continue York House, British Land Better Metering Toolkit Home | Acknowledgements | Glossary Print Email Contact us
  • 49.
    49 Introduction Contents Benefits Meters Systems Using Data Case Studies British Land | GE Capital Real Estate | Land Securities | Transport for London Implementation of AMR metering within The meters transmitted data at 15 minute intervals via a The service provider also supplies a statement for each British Land’s Head Office hard wired communication line direct to a central server occupier’s energy bill which the managing agent then communication network in York House. The data is then uses to produce an invoice for each occupier. In August 2009 British Land’s trialled an AMR metering transmitted from the server to their external service system at its Head Office, York House, which is situated A significant benefit of the metering system is how it has provider, EPT via ADSL every four hours. in London’s West End. The building offers over 8,400m2 helped British Land engage with their occupiers. British Land of office space, of which British Land occupy 3,700m2. The external service provider undertakes off-site data uses metering data to individually review with each occupier An important aspect of the project was to learn from the analysis to identify any issues/anomalies in the patterns of their contribution to the overall energy use in the building, experience and assess the potential for a wider roll-out energy consumption, and to indicate potential energy and and to discuss how to make savings. Metering data is then across its property portfolio. cost savings which can be made through appropriate energy also used to demonstrate improvements and savings over efficiency measures which are then reported to the on-site time. The AMR software is web-based and can be accessed The main aims of the AMR metering solution were to achieve building engineering team. With a detailed knowledge of what by occupiers and owner alike on a shared license to more accurate utility billing and occupier on-selling, as equipment or BMS setting each sub-meter is measuring it is provide real transparency and data sharing between the two. well as improving energy management to help reduce often possible for the service provider to indicate to British CO2 emissions from the building. As a result, British Overall, British Land has invested approximately £65,000 in Land engineers which piece of equipment or BMS setting is Land developed a metering strategy which included the installing the metering system, and there is an on-going cost causing a problem. Each month British Land receives report replacement of the main utility electricity meters and of approximately £12,000 per year for maintenance of the which highlights the financial impact of actions completed, as installation of an additional 6 sub-meters, including the metering and off-site analysis and reporting. This has helped well as providing an on-going record of outstanding actions. re-commissioning and connection of approximately 50 optimise the heating and cooling system (including prompt The offsite team also have a short teleconference each month sub-meters pre-existing sub-meters to an AMR systems. identification of a broken sensor that had been causing with the site team to discuss the report and have technical The sub-metering comprised: constant gas use for heating and re-programming of the discussion to consider solutions to more complex problems. Building Management System to introduce economy cycles • ub-metering of each occupier’s demise. This measures S Critically, the service provider guarantees a minimum amount and new deadband set points for cooling). As a result, British the total amount of lighting and small power to each of cost savings in common parts and central heating and Land saved £45,000 in the first year and expects to achieve occupier’s demise cooling plant. The service provider’s ‘top-up’ guarantee is payback in 18-24 months. • ub-metering of common services: heating, ventilation S applied to York House as well as a number of other British and air-conditioning Land buildings which relies on the offsite monitoring team finding enough operation savings through the process • Sub-metering of common parts: lighting and small power. described over a 3-5 year period to ensure that the building’s • n addition the system received gas and water data I consumption in these areas is reduced by approx 10%-12.5% through pulse pick-ups. against a baseline year set before the service was introduced. Better Metering Toolkit Home | Acknowledgements | Glossary Print Email Contact us
  • 50.
    50 Introduction Contents Benefits Meters Systems Using Data Case Studies British Land | GE Capital Real Estate | Land Securities | Transport for London Implementation of AMR metering at half-hourly gas consumption data was then sent daily to their Overall, the cost of implementing the AMR metering solution GE Capital Real Estate’s London HQ external service provider, WSP, (who also provided the AMR was around £1,000 and with no disruption to utility supplies. metering solution) using the mobile phone network (GSM). There is an on-going fee of approximately £500 per year for In 2009, GE Capital Real Estate trialled the use of an A similar approach was also undertaken for water metering. reports, on-line tools and alarm management. AMR metering system at its then London Headquarters, To assess electricity consumption the service provider was a 4,650 m2 office building in Berkeley Square, London. Results show significant improvements in consumption. given permission to access the half-hourly electricity data An important aspect of the project was to learn from the GE has reduced building electricity consumption by 16%, sent to the utility company. experience and assess the potential for a wider roll-out gas consumption by 42% (and water consumption by across its property portfolio. The external service provider supplies the half-hourly 74% through the installation of a waterless urinal system). electricity, gas (and water) data to GE’s building managers Annual operating costs on the building have reduced by The implementation of AMR metering was inspired partly on a dedicated website on a day-plus-one basis, together around £60,000. When all expenses for installing the system by a desire to reduce energy consumption and CO2 emissions with alarms, reporting and management tools. The (including water metering) and taking corrective actions are and partly by compliance preparations for the incoming building managers use this information to ensure efficient taken into account, they are paid back in little over one month. CRC Energy Efficiency Scheme. A decision was taken to management of the building and make any necessary focus only on the main utility meters as this was seen as Since this initial successful trial, GE Capital Real Estate correction measures. providing the greatest value in terms of energy saving is now rolling out this system to most of its multi-occupied potential and costs. It was also the option that could most Initially, GE asked the external service provider’s energy office portfolio. easily be rolled out across their portfolio if proved successful. specialists to provide energy management advice. The Whilst this solution only provides a limited level of detail, specialists analysed half hourly weekday and weekend i.e. data would not be able to be broken down to an individual profiles for each of the utilities and advised on areas to floor level, there is the capacity to link the building’s sub- investigate to cut waste and reduce consumption in the meters to the AMR system at a later date. building – especially out of hours. This was provided to GE’s building management team in a ‘remote analysis report’, The main electricity meter was already an AMR capable who then implemented changes to drive the reductions. meter, which logs and provides half-hourly consumption The changes were low cost, mainly adjustment and data to the utility company via a telephone line. The existing reprogramming of the Building Management System, gas meter had a simple dial display that needed to be read changes to temperature set-points and evening and weekend manually. However, like many modern gas meters it had a operating procedures. Visibility of the half-hourly data and pulsed output. By a simple wired connection from the pulsed knowing how much could be saved by changing equipment output to a small data logger and communication device, or operating practices was key to driving the changes. Better Metering Toolkit Home | Acknowledgements | Glossary Print Email Contact us
  • 51.
    51 Introduction Contents Benefits Meters Systems Using Data Case Studies British Land | GE Capital Real Estate | Land Securities | Transport for London Implementation of an AMR metering strategy Data is transmitted externally from the meters via GSM to 3. and Securities has been able to improve the efficiency L for Land Securities’ portfolio of office buildings Land Securities’ meter operator. Overall, GSM transmission and reduce wastage from the central services they also has proved to be a suitable mode of external transmission manage. For example, the output of an AMR sub meter Land Securities own and manage offices buildings in London, and Land Securities have had few issues in achieving identified a significant load in an unoccupied building on and shopping centres and retail parks throughout the UK. adequate signal strength wherever meters have been a Sunday. This turned out to be a chiller incorrectly being Between 2009-10, Land Securities rolled out an AMR installed within their buildings. On occasions external started by the BMS, an energy wastage that could easily metering strategy across its office portfolio. The focus has antennas or GSM boosters have been required in areas be rectified. been offices as retailers tend to separately organise and such as switch-rooms in basements/sub-basements, manage their own electricity supplies. Whilst a successful initiative, there were some common The data is collected by the meter operator and provides the installation difficulties: The main drivers of the AMR metering solution were to achieve data to Land Securities on a daily basis (day+1). The PMS more accurate utility billing for occupier recharging, as well as • any meters needed to be installed at weekends due to M transmits live data, but this is analysed as day+1 along with the improving energy management to help reduce CO2 emissions the need to stop electricity to the relevant distribution board metering data. Therefore, each day Land Securities receives across their portfolio. As a result, Land Securities developed a for half an hour. In some cases, work had to be linked to for each meter, 48 half hourly data points, plus total energy metering strategy which included the replacement of the main planned power outages six months to a year in advance. consumption for the 24 hour period. The data is accessed via utility meters and installation of sub-meters. • here was often a need to gain access to occupiers’ area T a web portal and entered by Land Securities into purchased Both electricity and gas main utility meters where replaced aMT software. The software provides energy management to install the sub-meters which required permission from with AMR capable meters where necessary and AMR and reporting, and billing capability for occupiers. each occupier. electricity sub-metering was installed to measure energy • ccasionally, there were space issues where the O Numerous benefits have been delivered through the consumption on each floor of the buildings. In addition, new meters were too large to fit in the original space. installation of the portfolio wide AMR metering strategy: meters are located to measure the different loads (e.g. This has resulted in extra work to fit the new meters. lighting, small power, air conditioning, communications room) 1. and Securities have been able to deliver more accurate L • ccasionally, additional changes were required during O depending on the arrangement of the existing distribution and timely occupier billing. Previously, manual readings installation e.g. in one building a new distribution board boards. Large new developments have a Power Management had contained incorrect data due to human error. was needed due to health and safety reasons. System (PMS) which manages the electricity supplies in 2. and Securities has a carbon reduction target of 30% over L buildings as well as providing AMR data. The PMS is there 10 years. Engaging and working with their occupiers to to control the power demands in a building particularly when influence behavioural change is an important aspect of this it is needed to operate on a standby generator. and the use of half hourly data has provided occupiers with detailed feedback on their individual energy consumption. This information has shown that in a short-time, the occupiers can reduce energy use by 5-10%. Better Metering Toolkit Home | Acknowledgements | Glossary Print Email Contact us
  • 52.
    52 Introduction Contents Benefits Meters Systems Using Data Case Studies British Land | GE Capital Real Estate | Land Securities | Transport for London Implementation of AMR metering within on each floor also included WC ventilation. They addressed communications to VOIP, as this appears to block this transfer Transport for London’s Cranbourn Street Office this by using small ‘din-rail’ meters mounted within each of data, requiring separate BT PSTN phone line installations lighting distribution board to separately meter the relevant at these VOIP sites. This case study outlines the approach that TfL has taken individual WC ventilation circuits. A set of carefully configured to AMR metering in their Cranbourn Street building. This is The sub-metering data has assisted TfL to improve the ‘virtual’ meters in their aMT software then removes the WC part of a general roll-out of AMR metering in TfL’s portfolio building’s DEC rating as it allows server room ‘separable’ ventilation loads from the Lighting distribution board metering of commercial properties that started in 1996. The case study electrical energy loads (equivalent to 18% of total electricity to provide actual on floor lighting usage reports, and adds also highlights challenges TfL have faced with their overall consumption) to be removed from the benchmarking them to the Mechanical distribution board metering to provide metering solution and outlines the planned changes to calculation. The sub-metering data has also been used to actual on floor HVAC usage reports. overcome these. resolve HVAC control time scheduling issues and identify In a similar manner to TfL’s other buildings, the sub-meters 28% occupant small power base loads that allowed the Cranbourn Street is a five storey office block, with a floor are all connected together using standard data-cables. From Building Manager to focus ‘Switch Off Communications’ area of 2260m2, based in central London. Like most of TfL’s this they are connected to a modem, which is accessed via a on the worst offenders (see chart on next page). buildings, it is solely occupied by TfL. The main electricity dialup modem facility in TfL’s energy management office and meter was originally already a half-hourly meter on their half- downloaded to a stand-alone server prior to weekly transfer to hourly supply contract with data sent to the utility company their networked aMT software which TfL use on a daily basis via a standard BT telephone connection. In 2006, TfL used to manage their energy use. the two spare input channels on the electricity meter to start recording half hourly gas and water data. This information At this site a combination of sub-meters’ own in built was then fed into their central AMR system. memory and data loggers are used to store the last 35 days of data allowing the central server to access at any In 2009, TfL installed 34 AMR sub-meters in the building. point during the 35 days with no data loss. However, the Typically, TfL separately sub-meter the central building server is programmed to dial up daily, with failed attempts services plant and the total consumption on each floor. As TfL checked weekly to highlight any communication or metering are owner-occupiers, a particular advantage of measuring maintenance issues. TfL currently also do a weekly manual consumption on each floor (e.g. from lighting and small power check of their AMR meter readings to check the accuracy of load) is that TfL has greater ability to use the information the data being automatically collected. directly to influence behavioural changes of their staff rather than if they were an owner with a separate occupier using the The cost for TfL to set-up the sub-metering system was space. In this case, there were separate distribution boards £19,000. The advantage of using telephone lines to transmit for small power, mechanical (fan coils) and lighting loads the data is that the line rental is already paid as part of TfL’s on each floor, which TfL decided to separately sub-meter to contract for internal communication between buildings. Continue meet CIBSE TM39 recommendations on sub-metering. A However, TfL has recently uncovered a potential problem problem was identified in that the distribution board for lighting with this approach during their phased upgrade of internal Better Metering Toolkit Home | Acknowledgements | Glossary Print Email Contact us
  • 53.
    53 Introduction Contents Benefits Meters Systems Using Data Case Studies British Land | GE Capital Real Estate | Land Securities | Transport for London TfL is also in the process of changing its approach to data • nly main utility meters will be manually read on a two O collection, storage and analysis across its portfolio of metered weekly basis to fulfil major financial and environmental buildings. The key reasons for this are as follows: reporting requirements, while all AMR meters will be manually read on a 12 weekly basis to ensure AMR • fL’s IT network cannot be used for transmission of T data is correct. metered data between buildings due to security risks. As a result, the central server is not allowed to sit on Further information on TfL’s approach to energy metering is the TfL network. Consequently data has to be manually provided as a case study in the Appendix of CIBSE TM39: transferred to the TfL networked aMT software which Building Energy Metering. is time consuming and can introduce human error. 900 Example half-hourly sub-metering analysis enabled by AMR installations • t takes significant time to process the data into an I 800 appropriate format for use by the aMT software 50 700 • he current 10-year old aMT software is inadequate for T 600 TfL’s current needs (eg for accessing GSM modems at 40 500 various sites) 400 30 The new approach is as follows. 300 kW 200 • data collection service will be responsible for capturing A 20 100 all metered data on a daily basis, reporting communication problems and generating weekly data files for TfL to import 10 0 M T W into their dedicated aMT software. This aMT software package fully integrates the analysis and reporting of utility 0 The troughs in the graph show the baseload of the by the building. This occurs overnight when the b meter and sub-meter AMR and manual readings data and M T W T F S S operating during normal working hours should hav invoice data. with 24/7 operated buildings having approx. 40% Central Plant other unmetered Central Plant other unmetered loads during occupied hours loads during unoccupied hours Floor lighting Small Server Rooms and Refrigeration Power only associated cooling Pumps controls Office equipment Lighting Humidification 10 Hotwater 9 Better Metering Toolkit Home | Acknowledgements 8 | Glossary Print Email Contact us Heating
  • 54.
    54 Introduction Contents Benefits Meters Systems Using Data Case Studies Glossary Automatic Metering Reading (AMR)/ Carbon Reduction Commitment (CRC Energy Display Energy Certificate (DEC) Advanced Meter Efficiency Scheme) A certificate which shows the energy performance of a In addition to traditional metering functionality A UK-based carbon emissions trading scheme for large public building based on its annual energy consumption and the (measuring and registering the amount of energy and private sector organisations. It is a mandatory scheme associated CO2 emissions. This is shown as a rating from which passes through it), AMR or advanced meters which aims to both improve energy efficiency and regulate A to G, where A has the lowest CO2 emissions (best) and are capable of one-way communication allowing the amount of greenhouse gases that are released from the G the highest CO2 emissions (worst). them to transmit meter readings remotely. burning of fossil fuels by an organisation. Global System for Mobile Communications (GSM) Automatic Monitoring and Targeting Check Meter A form of cellular wireless communication. GSM modems (aMT) software A meter required for validation purposes by comparing are used to transmit metering data over long ranges external Software that collates and analyses data provided by AMR readings against the main meter’s reading to ensure that to the metered building. This may be to a data collection meters (both half-hourly and manual readings) Utility it is operating correctly. Check meters are required buildings service or central storage point. Data is sent in the form of bills. aMT software can then be used to produce reports with over 1MW electrical supply, the utility company provides SMS messages. (including automatic ‘out of range’ reports) to enable building both the main utility meter and a check meter. management to more effectively manage the energy use in Half-hourly Contracted Site a building. Corporate Social Responsibility (CSR) A site or building where an AMR main utility electricity meter A concept whereby companies integrate social and is a mandatory requirement by the utility company. This Building Management / Energy Manager environmental concerns in their business operations and in is required for a site or building where the average peak The person(s) responsible for the energy management their interaction with their stakeholders on a voluntary basis. electricity demand over a three month period exceeds 100kW. of the building. Data Collection Service Half-hourly Data Building Management System (BMS) An external provider who collects AMR metering data on The interval which metered data is typically sent from AMR A computer-based control system installed in a building an owner or occupier’s behalf. They may also provide other meters. This is also the interval at which utility companies which controls and monitors the building’s plant and systems services such as designing and installing metering systems and collect AMR data from main utility meters. such as HVAC, lighting and power systems. A BMS can be analysing the collected data on an owner or occupier’s behalf. configured to receive half-hourly data from AMR meters and HVAC used to analyse and report on performance to improve energy Data Logger Heating, Ventilation and/or air conditioning plant in the management. An electronic device which stores half-hourly data readings building. This is normally centrally provided and managed from AMR meters. by the building management for all occupied areas. Continue Better Metering Toolkit Home | Acknowledgements | Glossary Print Email Contact us
  • 55.
    55 Introduction Contents Benefits Meters Systems Using Data Case Studies Glossary Main Utility ‘Fiscal’ Meter Sub-meter A measuring instrument that records the quantity of electricity Sub-meters are used to measure part of the energy load and gas (or water) supplied to a building. It is used by a utility in the building. This may either by location based e.g. the company for billing purposes. A basic main utility meter allows energy use of a floor or occupier, or energy load specific manual reads only, while AMR main utility meters provide e.g. lighting or chillers A sub-meter can be manual-read automatic readings to a utility company at regular intervals only or have AMR functionality. (typically half-hourly). ‘Virtual’ Meter Short Message Service (SMS) The use of algebra to calculate the energy consumption of a A text communication service component of phone, web, specific energy load which otherwise would have required an or mobile communication systems, using standardised ‘actual’ sub-meter. This form of metering is also known as communications protocols that allow the exchange or short ‘in difference’ metering and is used when the total energy text messages between fixed line and mobile devises. supply and specific downstream sub-metering is used. Metering data from GSM modems are sent via SMS Actual sub-metering data is then subtracted from the total messages. with remainder being used to provide the ‘virtual’ meter reading. Smart Meter In addition to traditional metering functionality (measuring and registering the amount of energy which passes through it), smart meters are capable of two-way communication allowing them to transmit meter reads and receive data (e.g. tariff changes) remotely. Better Metering Toolkit Home | Acknowledgements | Glossary Print Email Contact us
  • 56.
    56 Introduction Contents Benefits Meters Systems Using Data Case Studies BBP Members The Building Centre 26 Store Street London WC1E 7BT t: 020 7580 0510 e: info@betterbuildingspartnership.co.uk www.betterbuildingspartnership.co.uk Better Metering Toolkit Home | Acknowledgements | Glossary Print Email Contact us