Download to read offline


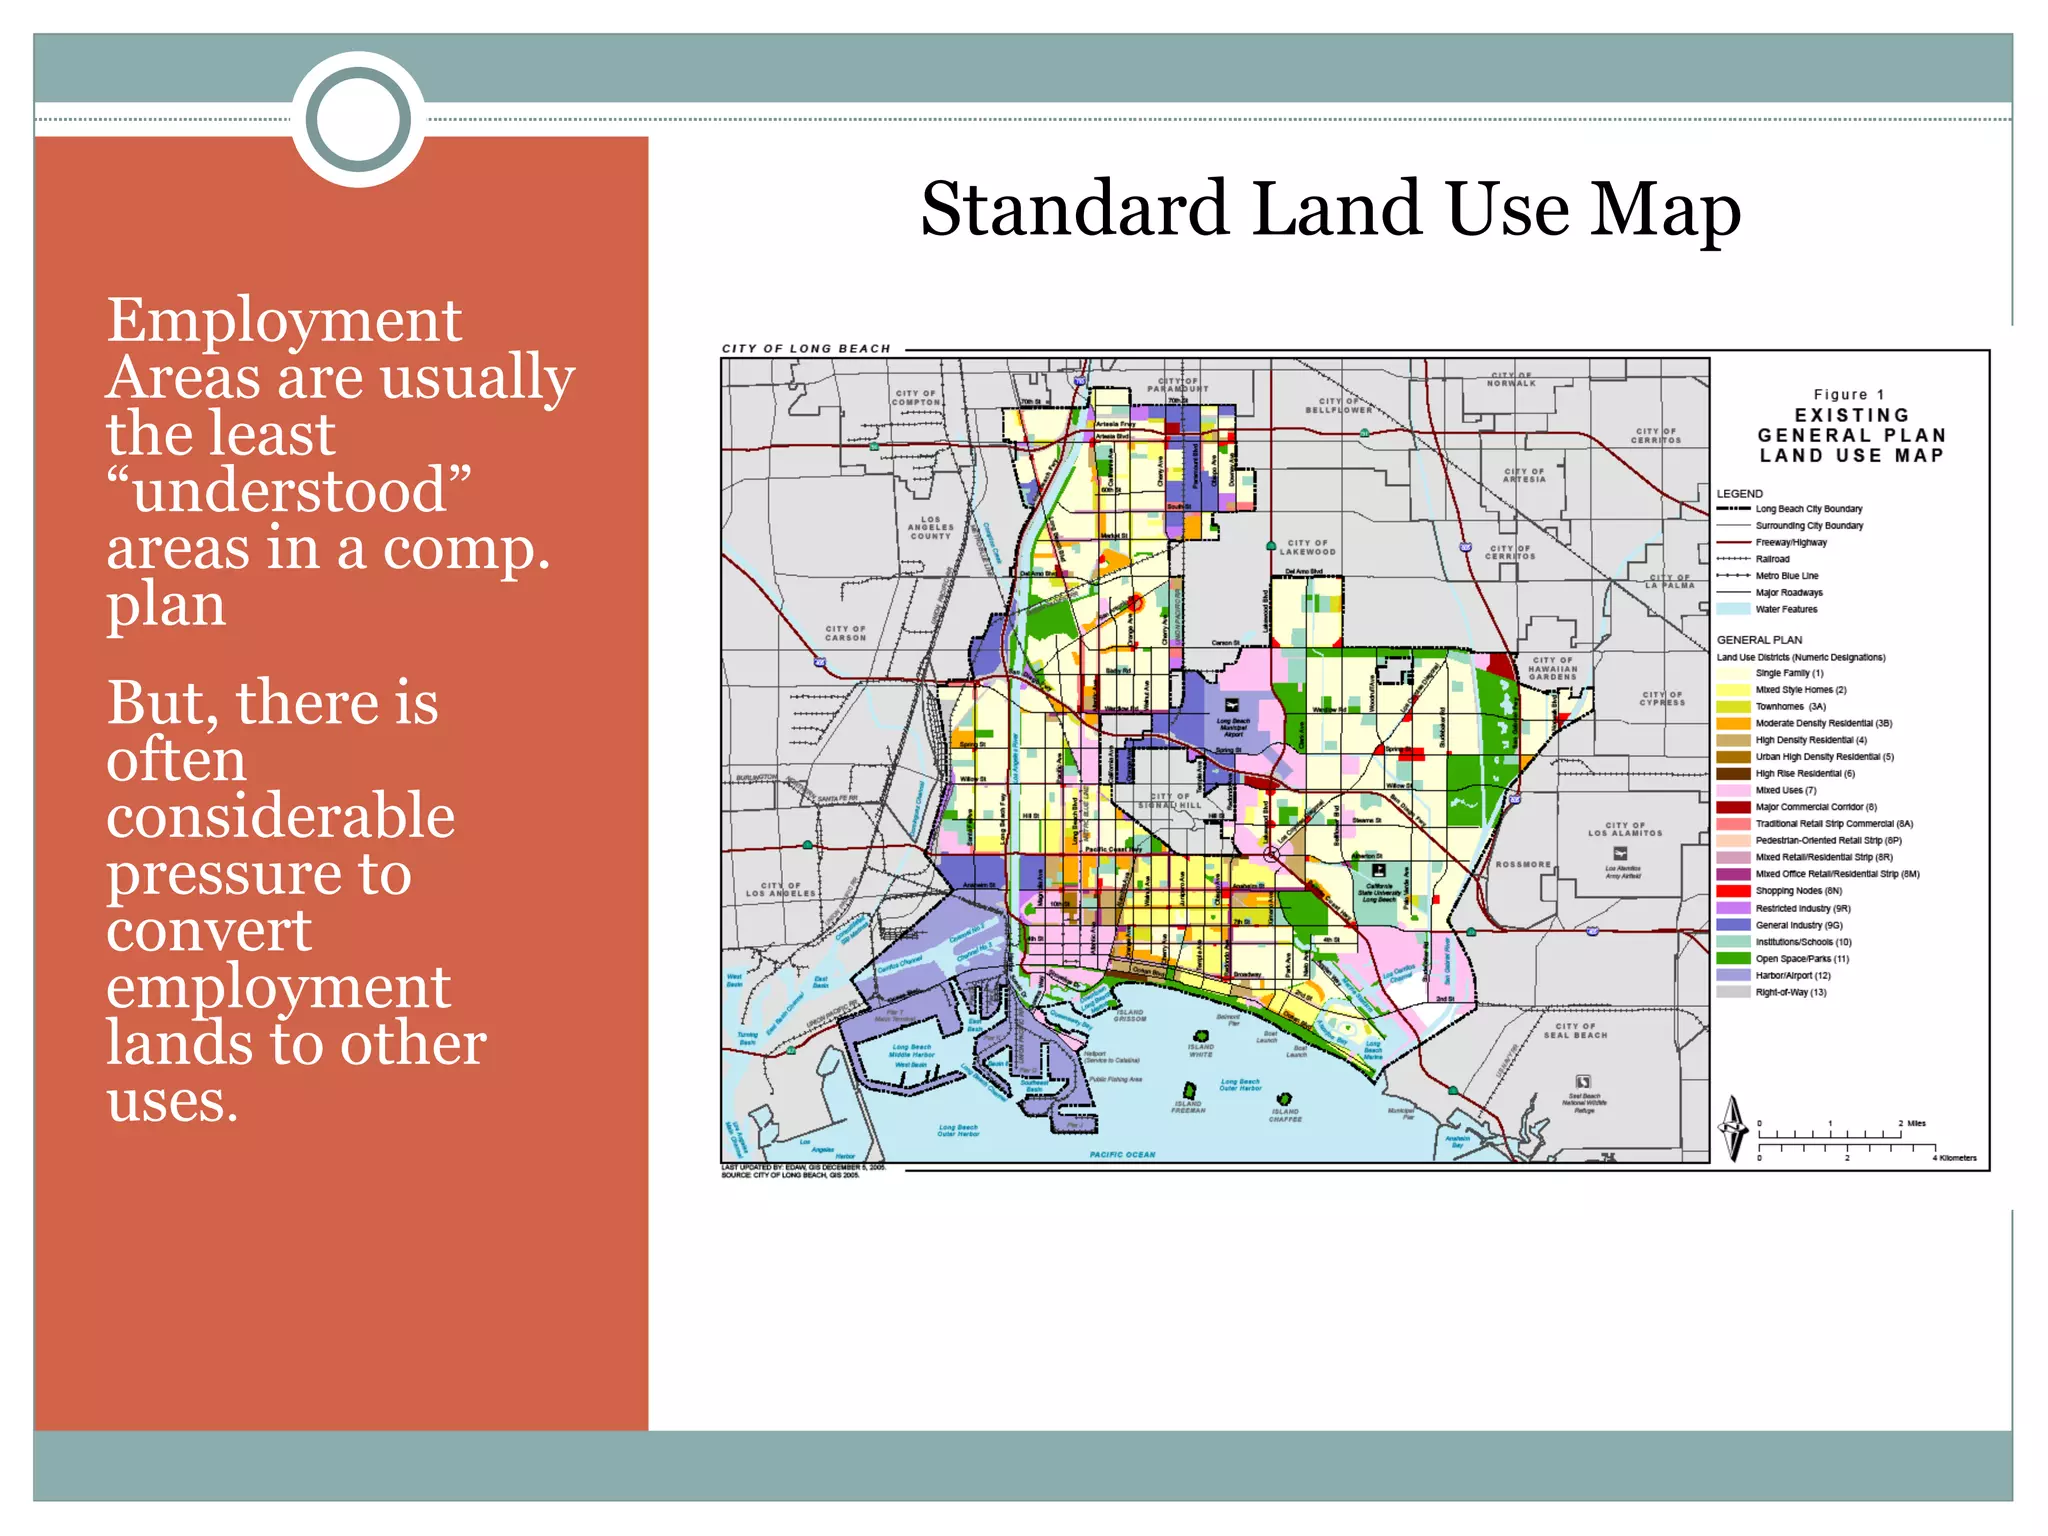
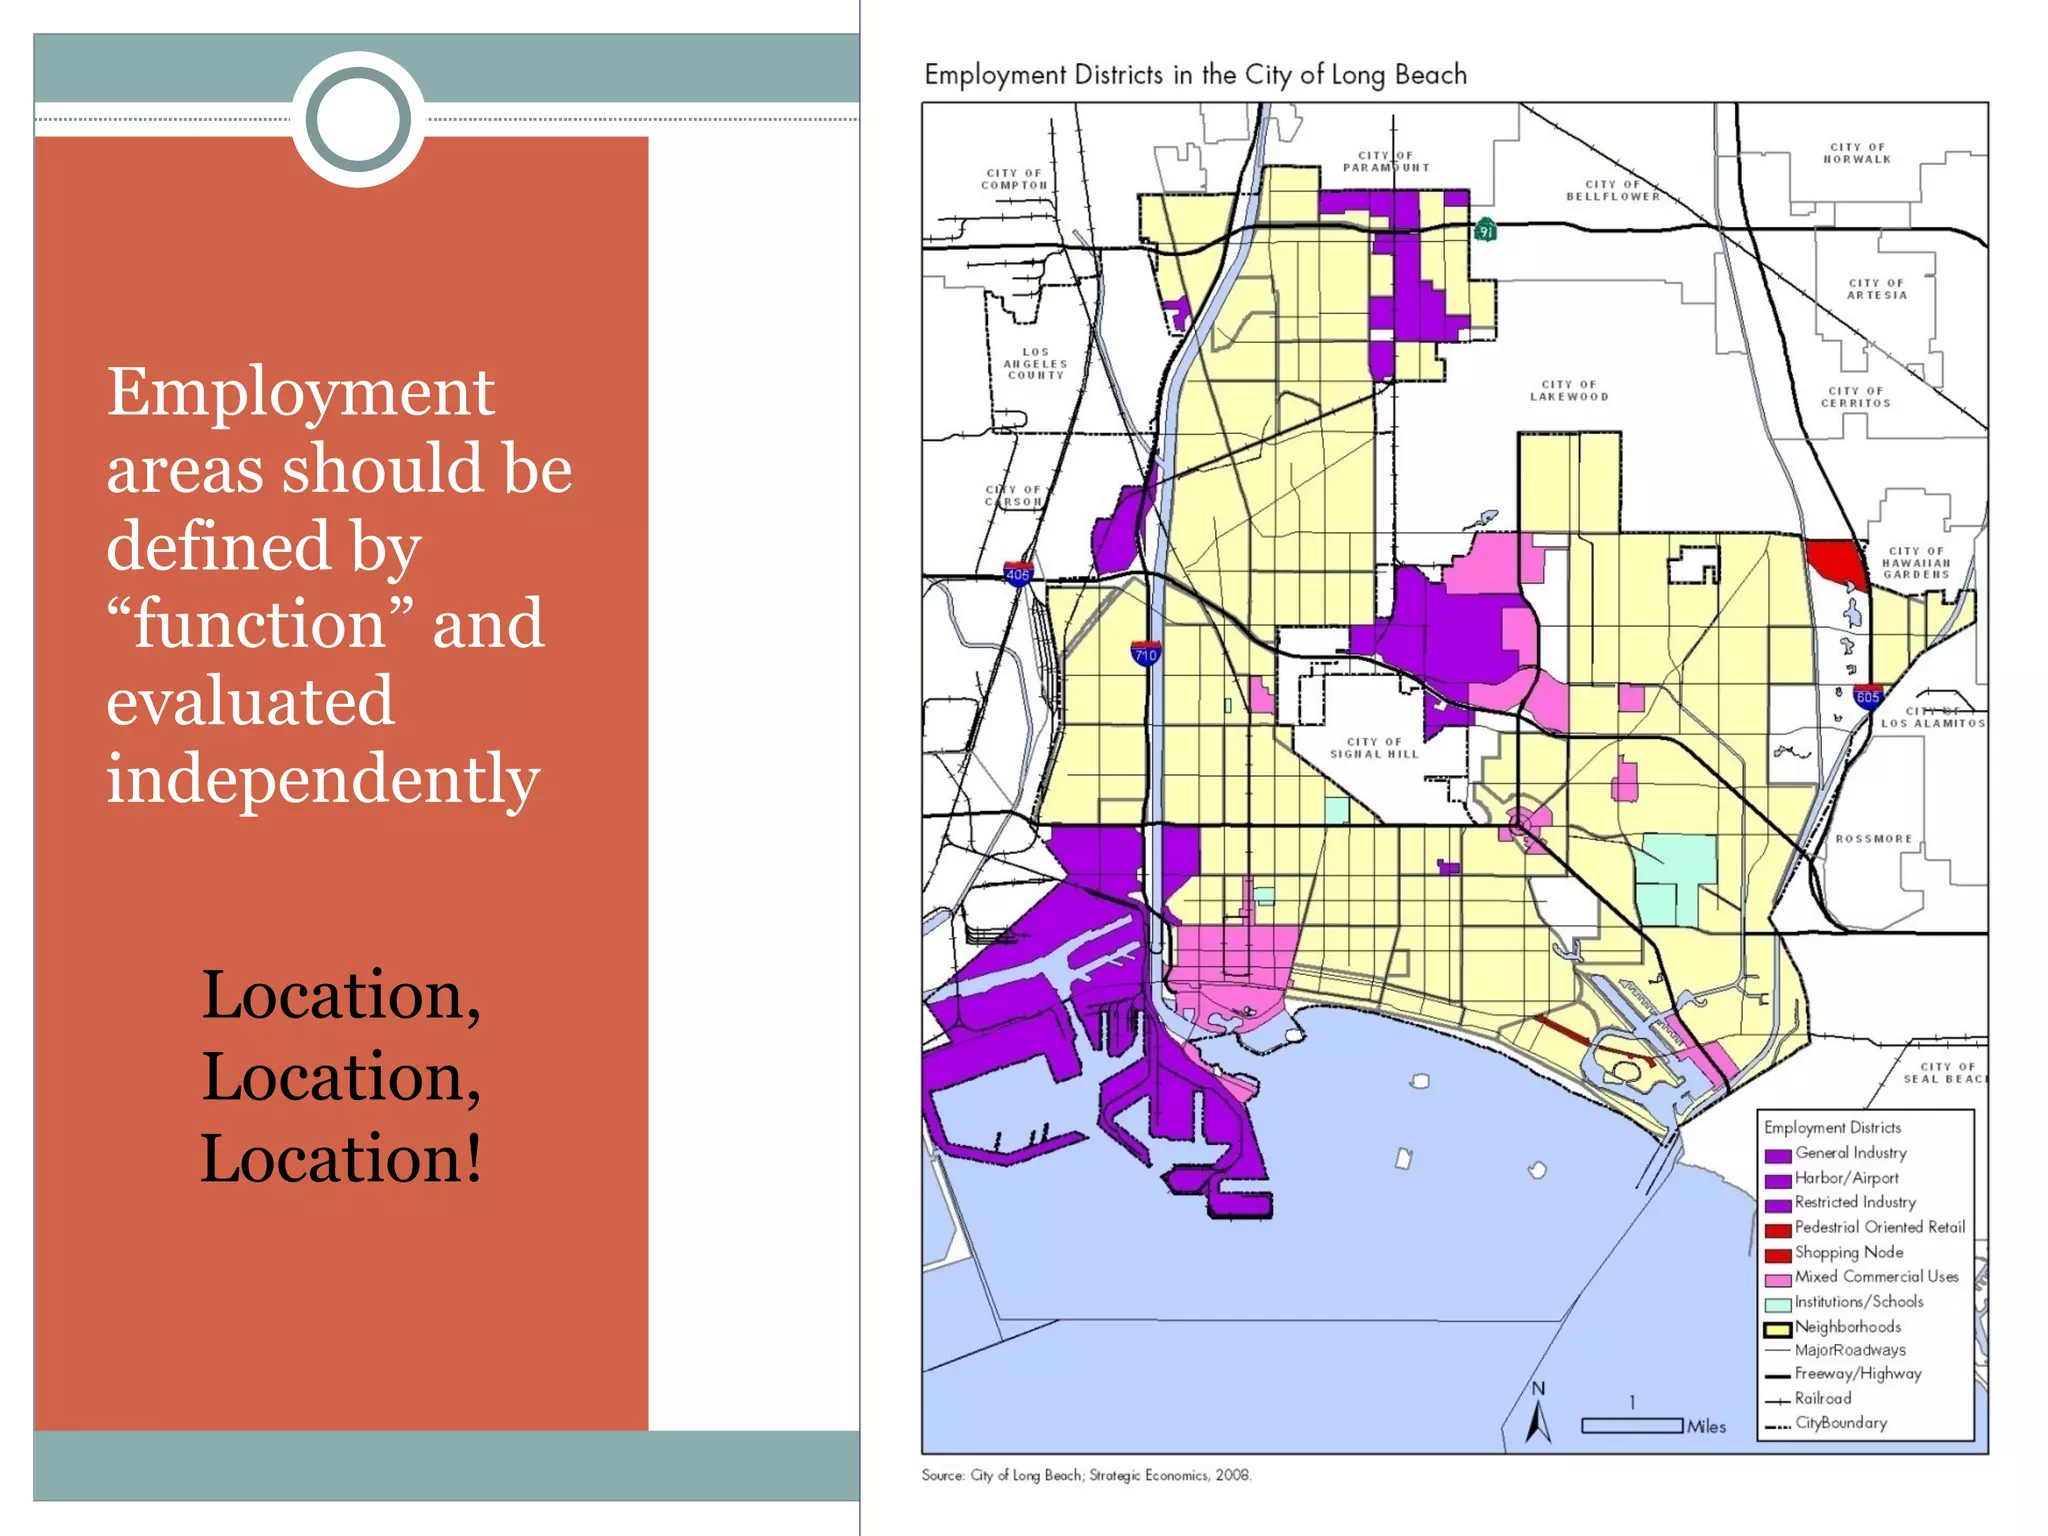
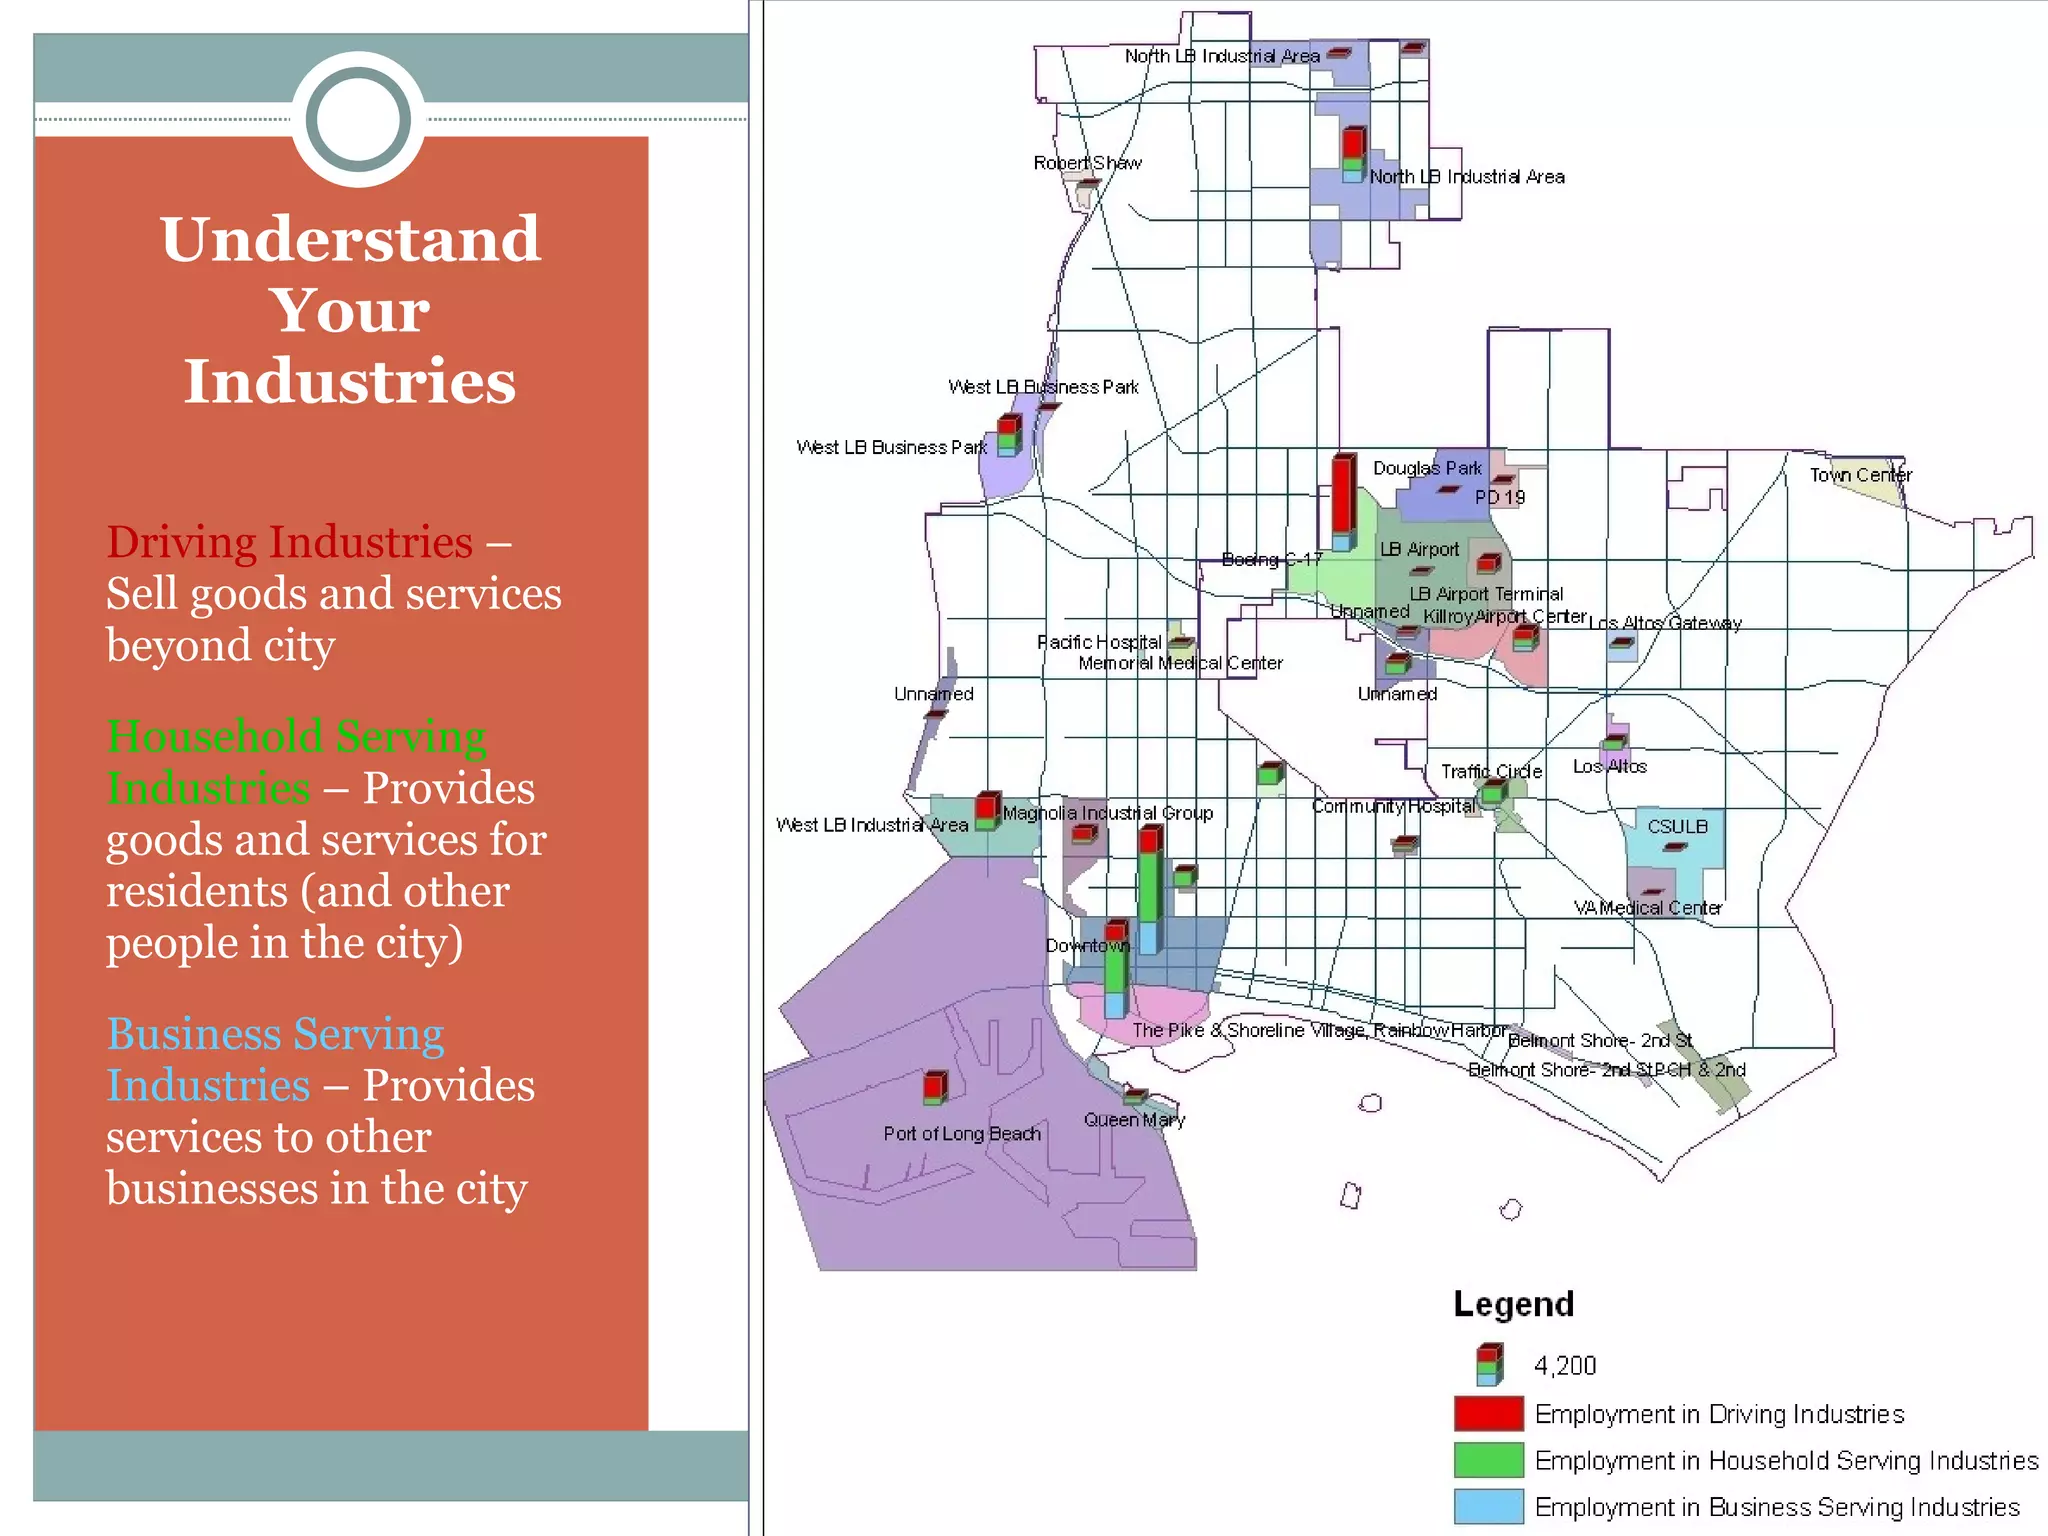
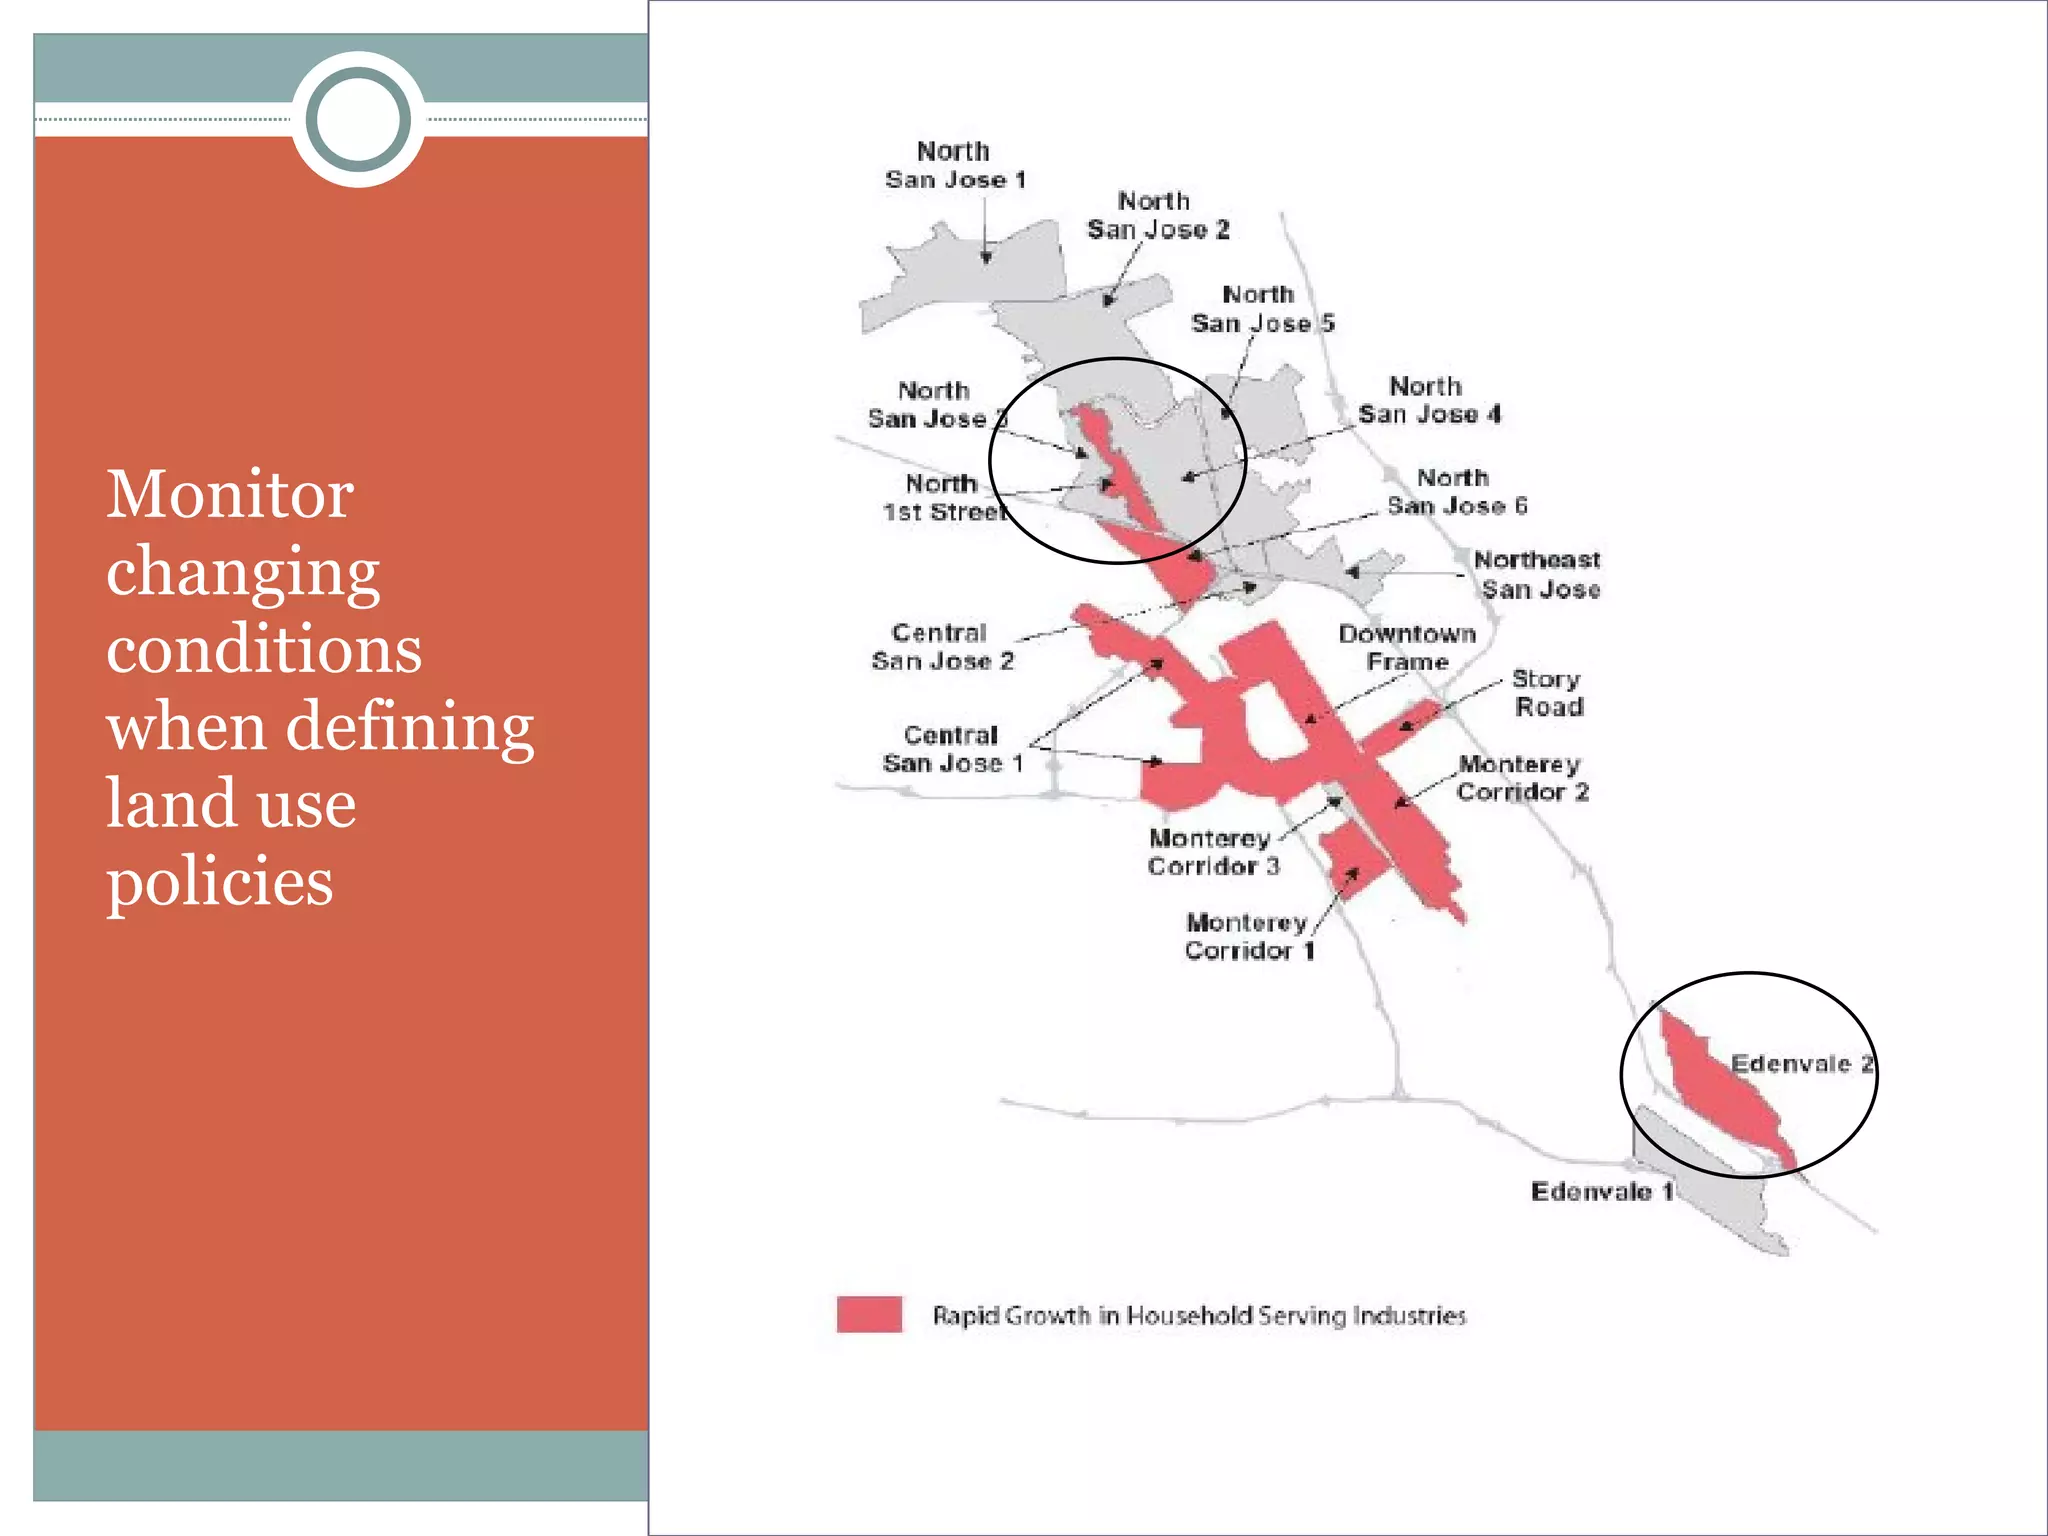

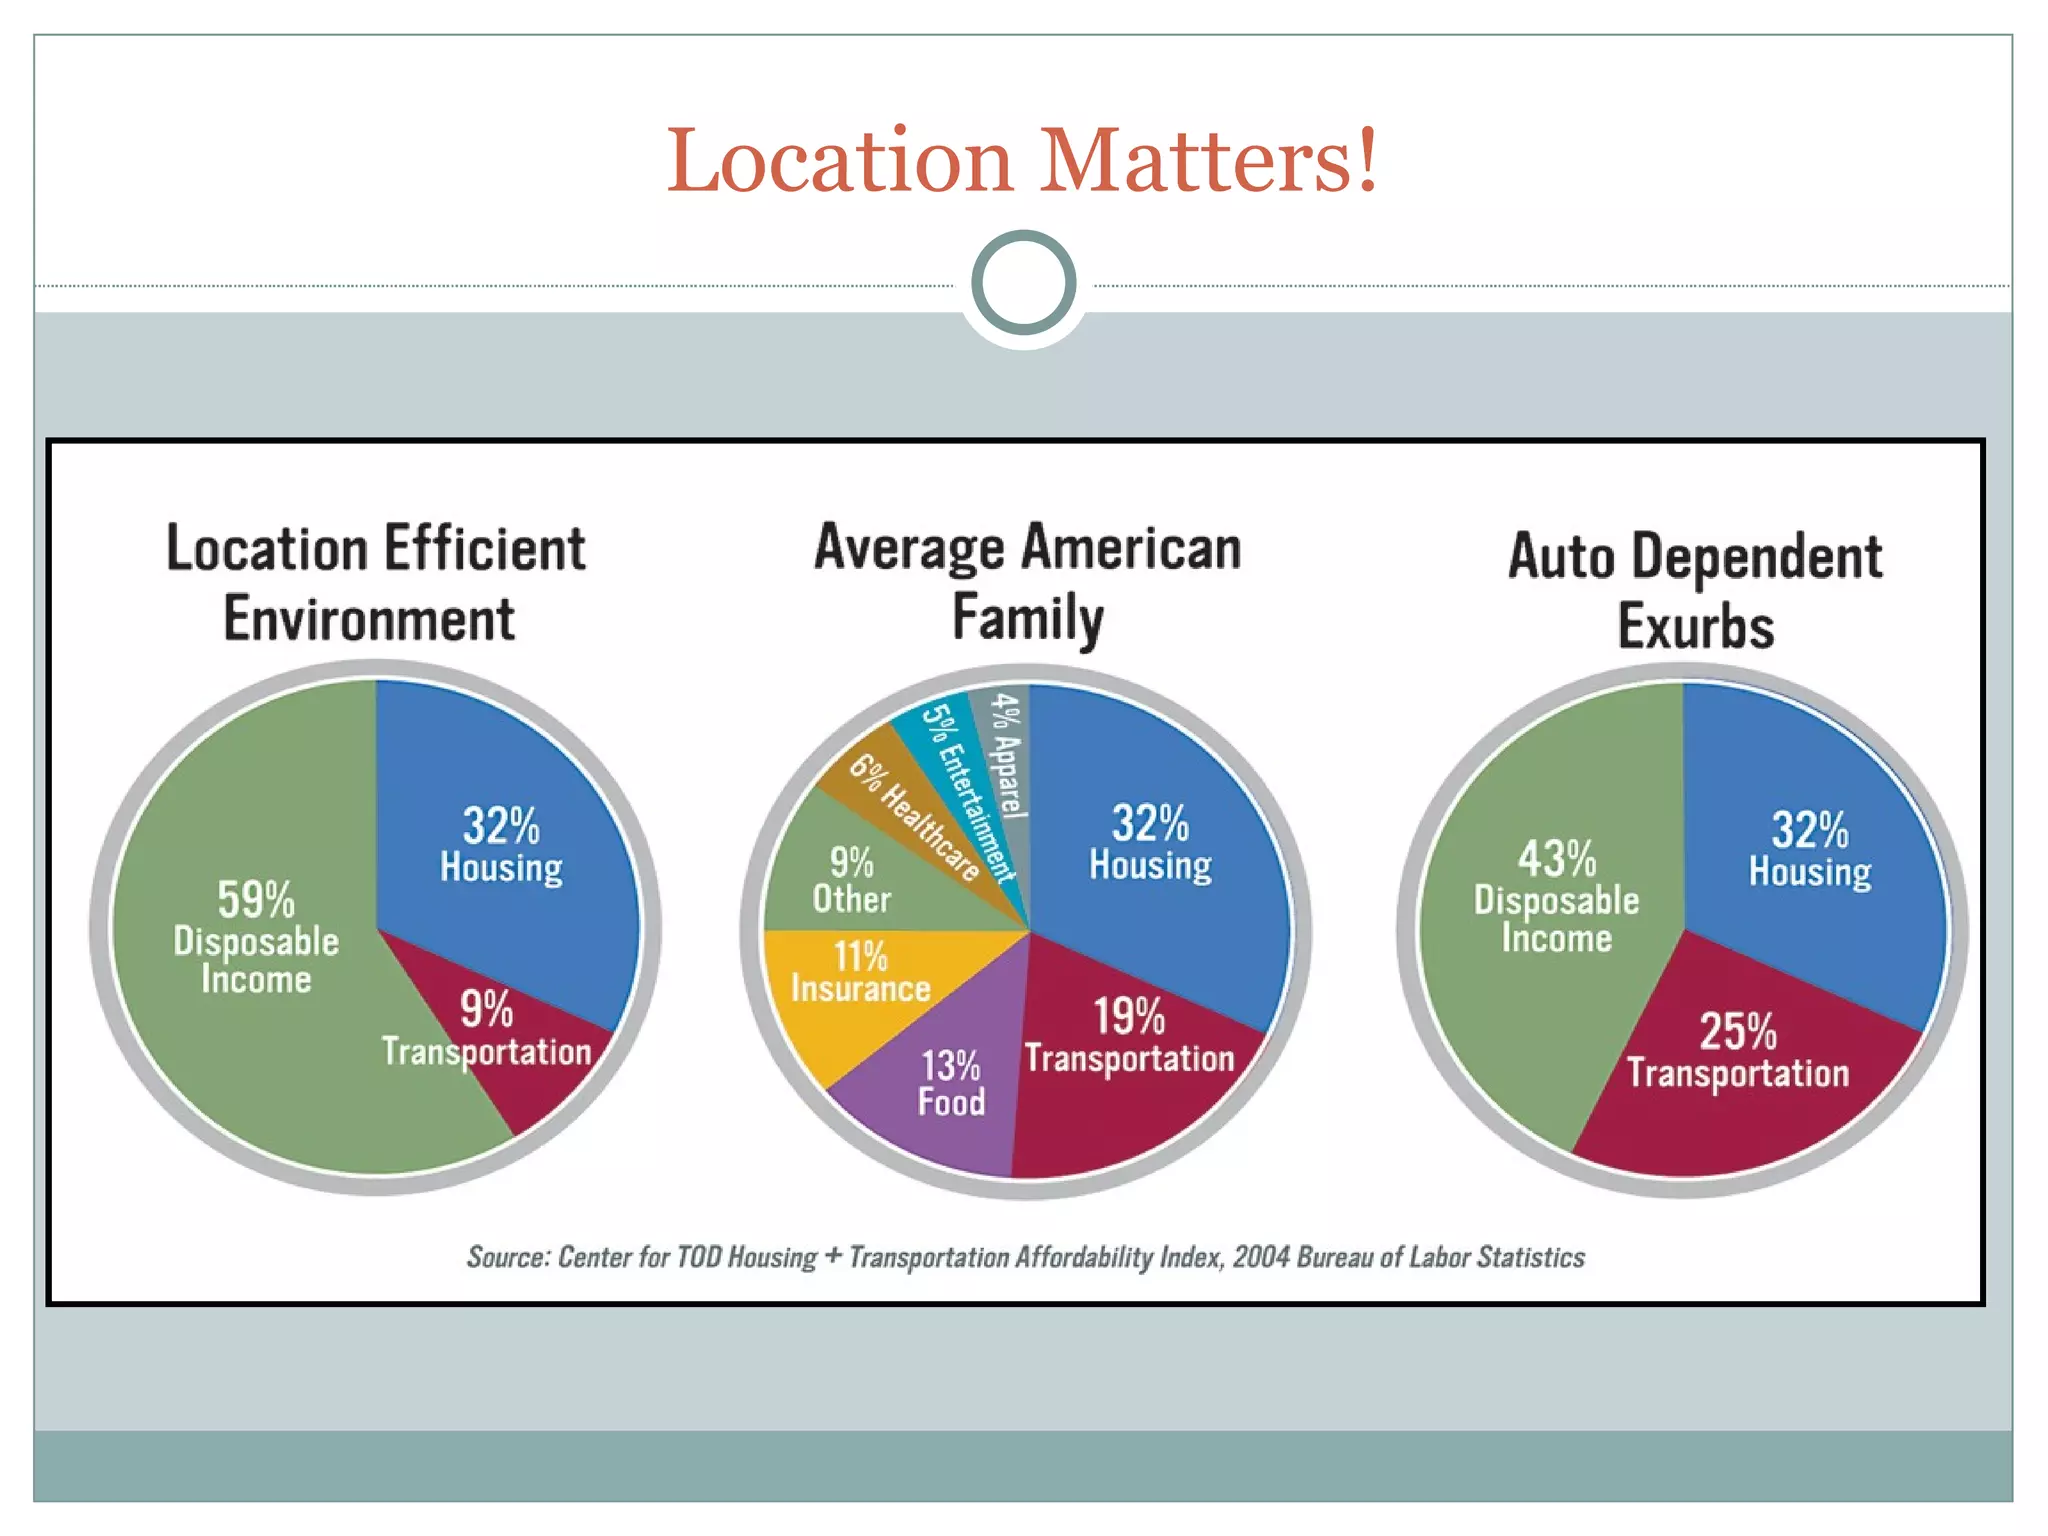


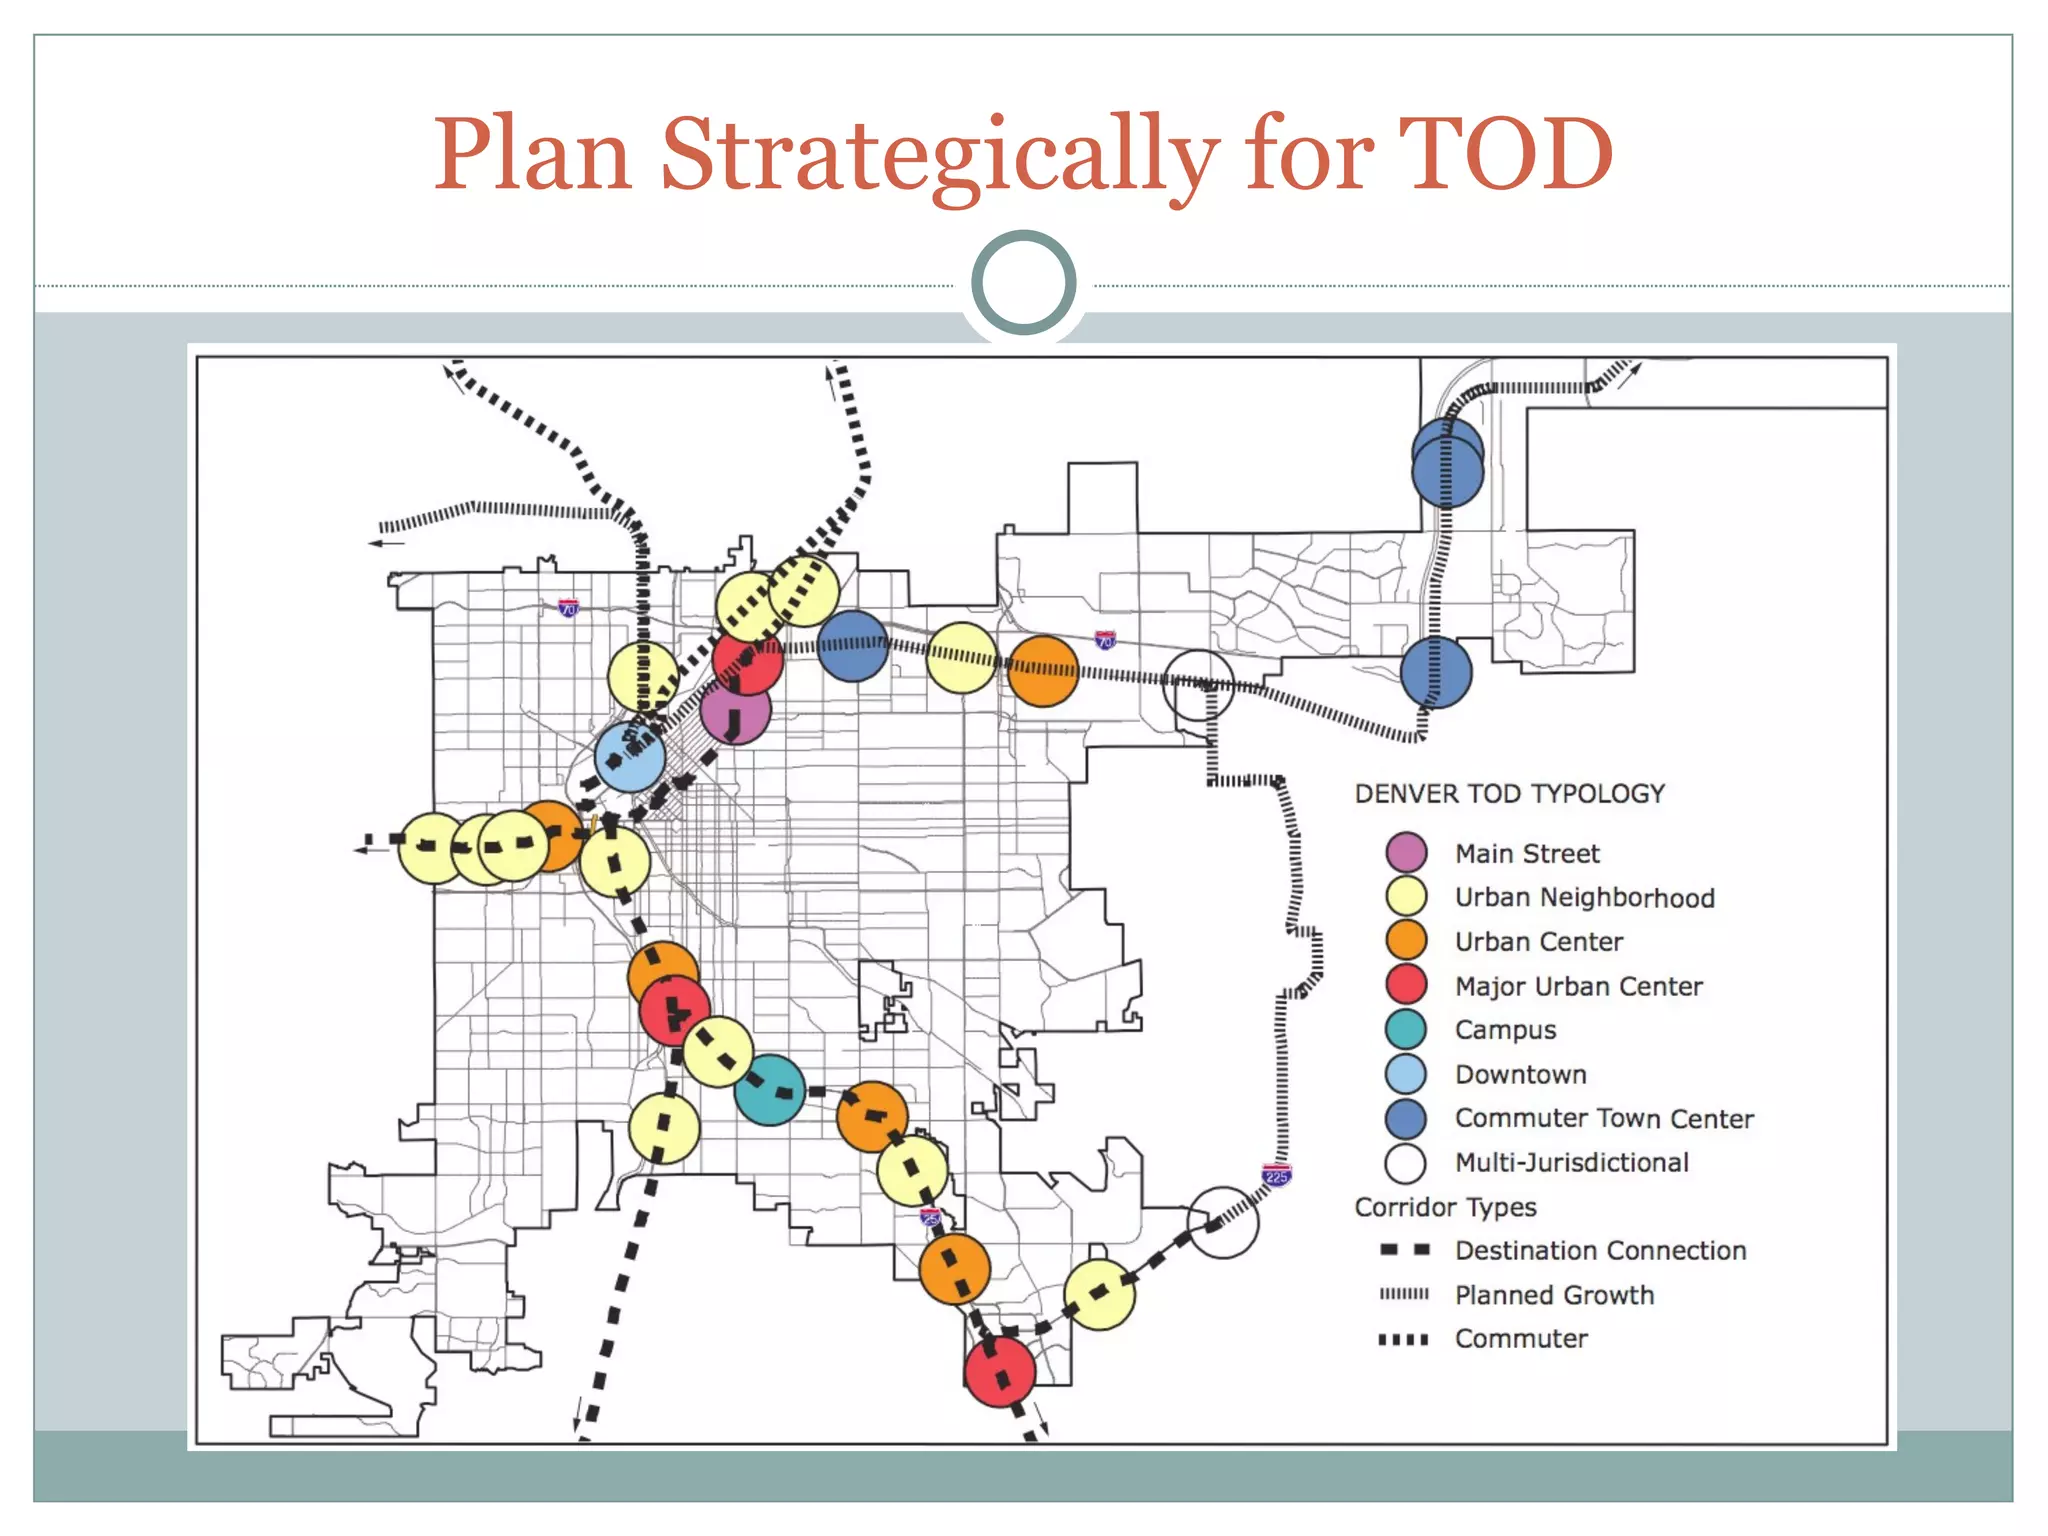


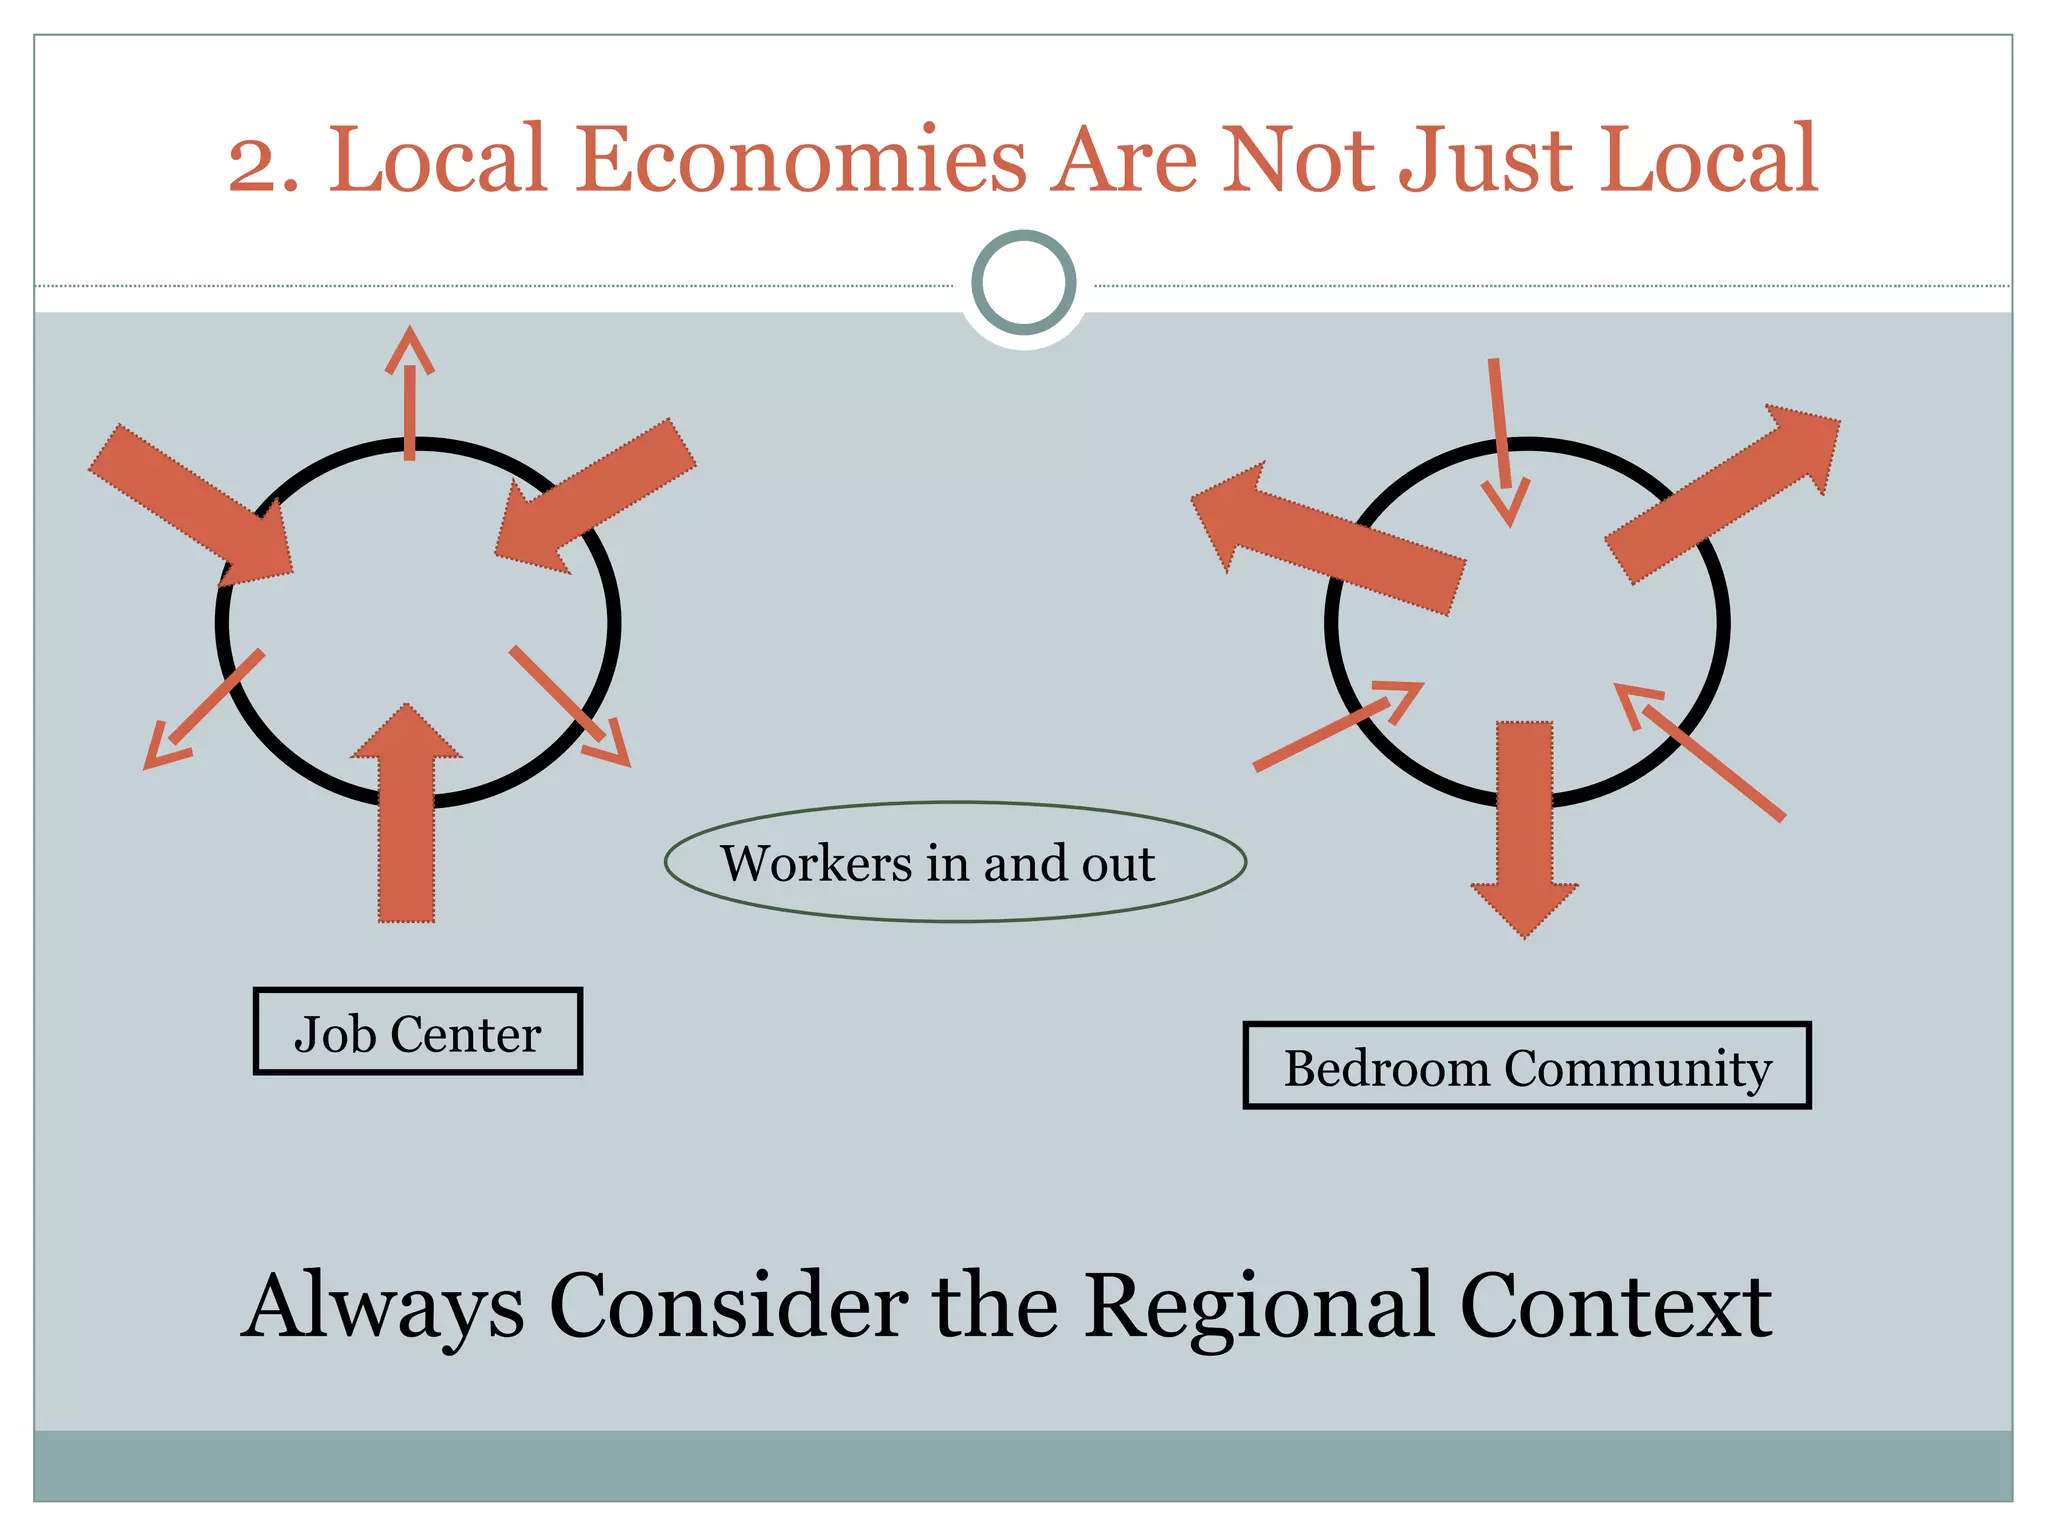


This document discusses how understanding demographic and economic forces is important for comprehensive planning. It provides an overview of key demographic trends like changing household structures, a growing minority population, and an aging population. It also discusses the importance of evaluating the local economy by understanding key industries and how they may change. The document emphasizes that transportation must be considered as it influences the locations of jobs, housing, and economic activity. It concludes by providing four lessons for comprehensive planning: understand opportunities for change in the community; consider the regional economic context; use data to support land use policies; and plan for diverse demographics, industries, and transportation needs.


