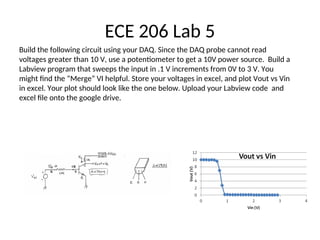
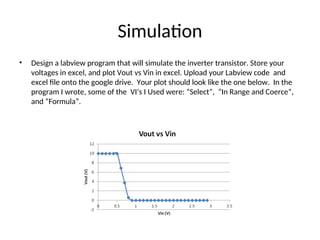
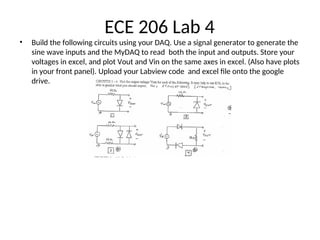
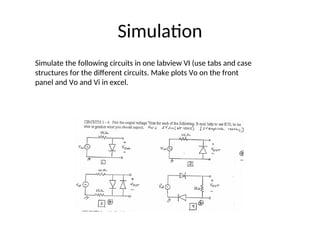
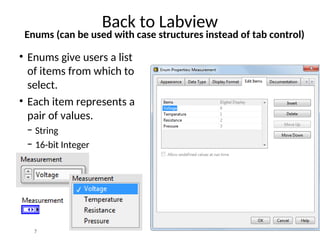
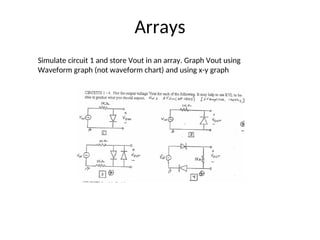
Week 3 Labview exercises
ECE 206 Lab 5
Build the following circuit using your DAQ. Since the DAQ probe cannot read
voltages greater than 10 V, use a potentiometer to get a 10V power source. Build a
Labview program that sweeps the input in .1 V increments from 0V to 3 V. You
might find the “Merge” VI helpful. Store your voltages in excel, and plot Vout vs Vin
in excel. Your plot should look like the one below. Upload your Labview code and
excel file onto the google drive.
Simulation
• Design a labview program that will simulate the inverter transistor. Store your
voltages in excel, and plot Vout vs Vin in excel. Upload your Labview code and
excel file onto the google drive. Your plot should look like the one below. In the
program I wrote, some of the VI’s I Used were: “Select”, “In Range and Coerce”,
and “Formula”.
ECE 206 Lab 4
• Build the following circuits using your DAQ. Use a signal generator to generate the
sine wave inputs and the MyDAQ to read both the input and outputs. Store your
voltages in excel, and plot Vout and Vin on the same axes in excel. (Also have plots
in your front panel). Upload your Labview code and excel file onto the google
drive.
Dynamic Data
• Watch video to help with graphing
Simulation
Simulate the following circuits in one labview VI (use tabs and case
structures for the different circuits. Make plots Vo on the front
panel and Vo and Vi in excel.
Back to Labview
Enums (can be used with case structures instead of tab control)
• Enums give users a list
of items from which to
select.
• Each item represents a
pair of values.
− String
− 16-bit Integer
7
• Watch the video
• Do the diode of the previous slide but instead
of using tabs use enums
Documenting Block Diagram Code
Owned labels:
– Explain data contents
of wires and objects.
– Move with object.
– Have transparent
backgrounds.
– Select Visible
Items»Label from the
shortcut menu to
create.
9
Free labels:
– Describe algorithms.
– Have pale yellow
backgrounds.
– Double-click in any
open space to
create.
Arrays
An array:
– Is a collection of data
elements that are of same
type.
– Has one or more
dimensions.
– Contains up to (231
)–1
elements per dimension,
memory permitting.
– Accesses elements by its
index.
Note: The first element is
index 0.
10
ID array
One row of 10-elements
1.2 3.2 8.2 8.0 4.8 5.1 6.0 1.0 2.5 1.7
0 1 2 3 4 5 6 7 8 9
2D array
Five-row by seven-column table of 35
elements
0 1 2 3 4 5 6
0
1
2
3
4
Arrays – 1D and 2D Examples
Index
numbers
11
Viewing Arrays on the Front Panel
The element selected in the index display always refers
to the element shown in the upper-left corner of the
element display.
First element
at index 1
Second
element at
index 2
The elements at
index 0 are not
shown because
element 1 is
selected in the
index display.
12
Creating an Array Control
For a new array:
1. Select an Array control from the
Controls palette on the front panel.
2. Place a data object, such as a
numeric control, into the array
shell.
3. Add a second dimension, if necessary, by
resizing the index.
From a block diagram terminal or wire:
1. Right-click the object and select
Create»Control or Create»Indicator.
13
2D Arrays
– 2D arrays:
• Store elements in a grid.
• Require a column index and a row index to locate an
element, both of which are zero-based.
– Create a multidimensional array on the front
panel by right-clicking the index display and
selecting Add Dimension from the shortcut menu.
– Resize the index display until you have as many
dimensions as you want.
14
Auto-Indexing
Wire becomes thicker
Wire remains the same
size
Auto-Indexing Disabled
Auto-Indexing Enabled
Only one value (last
iteration) is passed out of
the loop
1D Array
0 1 2 3 4 5
– Allows For Loops and
While Loops to accumulate
arrays at their boundaries.
– Is the default behavior for
For Loops.
– Is disabled by default for
While Loops.
– Is enabled/disabled by
right-clicking on a tunnel.
– Produces arrays that are
always equal in size to the
number of iterations of the
loop.
15
Waveform Graph
– Is a graphical display of
data.
– Displays one or more
plots of evenly sampled
measurements.
– Is used to plot pre-
generated arrays of
data.
– Can display plots with
any number of data
points.
16
Charts vs. Graphs – Single-Plot
17
Auto-Indexing with a Conditional
Tunnel
Right-click on a tunnel and
select Tunnel
Mode»Conditional.
18
• Inner loop creates column elements.
• Outer loop stacks column elements into rows.
Creating 2D Arrays
1D Array
0 1 2 3 4 5
2D Array
19
Arrays
Simulate circuit 1 and store Vout in an array. Graph Vout using
Waveform graph (not waveform chart) and using x-y graph
Understanding Modularity – SubVIs
• SubVIs correspond to subroutines in text-based
programming languages.
• The upper-right corner of the front panel and
block diagram displays the icon for the VI.
• This icon identifies the VI when you place the VI
on a block diagram.
21
Understanding Modularity – SubVIs
Repeated code can become subVIs.
22
Understanding Modularity – SubVIs
23
Understanding Modularity – SubVIs
Function Code Calling Program Code
function average (in1, in2,
out)
{
out = (in1 + in2)/2.0;
}
main
{
average (point1, point2,
pointavg)
}
SubVI Block Diagram Calling VI Block Diagram
24
B. Icon
Characteristics of a Good Icon
Using the Icon Editor
25
Icon
– An icon is a graphical representation of a VI.
– If you use a VI as a subVI, the icon identifies the
subVI on the block diagram of the VI.
26
Characteristics of a Good Icon
Good icons convey the functionality of the VI using:
• Relevant graphics
• Descriptive text, if necessary
27
Creating Icons - Icon Editor
Open the Icon Editor using one of these methods:
• Right-click the icon in the upper-right corner of the
front panel or block diagram and select Edit Icon.
• Double-click the icon.
28
Icon Editor
Use the editing tools to modify an icon manually.
29
Icon Editor
Use the Glyphs tab to display glyphs you can include in
the icon.
30
Icon Editor
Use the Icon Text tab to specify the text to display in
the icon.
31
Icon Editor
• Use the Templates tab to display icon templates you can
use as a background for the icon.
32
C. Connector Pane
Patterns
Standards
33
Connector Pane
– The connector pane is
displayed next to the icon
in the upper right corner of
the front panel.
• Each rectangle on the
connector pane represents
a terminal.
• Use the terminals to assign
inputs and outputs.
– Select a different pattern
by right-clicking the
connector pane and
selecting Patterns from the
shortcut menu.
34
Connector Pane – Standards
– Use this connector pane layout as a standard.
– Top terminals are usually reserved for references,
such as a file reference.
– Bottom terminals are
usually reserved for
error clusters.
35
D. Using SubVIs
Using on Block Diagram
Terminal Settings
Handling Errors
Creating from a Section of Block Diagram
36
Using SubVIs
• Options to place a subVI on the block diagram:
– Drag the VI from the Project Explorer to the block
diagram.
– Click Select a VI on the Functions palette and then
navigate to the VI.
– Drag the icon from an open VI to the block
diagram of another VI.
37
SubVI
Define a subVI called diode which outputs .7V for Vi1>Vi2 and
outputs Vi1-Vi2 for Vi1<Vi2. Simulate the circuits below and graph
Vout using Waveform graph (not waveform chart) and using x-y
graph. Your program may or may not correspond to the circuit.

LABVIEW create graphical software programming

  • 1.
    Week 3 Labviewexercises
  • 2.
    ECE 206 Lab5 Build the following circuit using your DAQ. Since the DAQ probe cannot read voltages greater than 10 V, use a potentiometer to get a 10V power source. Build a Labview program that sweeps the input in .1 V increments from 0V to 3 V. You might find the “Merge” VI helpful. Store your voltages in excel, and plot Vout vs Vin in excel. Your plot should look like the one below. Upload your Labview code and excel file onto the google drive.
  • 3.
    Simulation • Design alabview program that will simulate the inverter transistor. Store your voltages in excel, and plot Vout vs Vin in excel. Upload your Labview code and excel file onto the google drive. Your plot should look like the one below. In the program I wrote, some of the VI’s I Used were: “Select”, “In Range and Coerce”, and “Formula”.
  • 4.
    ECE 206 Lab4 • Build the following circuits using your DAQ. Use a signal generator to generate the sine wave inputs and the MyDAQ to read both the input and outputs. Store your voltages in excel, and plot Vout and Vin on the same axes in excel. (Also have plots in your front panel). Upload your Labview code and excel file onto the google drive.
  • 5.
    Dynamic Data • Watchvideo to help with graphing
  • 6.
    Simulation Simulate the followingcircuits in one labview VI (use tabs and case structures for the different circuits. Make plots Vo on the front panel and Vo and Vi in excel.
  • 7.
    Back to Labview Enums(can be used with case structures instead of tab control) • Enums give users a list of items from which to select. • Each item represents a pair of values. − String − 16-bit Integer 7
  • 8.
    • Watch thevideo • Do the diode of the previous slide but instead of using tabs use enums
  • 9.
    Documenting Block DiagramCode Owned labels: – Explain data contents of wires and objects. – Move with object. – Have transparent backgrounds. – Select Visible Items»Label from the shortcut menu to create. 9 Free labels: – Describe algorithms. – Have pale yellow backgrounds. – Double-click in any open space to create.
  • 10.
    Arrays An array: – Isa collection of data elements that are of same type. – Has one or more dimensions. – Contains up to (231 )–1 elements per dimension, memory permitting. – Accesses elements by its index. Note: The first element is index 0. 10
  • 11.
    ID array One rowof 10-elements 1.2 3.2 8.2 8.0 4.8 5.1 6.0 1.0 2.5 1.7 0 1 2 3 4 5 6 7 8 9 2D array Five-row by seven-column table of 35 elements 0 1 2 3 4 5 6 0 1 2 3 4 Arrays – 1D and 2D Examples Index numbers 11
  • 12.
    Viewing Arrays onthe Front Panel The element selected in the index display always refers to the element shown in the upper-left corner of the element display. First element at index 1 Second element at index 2 The elements at index 0 are not shown because element 1 is selected in the index display. 12
  • 13.
    Creating an ArrayControl For a new array: 1. Select an Array control from the Controls palette on the front panel. 2. Place a data object, such as a numeric control, into the array shell. 3. Add a second dimension, if necessary, by resizing the index. From a block diagram terminal or wire: 1. Right-click the object and select Create»Control or Create»Indicator. 13
  • 14.
    2D Arrays – 2Darrays: • Store elements in a grid. • Require a column index and a row index to locate an element, both of which are zero-based. – Create a multidimensional array on the front panel by right-clicking the index display and selecting Add Dimension from the shortcut menu. – Resize the index display until you have as many dimensions as you want. 14
  • 15.
    Auto-Indexing Wire becomes thicker Wireremains the same size Auto-Indexing Disabled Auto-Indexing Enabled Only one value (last iteration) is passed out of the loop 1D Array 0 1 2 3 4 5 – Allows For Loops and While Loops to accumulate arrays at their boundaries. – Is the default behavior for For Loops. – Is disabled by default for While Loops. – Is enabled/disabled by right-clicking on a tunnel. – Produces arrays that are always equal in size to the number of iterations of the loop. 15
  • 16.
    Waveform Graph – Isa graphical display of data. – Displays one or more plots of evenly sampled measurements. – Is used to plot pre- generated arrays of data. – Can display plots with any number of data points. 16
  • 17.
    Charts vs. Graphs– Single-Plot 17
  • 18.
    Auto-Indexing with aConditional Tunnel Right-click on a tunnel and select Tunnel Mode»Conditional. 18
  • 19.
    • Inner loopcreates column elements. • Outer loop stacks column elements into rows. Creating 2D Arrays 1D Array 0 1 2 3 4 5 2D Array 19
  • 20.
    Arrays Simulate circuit 1and store Vout in an array. Graph Vout using Waveform graph (not waveform chart) and using x-y graph
  • 21.
    Understanding Modularity –SubVIs • SubVIs correspond to subroutines in text-based programming languages. • The upper-right corner of the front panel and block diagram displays the icon for the VI. • This icon identifies the VI when you place the VI on a block diagram. 21
  • 22.
    Understanding Modularity –SubVIs Repeated code can become subVIs. 22
  • 23.
  • 24.
    Understanding Modularity –SubVIs Function Code Calling Program Code function average (in1, in2, out) { out = (in1 + in2)/2.0; } main { average (point1, point2, pointavg) } SubVI Block Diagram Calling VI Block Diagram 24
  • 25.
    B. Icon Characteristics ofa Good Icon Using the Icon Editor 25
  • 26.
    Icon – An iconis a graphical representation of a VI. – If you use a VI as a subVI, the icon identifies the subVI on the block diagram of the VI. 26
  • 27.
    Characteristics of aGood Icon Good icons convey the functionality of the VI using: • Relevant graphics • Descriptive text, if necessary 27
  • 28.
    Creating Icons -Icon Editor Open the Icon Editor using one of these methods: • Right-click the icon in the upper-right corner of the front panel or block diagram and select Edit Icon. • Double-click the icon. 28
  • 29.
    Icon Editor Use theediting tools to modify an icon manually. 29
  • 30.
    Icon Editor Use theGlyphs tab to display glyphs you can include in the icon. 30
  • 31.
    Icon Editor Use theIcon Text tab to specify the text to display in the icon. 31
  • 32.
    Icon Editor • Usethe Templates tab to display icon templates you can use as a background for the icon. 32
  • 33.
  • 34.
    Connector Pane – Theconnector pane is displayed next to the icon in the upper right corner of the front panel. • Each rectangle on the connector pane represents a terminal. • Use the terminals to assign inputs and outputs. – Select a different pattern by right-clicking the connector pane and selecting Patterns from the shortcut menu. 34
  • 35.
    Connector Pane –Standards – Use this connector pane layout as a standard. – Top terminals are usually reserved for references, such as a file reference. – Bottom terminals are usually reserved for error clusters. 35
  • 36.
    D. Using SubVIs Usingon Block Diagram Terminal Settings Handling Errors Creating from a Section of Block Diagram 36
  • 37.
    Using SubVIs • Optionsto place a subVI on the block diagram: – Drag the VI from the Project Explorer to the block diagram. – Click Select a VI on the Functions palette and then navigate to the VI. – Drag the icon from an open VI to the block diagram of another VI. 37
  • 38.
    SubVI Define a subVIcalled diode which outputs .7V for Vi1>Vi2 and outputs Vi1-Vi2 for Vi1<Vi2. Simulate the circuits below and graph Vout using Waveform graph (not waveform chart) and using x-y graph. Your program may or may not correspond to the circuit.

Editor's Notes

  • #10 Arrays are lists of elements of the same data type. They are analogous to arrays in traditional languages. Arrays can have one or more dimensions. Arrays can have up to 2^31 elements per dimension. Actual array sizes that students can create is limited by memory. Elements are accessed by an index. The index ranges from 0 to N-1 (N = number of elements in the array). Arrays are zero-indexed (first element is zero) in each dimension. A 2D array is analogous to a spreadsheet or table. Example: If your data contains temperature readings and time stamps, one column is time values and the other column is readings. Be careful to specify the element you really want. Example: The first element in an array is array (0), not array(1).
  • #13 Creating array controls in LabVIEW: You can place any data type in an array shell except an array. You cannot have an array of arrays; use a 2D array instead. Emphasize that this is a two-step process. Students often place only empty array shells on the front panel. Remind them they must place a data type inside the array shell. Demonstrate the following on your computer: Create a numeric array. Point out index and data object components. Show how to create a 2D array. Show how to display multiple array elements. Show that index elements always reference the upper-leftmost object in the array display. Show how elements in an array are initially grayed out, indicating that a portion of the array has not been defined.
  • #15 For Loops and While Loops can index and accumulate arrays at their boundaries. This is known as auto-indexing. The indexing point on the boundary is called a tunnel. The For Loop default is auto-indexing enabled. The While Loop default is auto-indexing disabled. Only one value (the last iteration) is passed out of the While Loop by default. Examples: Enable auto-indexing to collect values within the loop and build the array. All values are placed in the array upon exiting the loop. Disable auto-indexing if you are interested only in the final value.
  • #18 You can determine what values LabVIEW writes to the loop output tunnel based on a condition you specify by right-clicking the loop output tunnel and selecting Tunnel Mode»Conditional from the shortcut menu. Because of the conditional tunnel, the Values less than 5 array contains only the elements 2, 0, 3, and 1 after this loop completes all iterations.
  • #19 You can use two nested For Loops to create a 2D array. Auto-indexing must be enabled for both loops. Explain the different line thicknesses in the wire connecting the Random Number function to the 2D Array Indicator. Demonstrate on your computer: How to change indexing and line thickness. When you see Enable indexing in the shortcut menu it means that indexing is currently disabled. The menu choice is the opposite of the current indexing mode. Students get confused about this feature.
  • #24 Every VI displays an icon in the upper-right corner of the front panel and block diagram windows. The icon is a graphical representation of a VI and identifies the subVI on the block diagram of the calling VI. The icon and connector pane correspond to the function prototype in text-based programming languages.
  • #28 After you build a VI, customize the icon so you can identify the VI when you use it as a subVI on a block diagram. Create icons using the Icon Editor dialog box. Alternatively, you can drag a graphic file, such as a .bmp or .jpg, from your file system to the icon in the upper-right corner of the VI.