Download as PDF, PPTX


![FLAP M4.6 Hyperbolic functions and differentiation
COPYRIGHT © 1998 THE OPEN UNIVERSITY S570 V1.1
Question R1
(a) Write down the Taylor expansion of ex about x = 0.
(b) Write down the solutions of the quadratic equation x02 − ax + 1 = 0 where a ≥ 2. Hence write down the
solutions of the equation e2w − a0ew + 1 = 0.
Question R2
Use your calculator to find the values of:
(a) arcsin1(1/3) and
1
sin(1 3)
,4(b) sin1[sin1(1/3)] and sin21(1/3).](https://image.slidesharecdn.com/2-diferensialhiperbolik-130509000507-phpapp02/85/2-diferensial-hiperbolik-8-320.jpg)

![FLAP M4.6 Hyperbolic functions and differentiation
COPYRIGHT © 1998 THE OPEN UNIVERSITY S570 V1.1
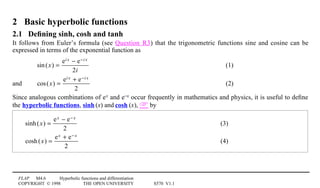
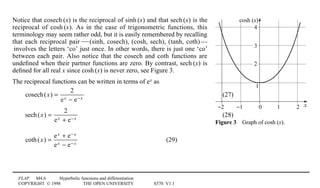
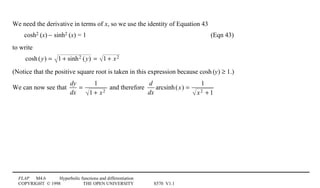
3.2 Inverse hyperbolic functions (and logarithmic forms)
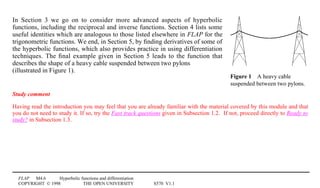
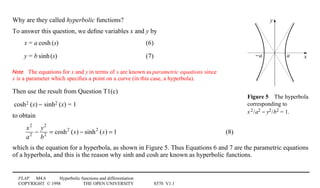
A common problem is to find what argument gives rise to a particular value of some hyperbolic function. For
example, if sinh1(x) = 3.6, what is the value of x? We can get an approximate value of x by looking at Figure 2.
3 Use Figure 2 to find the (approximate) value of x that corresponds to sinh1(x) = 3.6?
To answer such questions more precisely we need to know the inverse hyperbolic functions which ‘undo’ the
effect of the hyperbolic functions. These new functions are known as arcsinh, arctanh and arccosh, and the
first two functions are defined by
arcsinh1[sinh1(x)] = x (30)
arctanh1[tanh1(x)] = x (31)](https://image.slidesharecdn.com/2-diferensialhiperbolik-130509000507-phpapp02/85/2-diferensial-hiperbolik-29-320.jpg)
![FLAP M4.6 Hyperbolic functions and differentiation
COPYRIGHT © 1998 THE OPEN UNIVERSITY S570 V1.1
2
1
0
−1
−2
2 31 4 x
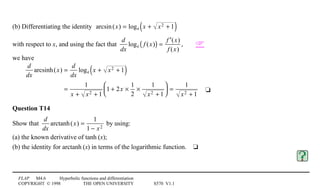
arccosh (x)
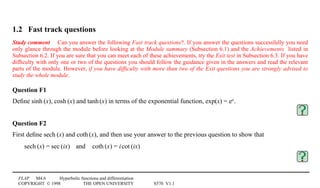
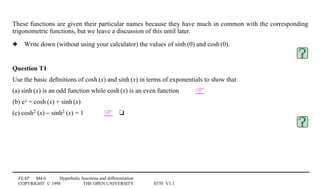
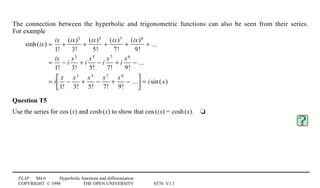
Figure 114Graph of arccosh1(x). Note that only
the solid line is involved in the definition.
Figure 11 shows the graph of the inverse function (the continuous
line), and as you can see we choose the positive value for
arccosh1(x), which gives
cosh1[arccosh1(x)] = x4for x ≥ 1 (32a)
3 (a) Simplify x2 and x( )2
. Do you need to place any
restrictions on the values of x in either case?
(b) Simplify arccosh1[cosh1( x )] and cosh1[arccosh1(x)].
Do you need to place any restrictions on the values of x in either
case?](https://image.slidesharecdn.com/2-diferensialhiperbolik-130509000507-phpapp02/85/2-diferensial-hiperbolik-32-320.jpg)
![FLAP M4.6 Hyperbolic functions and differentiation
COPYRIGHT © 1998 THE OPEN UNIVERSITY S570 V1.1
x
cosh (x)
0 1 2−1−2
2
1
3
4
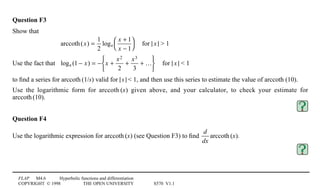
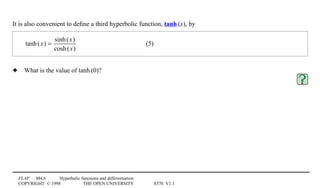
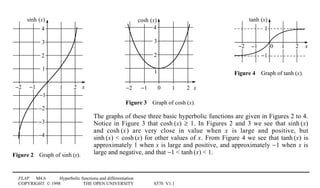
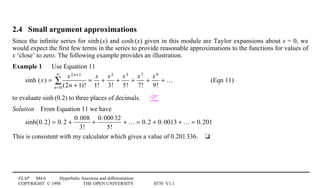
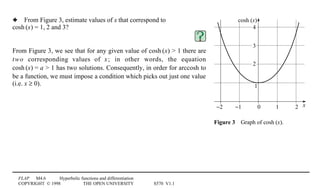
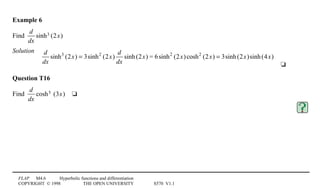
Figure 34Graph of cosh1(x).
If we agree to restrict ourselves to positive values of x, so that we can be
sure that |1x1| = x, there is no problem with the inverse of cosh (just as
there is no problem with the inverse of ‘squaring’ if we restrict ourselves
to positive numbers) for then we have
arccosh1[cosh1(x)] = x4for x ≥ 0 (32b)
3 From Figure 3, what are the approximate values of arccosh1(2) and
arccosh1(3)?
3 Find all solutions of the equation cosh1(x) = 2.](https://image.slidesharecdn.com/2-diferensialhiperbolik-130509000507-phpapp02/85/2-diferensial-hiperbolik-33-320.jpg)
![FLAP M4.6 Hyperbolic functions and differentiation
COPYRIGHT © 1998 THE OPEN UNIVERSITY S570 V1.1
As in the case of trigonometric functions, an alternative notation is sometimes used to represent the inverse
hyperbolic functions:
sinh−11(x) for arcsinh1(x)
cosh−11(x) for arccosh1(x)
tanh−11(x) for arctanh1(x)
Notice that there is no connection with the positive index notation used to denote powers of the hyperbolic
functions, for example, using sinh21(x) to represent [sinh1(x)]2. Also notice that, although this notation might
make it appear otherwise, there is still a clear distinction between the inverse hyperbolic functions and the
reciprocal hyperbolic functions. So
sinh−11[sinh1(x)] = arcsinh1[sinh1(x)] = x
but cosech(x) × sinh(x) =
1
sinh(x)
× sinh(x) = 1](https://image.slidesharecdn.com/2-diferensialhiperbolik-130509000507-phpapp02/85/2-diferensial-hiperbolik-34-320.jpg)
![FLAP M4.6 Hyperbolic functions and differentiation
COPYRIGHT © 1998 THE OPEN UNIVERSITY S570 V1.1
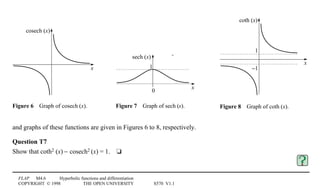
More inverse hyperbolic functions
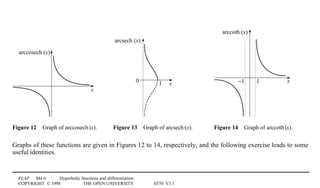
There are three more inverse hyperbolic functions which we have not mentioned yet; these are arccosech1(x),
arcsech1(x) and arccoth1(x). As you might expect, they are defined so that
arccosech1[cosech1(x)] = x (33)
arcsech1[sech1(x)] = x (34)
arccoth1[coth1(x)] = x (35)](https://image.slidesharecdn.com/2-diferensialhiperbolik-130509000507-phpapp02/85/2-diferensial-hiperbolik-35-320.jpg)
![FLAP M4.6 Hyperbolic functions and differentiation
COPYRIGHT © 1998 THE OPEN UNIVERSITY S570 V1.1
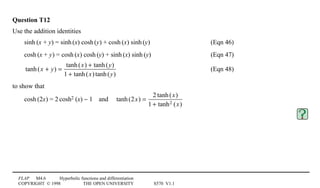
The double-argument identities:
sinh1(2x) = 21sinh1(x) cosh1(x) (49)
cosh1(2x) = cosh21(x) + sinh21(x) (50)
cosh1(2x) = 1 + 21sinh21(x) (51)
cosh1(2x) = 21cosh21(x) − 1 (52)
tanh(2x) =
2 tanh(x)
1 + tanh2 (x)
(53)
The half-argument identities:
cosh2 x
2
=
1
2
1 + cosh(x)[ ] (54)
sinh2 x
2
=
1
2
−1 + cosh(x)[ ] (55)](https://image.slidesharecdn.com/2-diferensialhiperbolik-130509000507-phpapp02/85/2-diferensial-hiperbolik-44-320.jpg)
![FLAP M4.6 Hyperbolic functions and differentiation
COPYRIGHT © 1998 THE OPEN UNIVERSITY S570 V1.1
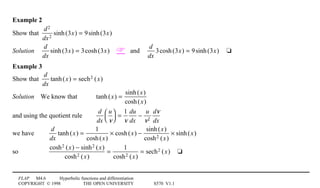
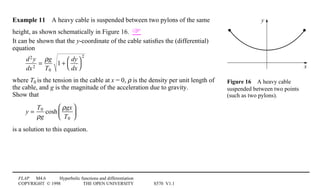
Example 4
Show that
d
dx
arcsinh(x) =
1
x2 + 1
Solution4There are two approaches:
(a) Let y = arcsinh1(x) so that we have to find
dy
dx
.
We have x = sinh1(y), and differentiating both sides of this equation with respect to x gives us
1 =
d
dx
[sinh(y)] =
dy
dx
d
dy
[sinh(y)] (from the chain rule)
and therefore 1 =
dy
dx
cosh(y)
which gives us
dy
dx
=
1
cosh(y)](https://image.slidesharecdn.com/2-diferensialhiperbolik-130509000507-phpapp02/85/2-diferensial-hiperbolik-52-320.jpg)
![FLAP M4.6 Hyperbolic functions and differentiation
COPYRIGHT © 1998 THE OPEN UNIVERSITY S570 V1.1
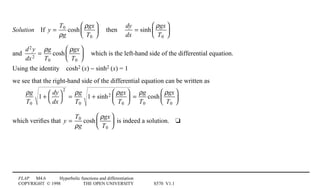
Example 5
Find
d
dx
sech(x)
Solution4
d
dx
sech(x) =
d
dx
[cosh(x)]−1
= −[cosh(x)]−2 d
dx
cosh(x) = −
sinh(x)
cosh2
(x)
= −sech(x)tanh(x)
4t
Question T15
Find
d
dx
cosech(x)4t](https://image.slidesharecdn.com/2-diferensialhiperbolik-130509000507-phpapp02/85/2-diferensial-hiperbolik-55-320.jpg)
![FLAP M4.6 Hyperbolic functions and differentiation
COPYRIGHT © 1998 THE OPEN UNIVERSITY S570 V1.1
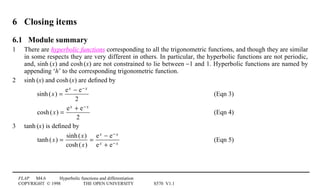
Example 7
Find
d
dx
[sinh(x)tanh(x)]
Solution4 d
dx
[sinh(x)tanh(x)] =
d
dx
sinh(x)tanh(x) + sinh(x)
d
dx
tanh(x)
= cosh(x)tanh(x) + sinh(x)sech2 (x)
= sinh(x)[1 + sech2 (x)] 4t
Question T17
Find
d
dx
[cosh(x)coth(x)]4t](https://image.slidesharecdn.com/2-diferensialhiperbolik-130509000507-phpapp02/85/2-diferensial-hiperbolik-57-320.jpg)

Solution
4
d
dx
exp[cosh(5x)]( ) = exp[cosh(5x)]
d
dx
[cosh(5x)] = 5exp[cosh(5x)]sinh(5x)
4t
Question T19
Find
d
dx
exp[sinh2 (x)]( )4t](https://image.slidesharecdn.com/2-diferensialhiperbolik-130509000507-phpapp02/85/2-diferensial-hiperbolik-59-320.jpg)
![FLAP M4.6 Hyperbolic functions and differentiation
COPYRIGHT © 1998 THE OPEN UNIVERSITY S570 V1.1
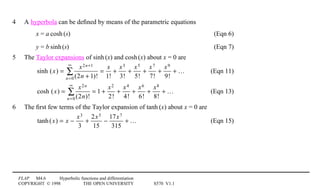
Example 10
Find
d
dx
loge[cosh(x)]
Solution4
d
dx
loge[cosh(x)] =
1
cosh(x)
×
d
dx
cosh(x) =
sinh(x)
cosh(x)
= tanh(x)
4t
Question T20
Find
d
dx
loge[sinh(x)]4t](https://image.slidesharecdn.com/2-diferensialhiperbolik-130509000507-phpapp02/85/2-diferensial-hiperbolik-60-320.jpg)
![FLAP M4.6 Hyperbolic functions and differentiation
COPYRIGHT © 1998 THE OPEN UNIVERSITY S570 V1.1
6.3 Exit test
Study comment Having completed this module, you should be able to answer the following questions, each of which tests
one or more of the Achievements.
Question E1
(A2)4Use the definitions of trigonometric and hyperbolic functions in terms of the exponential function to show
that: (a) tanh1(x) = −i1tan1(i0x), (b) cosech1(x) = i cosec1(i0x).
Question E2
(A4)4Use the double-argument identities to show that
(a) cosh2 x
2
=
1
2
1 + cosh(x)[ ],4(b) sinh2 x
2
=
1
2
−1 + cosh(x)[ ].](https://image.slidesharecdn.com/2-diferensialhiperbolik-130509000507-phpapp02/85/2-diferensial-hiperbolik-69-320.jpg)
![FLAP M4.6 Hyperbolic functions and differentiation
COPYRIGHT © 1998 THE OPEN UNIVERSITY S570 V1.1
Question E5
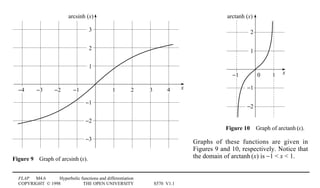
(A3)4From the graphs given in this module, which hyperbolic functions would you expect to have a domain
which excludes the point x = 0. Confirm your suspicions by looking at algebraic expressions for the functions
that you have picked out. (You should include the reciprocal and inverse hyperbolic functions in your
discussion.)
Question E6
(A4)4Starting from the definition of sinh1(x) in terms of the exponential function, show that
arcsinh(x) = loge x + x2 + 1( )
Question E7
(A5)4Use the known derivative of tanh1(x) to express
d
dx
loge[tanh(x)] in terms of hyperbolic functions.](https://image.slidesharecdn.com/2-diferensialhiperbolik-130509000507-phpapp02/85/2-diferensial-hiperbolik-71-320.jpg)


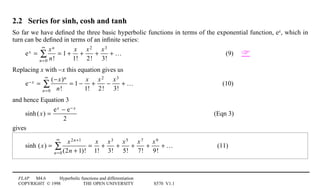
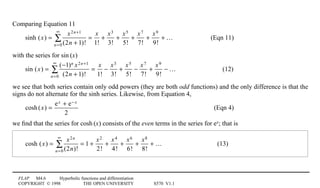
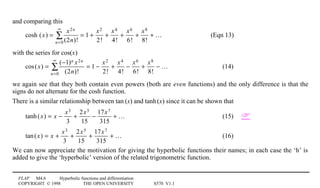
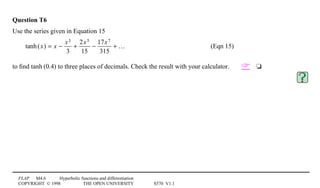
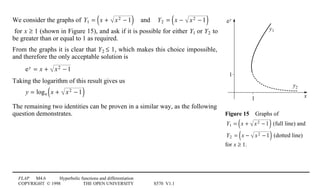
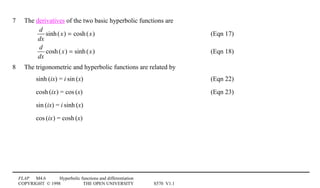
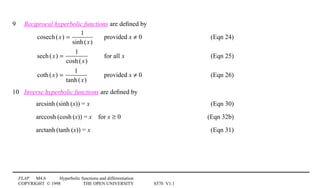
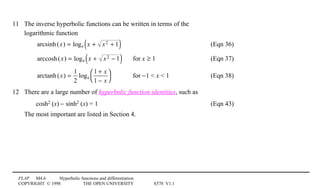
This document describes a module on hyperbolic functions and differentiation. It begins by introducing hyperbolic functions such as sinh, cosh, and tanh, which are analogous to trigonometric functions but correspond to hyperbolas rather than circles. It defines these functions in terms of exponentials and discusses their properties. The document then examines series expressions for the hyperbolic functions and explores their connection to trigonometric functions through complex numbers. It concludes by covering advanced hyperbolic functions, identities, and differentiating hyperbolic functions.