20. F I R S T Q U A R T E R
Chapter 1: Functions
Lesson 1: Functions as Models
Objective:
At the end of this lesson, leaners
should be able to…
represent real-life situations using
functions, including piecewise
functions
M11GM-Ia-1
21. Chapter 1: Functions
Lesson 1 : Functions as Models
22
Lesson Topics
1. Review of relations and functions
2. Review: The functions as machine
3. Review: Functions and relations as table of values
4. Review: Functions as graph in the Cartesian plane
5. Review: Vertical line test
6. Functions as representation of real life situations
7. Piecewise functions
22. A. Review of Basic Reference
Figure 1
Two Dimensional Coordinates or Cartesian System
Quadrant (x, y)
I (+ , +)
II (- , +)
III (- , -)
IV (+ , -)
Table 1
As indicated in Figure 1, The plane is then referred to as the real plane.
The x and y-axes divide the plane into four regions, called quadrants.
23
-Y
y-axis
Y
X
A (0, b)
C (a, 0)
B (a, b)
Quadrant III Quadrant IV
Quadrant II Quadrant I
x-axis coordinates
D (0, 0)
origin
-X
In each of the quadrants, the signs of the coordinates of point are
completely determined as given in the Table 1.
(x , y)
(Independent, Dependent)
(Input, Output)
(Domain, Range)
23. 24
a set of ordered pairs,
x and y. the set of first members,
the x values of the ordered pairs,
is called the domain of the
relation.
Relation:
The set of second members, the
y values of the ordered pairs, is
called the range of the relation.
24. 25
a relation in which
each element of the domain
is paired with exactly one
element in the range.
Function:
Functions can be denoted by
f(x) “ read as f of x” and
y = f(x)
25. 26
set of all admissible
values of x that make the
function defined under the set of
real numbers.
set of all possible
resulting values of y.
:corresponding values of the
dependent variable y.
Domain:
Range:
26. Chapter 1. Functions
The following table shows how relations and functions are the same and
how they are different.
27
A. Review of Functions from Junior High
Relations Functions
A relation is a rule
that relates values
from a set of values
(called domain) to a
second set of values
(called the range)
A function is a relation
where each element in
the domain is related
to only one value in
the range by some
rule.
27. 28
Relations Functions
The elements of the
domain can be
imagined as input
to a machine that
applies a rule to
these inputs to
generate one or
more outputs.
The elements of the
domain can be
imagined as input to
a machine that
applies a rule so
that each input
corresponds to only
one output.
28. 29
Relations Functions
A relation
is also a set
of ordered
pairs (x, y)
A function is a set
of ordered pairs
(x, y) such that no
two ordered pairs
have the same x-
value but
different y-values.
29. Chapter 1. Functions
30
A. Review of Functions from Junior High
Definition of a Function
A function f is a rule that assigns to each
element x in a set A exactly one element,
called f(x), in a set B.
A function is a rule. To talk about a function,
we need to give it a name. We will use
letters such as f, g, h, . . . to represent
functions.
30. 31
A function is a rule that describes how one quantity
depends on another. Many real-world situations follow
precise rules, so they can be modeled by functions. For
example, there is a rule that relates the distance a
skydiver falls to the time he or she has been falling. So
the distance traveled by the skydiver is a function of
time. Knowing this function model allows skydivers to
determine when to open their parachute.
31. 32
Functions All Around Us…
In nearly every physical phenomenon we observe that one quantity depends on
another. For example, your height depends on your age, the temperature depends
on the date, the cost of mailing a package depends on its weight (see Figure 1). We
use the term function to describe this dependence of one quantity on another.
That is, we say the following:
■ Height is a function of age.
■ Temperature is a function of date.
■ Cost of mailing a package is a function of weight.
32. 33
In mathematics, a function is originally the
idealization of how a varying quantity
depends on another quantity. ... If the
function is called f, this relation is denoted
y = f (x) (read f of x), the element x is the
argument or input of the function, and y is
the value of the function, the output, or
the image of x by f.
33. 34
A Function f is a rule that
associates with each input a
unique [“exactly one”] output.
If the input is written “x”, then
the output is written “f(x).
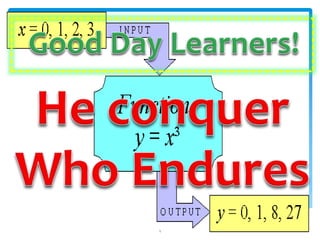
34. 1. The Function as a machine
35
Mathematical relations will
represent as machines
with an input and output,
and that the output is
related to the input by
some rule.
42. 2. Functions and relations as a set ordered pairs
48
Example 1. Which of the relations are functions?
(a) f = { (1, 2), (2, 2), (3, 5), (4, 5)}
(b) g = { (1, 3), (1, 4), (2, 5), (2, 6), )3, 7)}
(c) h = { (1, 3), (2, 6), (3, 9), . . . ,
(n, 3n), . . .}
The following examples illustrates these concepts:
43. 2. Functions and relations as a set ordered pairs
49
Solution. The relations f and h are functions
because no two ordered pairs have the
same x-value but different y-values, while g
is not a function because (1, 3) and (1, 4) are
ordered pairs with the -value but
different y-values.
(a) f = { (1, 2), (2, 2), (3, 5), (4, 5)}
(b) g = { (1, 3), (1, 4), (2, 5), (2, 6), )3, 7)}
(c) h = { (1, 3), (2, 6), (3, 9), . . . . , (n, 3n), . . .}
44. 3. Functions and relations as a table of values
50
In example 1(a), (1,2) is an element of f. We can
use the notation f(1)=2. in general, we can use
notation f(x)=y for each ordered pair (x,y) in f.
We can also organize these ordered pair as a
table. The function f in example 1(a) can be
represented by the table of values below.
x 1 2 3 4
f(x) 2 2 5 5
(a) f = { (1, 2), (2, 2), (3, 5), (4, 5)}
45. 4. Functions and relations as mapping diagrams
51
Relations and functions can be
represented by mapping diagrams
where the elements of the domain
are mapped to the elements of the
range using arrows. In this case, the
relation or function is represented
by the set of all the connections
represented by arrows.
46. 52
Example 2. Which of the following mapping diagrams
represent functions?
5
17
1
2
3
4
5
3
9
33
f
5
6
7
8
9
0
1
g 7
2
1
11
13
17
19
23
h
Solution. The relations f and g are
functions because each x € X
corresponds to a unique y € Y.
48. 5. Functions as a graph in the Cartesian plane
54
The Vertical Line Test
A graph represents a function if and only if each
vertical line intersects the graph at most once.
If a vertical line x = a intersects a graph twice, say
at (a, b) and at (a, c), then the graph cannot
represent a function because two different y-
values correspond to x=a.
Recall from Grade 8 that a relation between two sets of
numbers can be illustrated by a graph in the Cartesian plane,
and that a function passes the vertical line test (i.e., a vertical
line can be drawn anywhere and intersect the graph in at most
one point).
49. 56
Figure 1
(a) (b)
(c)
(d) (e)
Solution: Graphs (a), (b), (d) are graphs of functions while
(c) and (e) are not because they do not pass the vertical
line test.
Which of the following graphs can
be graphs of functions?
50. 5. Functions as a graph in the Cartesian plane
57
TIP: The x-variable is the input variable
and that the value of the y-variable is
computed based on the value of the x-
variable. A relation is a function if for
each x-value that corresponds only one
y-value.
Definition. The domain of a relation as the set of
all possible values that the variable x can take.
51. 5. Functions as a graph in the Cartesian plane
58
Example 4. Which of the following
represents a function?
a) 𝒚 = 𝟐𝒙 + 𝟏 𝒃) 𝒚 = 𝒙𝟐 − 𝟐𝒙 + 𝟐
𝒄) 𝒙𝟐+ 𝒚𝟐= 𝟏 𝒅) 𝒚 = 𝒙 + 𝟏
e) y=
𝟐𝒙+𝟏
𝒙−𝟏
52. 59
Solution: All are relations. All are
functions except (c). Equation
(c) is not a function because we
can find an x-value that
corresponds to more y-value.
e.g. if x=0, then y can be +1 or -1
𝒄) 𝒙𝟐
+ 𝒚𝟐
= 𝟏
53. 60
Functions versus Relation
(x , y)
(Independent, Dependent)
(Input, Output)
(Domain, Range)
y-axis
Y
X
A (0, b)
C (a, 0)
B (a, b)
Quadrant III Quadrant IV
Quadrant II Quadrant I
x-axis
coordinates
D (0, 0)
origin
-X
-Y
54. 61
Functions each x has
only one y
Ex. (1 , 4) (2 , 4) (3 , 6)
1
2
3
4
5
3
5
9
17
33
f
Relations one, some, or
all x’s can have more than
one y
Ex. (3 , 2) (3 , 1) (7 , 6)
1
2
3
4
5
3
5
9
17
33
f
55. 62
Function can often be used
to model real situations.
Identifying an appropriate
functional model will lead to
a better understanding of
various phenomena.
Functions as representations of real-life situations
56. 63
Example 6. Give a function C
that can represent the cost of
buying x meals, if one meal
costs P40.
Solution. Since each meal costs
P40, then the cost function is
C (x) = 40x
57. 64
Example 7. One hundred meters of
fencing is available to enclose a
rectangular area next to a river (see
figure a). Give a function A that can
represent the area that can be
enclosed, in terms of x.
river
x
y
Figure a
58. 65
then x + 2y = 100 or
y =
(𝟏𝟎𝟎−𝒙)
𝟐
y = 50-0.5x
river
x
y
Figure a
A(x) = x(50-0.5x)
thus,
A(x) = 50x-0.5x²
from area formula of the rectangle A= xy
Solution. The area of the rectangular is A = xy. We
will write this as a function of x.
Since only 100 m of fencing is available,
59. 66
Some situations can only be more than one
formula, depending on the value of the
independent variable.
A piecewise defined function
is defined by different
formulas on different parts of
its domain.
Piecewise Functions
60. 67
Piecewise Function – a
function defined by
two or more functions
over a specified
domain.
Piecewise Functions
61. What do they look like?
f(x) = x2 + 1 , x 0
x – 1 , x 0
You can EVALUATE piecewise
functions.
You can GRAPH piecewise
functions.
63. f(x) = x2 + 1 , x 0
x – 1 , x 0
Let’s calculate f(2).
You are being asked to find y
when x = 2. Since 2 is 0, you
will only substitute into the
second part of the function.
f(2) = 2 – 1 = 1
64. f(x) = x2 + 1 , x
0
x – 1 , x 0
Let’s calculate f(-2).
You are being asked to find y
when x = -2. Since -2 is 0,
you will only substitute into
the first part of the function.
f(-2) = (-2)2 + 1 =
65. Your turn:
f(x) =
2x + 1, x 0
2x + 2, x 0
Evaluate the following:
f(-2) = -
3
?
f(0) = 2
?
f(5) = 12
?
f(1) = 4
?
66. One more:
f(x) =
3x - 2 , x -2
-x , -2 x 1
x2 – 7x , x 1
Evaluate the following:
f(-2) = 2?
f(-4) = -14
?
f(3) = ?
f(1) = -
6
?
67. Graphing Piecewise Functions:
f(x) =
x2 + 1 , x 0
x – 1 , x 0
Determine the shapes of the graphs.
Parabola and Line
Determine the boundaries of each graph.
Graph the
parabola where x
is less than zero.
Graph the line
where x is greater
than or equal to
zero.
68.
3x + 2 , x -2
-x , -2 x
1
x2 – 2 , x 1
f(x) =
Graphing Piecewise Functions
Determine the shapes of the graphs.
Line, Line, Parabola
Determine the
boundaries of
each graph.
70. 77
A user is charged P300
monthly for a particular mobile
plan, which includes 100 free text
messages. Message in excess of 100
are charged P1 each. Represent the
amount a consumer pays each
month as function of the number of
message sent in a month.
Piecewise Functions: real life applications
71. 78
A user is charged P300 monthly for a
particular mobile plan, which includes 100 free
text messages. Message in excess of 100 are
charged P1 each. Represent the amount a
consumer pays each month as function of the
number of message sent in a month.
Let t(m) represent the amount paid
by the consumer each month. It can be
expressed by the piecewise function
t(m) =
300
300 + m
,if 0 < m ≤ 100
,if m > 100
72. 82
A videoke machine can be rented for
P1,000 for three days, but for the
fourth day onwards, an additional
cost of P400 per day is added.
Represent the cost of renting a
videoke machine as a piecewise
function of the number of days it is
rented and plot its graph.
73. 83
A videoke machine can be rented for P1,000 for three
days, but for the fourth day onwards, an additional cost
of P400 per day is added. Represent the cost of renting a
videoke machine as a piecewise function of the number
of days it is rented and plot its graph.
1000 if 0 ≤ x ≤ 3
1000 + 400 (x-3 ) if x > 3
f(x) =
Let x be the number of days
74. 98
A certain chocolate bar costs P35.00
per piece. However, if you buy
more than 10 pieces, they will be
marked down to a price of P32.00
per piece. Use a piecewise function
to represent the cost in terms of
the number of chocolate bars
bought.
75. 99
A certain chocolate bar costs P35.00 per piece.
However, if you buy more than 10 pieces, they
will be marked down to a price of P32.00 per
piece. Use a piecewise function to represent the
cost in terms of the number of chocolate bars
bought.
Solution: Let n=no. of chocolate
35n
f(n)=
32n
, if 0 ∠ n ≤ 10
, if n > 10
76. 100
A function f is a rule that assigns to each
element x in a set A exactly one element, called
f(x), in a set B.
A relation is a rule that relates values from
a set of values (called domain) to a second
set of values (called the range)
77.
78. End of Lesson 1
THANK YOU!
102
I let that negativity roll off me like
water off a duck’s back. If it’s not
positive, I didn’t hear it. If you can
overcome the negativity, everything
becomes easier.
—George Foreman