Download to read offline

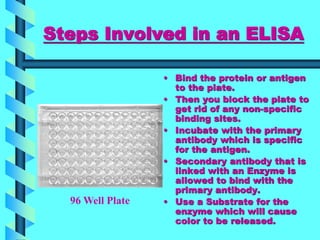
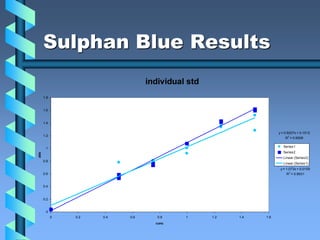
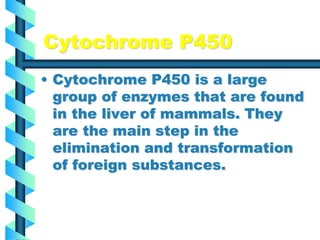
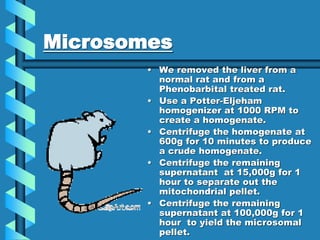
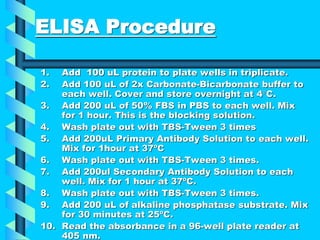
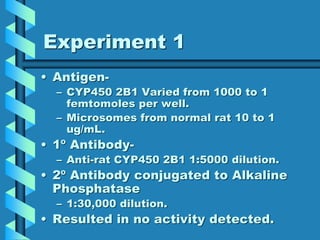
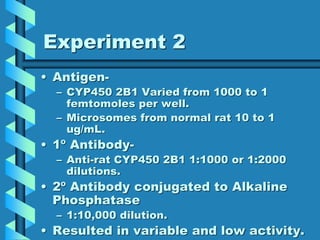
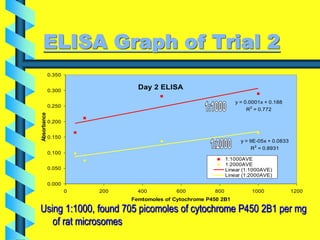
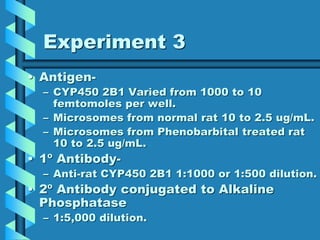
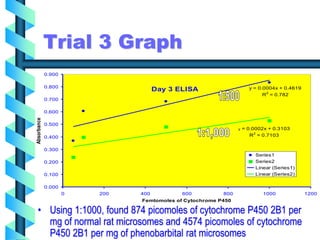
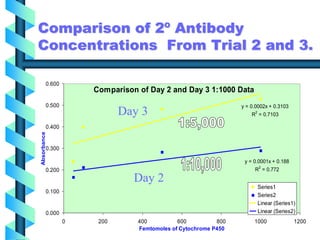
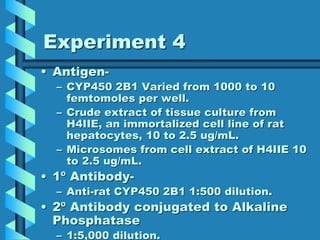
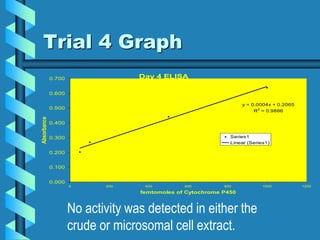
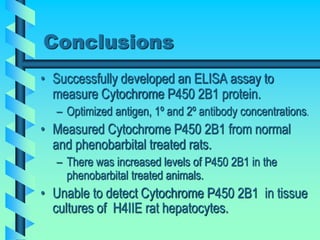

This document describes the development of an ELISA procedure to measure Cytochrome P450 protein concentration. It details the optimization process, which included varying antigen, primary antibody, and secondary antibody concentrations over multiple experiments. The optimized ELISA was able to detect Cytochrome P450 2B1 levels in liver microsomes from normal and phenobarbital-treated rats, finding higher levels in treated rats. However, the ELISA was unable to detect Cytochrome P450 2B1 in tissue culture extracts of rat hepatocytes.


