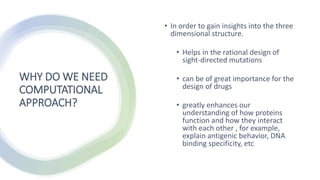
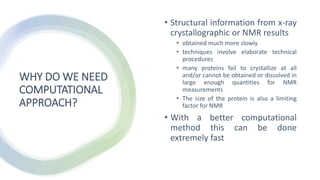
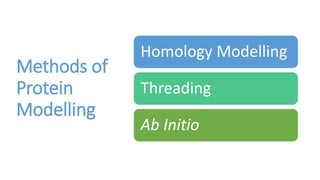
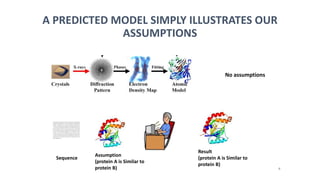
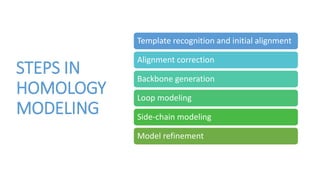
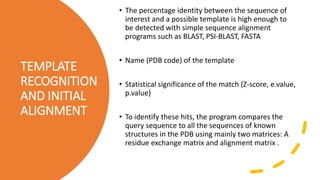
3. WHY DO WE NEED
COMPUTATIONAL
APPROACH?
• In order to gain insights into the three
dimensional structure.
• Helps in the rational design of
sight-directed mutations
• can be of great importance for the
design of drugs
• greatly enhances our
understanding of how proteins
function and how they interact
with each other , for example,
explain antigenic behavior, DNA
binding specificity, etc
4. WHY DO WE NEED
COMPUTATIONAL
APPROACH?
• Structural information from x-ray
crystallographic or NMR results
• obtained much more slowly
• techniques involve elaborate technical
procedures
• many proteins fail to crystallize at all
and/or cannot be obtained or dissolved in
large enough quantities for NMR
measurements
• The size of the protein is also a limiting
factor for NMR
• With a better computational
method this can be done
extremely fast
6. A PREDICTED MODEL SIMPLY ILLUSTRATES OUR
ASSUMPTIONS
6
No assumptions
GNAAAAKKGSEQESVKEFLAKAKEDFLKKWENPA
QNTAHLDQFERIKTLGTGSFGRVMLVKHKETGNH
FAMKILDKQKVVKLKQIEHTLNEKRILQAVNFPF
LVKLEYSFKDNSNLYMVMEYVPGGEMFSHLRRIG
RFSEPHARFYAAQIVLTFEYLHSLDLIYRDLKPE
NLLIDQQGYIQVTDFGFAKRVKGRTWTLCGTPEY
LAPEIILSKGYNKAVDWWALGVLIYEMAAGYPPF
FADQPIQIYEKIVSGKVRFPSHFSSDLKDLLRNL
LQVDLTKRFGNLKDGVNDIKNHKWFATTDWIAIY
QRKVEAPFIPKFKGPGDTSNFDDYEEEEIRVSIN
EKCGKEFSEF
Sequence
Assumption
(protein A is Similar to
protein B)
Result
(protein A is Similar to
protein B)
8. TEMPLATE
RECOGNITION
AND INITIAL
ALIGNMENT
• The percentage identity between the sequence of
interest and a possible template is high enough to
be detected with simple sequence alignment
programs such as BLAST, PSI-BLAST, FASTA
• Name (PDB code) of the template
• Statistical significance of the match (Z-score, e.value,
p.value)
• To identify these hits, the program compares the
query sequence to all the sequences of known
structures in the PDB using mainly two matrices: A
residue exchange matrix and alignment matrix .
9. 2. ALIGNMENT CORRECTION
More than one templates are achieved using the first method , this step is
used to arrive at a better alignment.
Sometimes it may be difficult to align two sequences in a region where
the percentage sequence identity is very low. One can then use other
sequences from homologous proteins to find a solution.
Suppose you want to align the sequence LTLTLTLT with YAYAYAYAY. There
are two equally poor possibilities, and only a third sequence, TYTYTYTYT,
that aligns easily to both of them can solve the issue
10. 3: BACKBONE GENERATION
• Creating the backbone is trivial for most of the model: One
simply copies the coordinates of those template residues that
show up in the alignment with the model sequence.
• If two aligned residues differ, only the backbone coordinates
(N,Cα,C and O) can be copied. If they are the same, one can
also include the side chain (at least the more rigid side chains,
since rotamers tend to be conserved).
• Experimentally determined protein structures are not perfect
(but still better than models in most cases). There are
countless sources of errors, ranging from poor electron
density in the X-ray diffraction map to simple human errors
when preparing the PDB file for submission
11. LOOP MODELING
• In the majority of cases, the alignment between model and template
sequence contains gaps. Either gaps in the model sequence (deletions) or in
the template sequence (insertions).
• For this it is important that the ends of loops should be predicted correctly
• There are two main approaches to loop modeling:
• 1. Knowledge based: one searches the PDB for known loops with
endpoints that match the residues between which the loop has to be
inserted, and simply copies the loop conformation.
• 2. Energy based: energy function is used to judge the quality of a loop.
Then this function is minimized to arrive at the best loop conformation
12. SIDE-CHAIN
MODELING
• Side chains are protruding out from backbone. They are not fixed
continuously changing their conformations, we named these side
chains as rotamers. Positions are so many; we can't actually
predict them.
• Solution is to predict backbone conformation correctly them we
can predict side chains correctly
• When we compare the side-chain conformations (rotamers) of
residues that are conserved in structurally similar proteins, we
find that they often have similar angles (i.e., the torsion angle
about the Cα−Cβ bond). It is therefore possible to simply copy
conserved residues entirely from the template to the model
• Practically all successful approaches to side-chain placement are
at least partly knowledge based. They use libraries of common
rotamers extracted from high resolution X-ray structures.
13. 6: MODEL REFINEMENT
The model quality can be classified into two types:
1. The stereochemical quality of the structural model
2. The accuracy of the homology-based structural model with respect
to its experimental structure
14. 6: MODEL REFINEMENT
• The quality of a model can be accessed by using different tools and
servers like Ramachandran Plot, Verify 3D, Errat, Procheck
• In such cases where the experimental structure is known, there are
several measures that estimate the model’s quality. RMSD is the
widely used measure to estimate the “structural similarity” between
any two structures. RMSD> 2.5Å is not accepted. Well predicted
structures have RMSD value close to 0 and can never be less than 0
15. RAMACHANDRAN PLOT
• Ramachandran’s plot is a protein structure validation tool for
checking the detailed residue-by-residue stereo-chemical quality of a
protein structure.
• A good homology model should have >90% of the residues in the
favorable region. Ramachandran plot was constructed for each
protein model using PROCHECK web-server.
16. RAMACHANDRAN PLOT
White areas disallowed regions
The red regions correspond to conformations
where there are no steric clashes, i.e. these are
the allowed regions namely the alpha-helical and
beta-sheet conformations
The yellow areas show the allowed regions if
slightly shorter van der Waals radi are used in the
calculation, i.e. the atoms are allowed to come a
little closer together.
Glycine has no side chain and therefore can
adopt phi and psi angles in all four quadrants of
the Ramachandran plot. Hence it frequently
occurs in turn regions of proteins where any
other residue would be sterically hindered
17. PROCHECK
PROCHECK (Laskowski et al., 1993) was used to estimate the
stereo-chemical quality of a model. Overall, PROCHECK program
finds covalent geometry, planarity, dihedral angles, chirality, non-
bonded interactions, main-chain hydrogen bonds, disulphide
bonds, stereo chemical parameters, parameter comparisons and
residue-by-residue analysis.
17
18. ERRAT
ERRAT (Colovos and Yeates, 1993) is a so-called “overall
quality factor” for non bonded atomic interactions, and higher
scores mean higher quality.
The normally accepted range is >50 for a high quality model.
18
19. VERIFY 3D
VERIFY 3D (Eisenberg et al., 1997) uses energetic and empirical
methods to produce averaged data points for each residue to evaluate
the quality of protein structures
Using this scoring function, if more than 80% of the residue has a
score of >0.2 then the protein structure is considered of high quality
19
20. 75
50
25
0
Easy – 100-40% sequence id - strong
sequence
similarity, strong structure similarity,
obvious function analogy
Difficult – 40%-25% - twilight zone
sequence similarity, increasing structure
divergence, function diversification
Fold prediction – below 25% seq id.
no apparent sequence similarity, extreme
function divergence
EXPECTATIONS OF
COMPARATIVE MODELING
20
21. SOFWARE FOR HOMOLOGY MOLECULAR
MODELLING
Freeware: available for all OS
Downloadable
• Modeller (Sali, 1998)
• DeepView (SwissPDB viewer)
• WHATIF (Krieger et al. 2003)
Web based: (Automatic modeling serves)
• SWISS MODEL server (www.expasy.org/swissmod/SWISS-MODEL.html)
• CPH model server (http://www.cbs.dtu.dk/services/CPHmodels)
• SDSC1 server (http://cl.sdsc.edu/hm.html)
• Geno 3D (http://geno3d-pbil.ibcp.fr)
For validation
• NIH-UCLA (http://services.mbi.ucla.edu/SAVES/)
21