Download to read offline


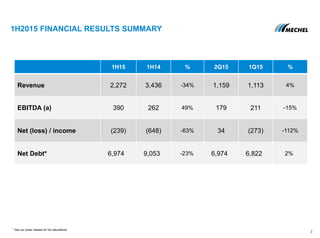
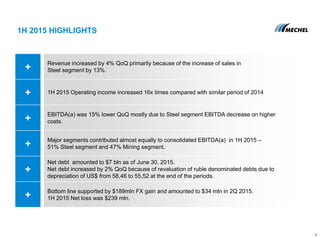
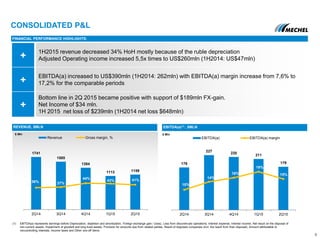
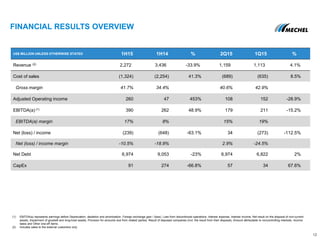

- Revenue for 1H2015 decreased by 34% compared to 1H2014 primarily due to currency depreciation. However, revenue increased 4% from Q1 to Q2. - EBITDA for 1H2015 was $390 million, an increase of 49% compared to 1H2014, with the EBITDA margin improving from 8% to 17%. - The net loss for 1H2015 was $239 million, an improvement of 63% compared to the $648 million net loss in 1H2014, driven by higher operating income and FX gains. The company had net income of $34 million in Q2.


