Download to read offline

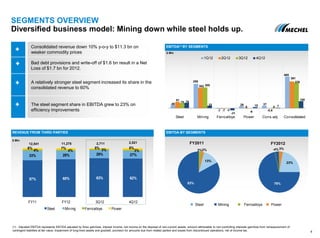
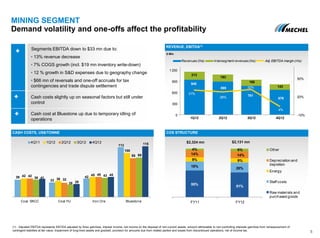
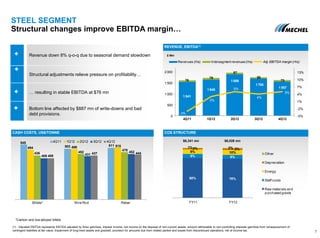
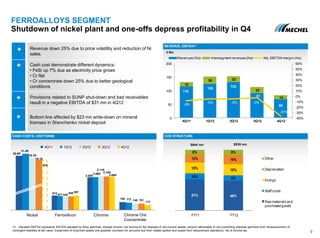
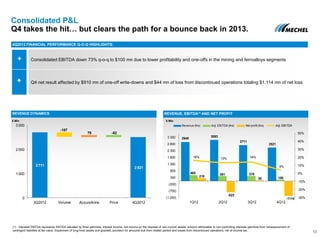
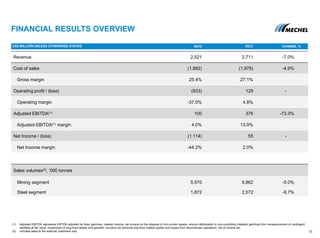

- Mechel presented its financial results for fiscal year 2012, with consolidated revenue down 10% to $11.3 billion due to weaker commodity prices. - The steel segment increased its share of total revenue to 60% and saw relatively stronger performance, with its EBITDA share growing to 23%. - The mining segment saw a 13% decline in revenue due to lower sales volumes and one-off charges, resulting in negative EBITDA for the quarter.


