Download to read offline


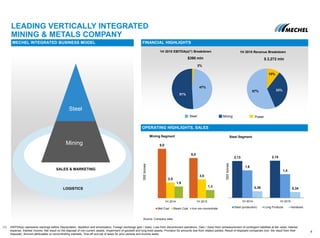
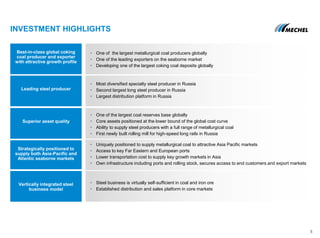
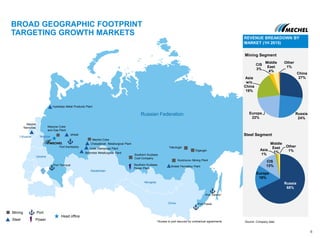
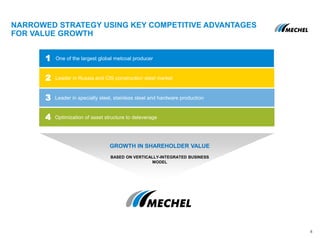
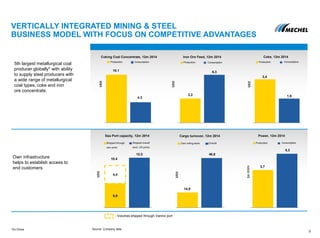
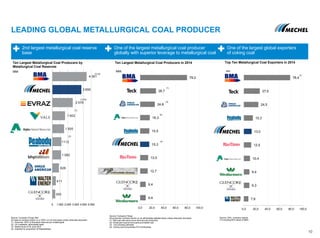
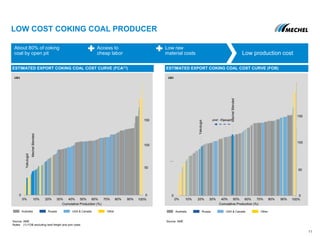
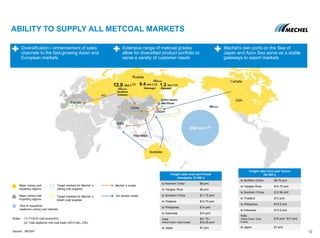
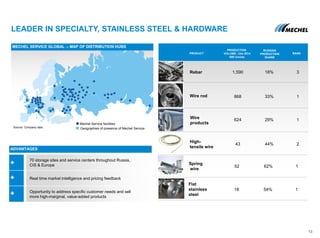


- This was a management presentation from October 2015 that provided an overview of Mechel, a leading vertically integrated mining and metals company based in Russia. - Mechel has competitive advantages from its vertically integrated business model, including being one of the largest global producers of metallurgical coal with attractive growth potential and a leading steel producer in Russia. - The presentation highlighted Mechel's broad geographic footprint, low-cost and high-quality coking coal assets, and its ability to supply both Asia-Pacific and Atlantic markets to support growth.


