Download to read offline

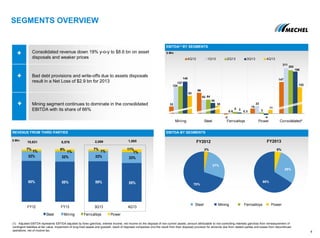
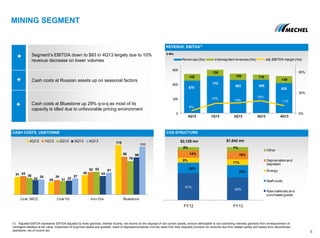
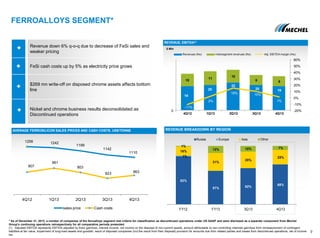
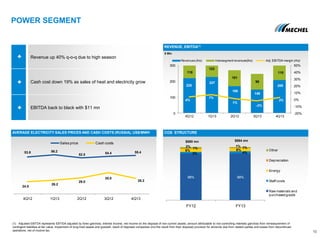
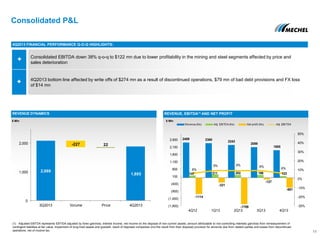
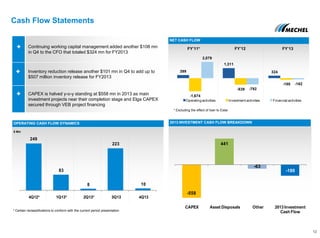

- Mechel presented its FY2013 results on May 15, 2014, reporting consolidated revenue down 19% year-over-year to $8.6 billion due to asset disposals and weaker prices. - The mining segment continued to dominate consolidated EBITDA, accounting for 66% of the total. However, EBITDA declined across all segments. - The company reported a net loss of $2.9 billion for 2013 due to bad debt provisions and write-offs resulting from asset disposals.


