Download as PDF, PPTX

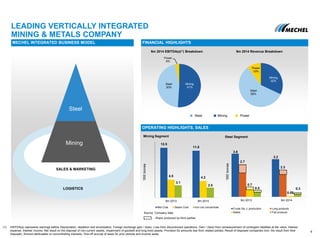
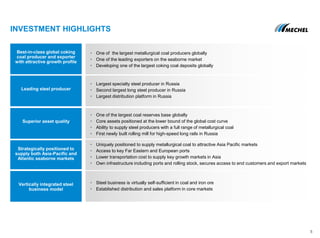

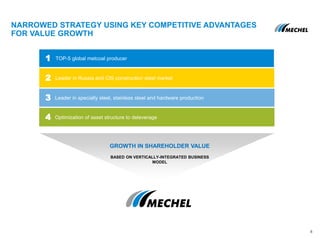
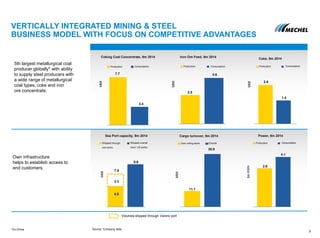


The presentation provides an overview of Mechel, a leading vertically integrated mining and steel company. It discusses Mechel's position as a top-5 global metallurgical coal producer with attractive growth opportunities. It also outlines Mechel's integrated business model, competitive advantages from its infrastructure assets, and focus on specialty steel markets in Russia and Europe.


