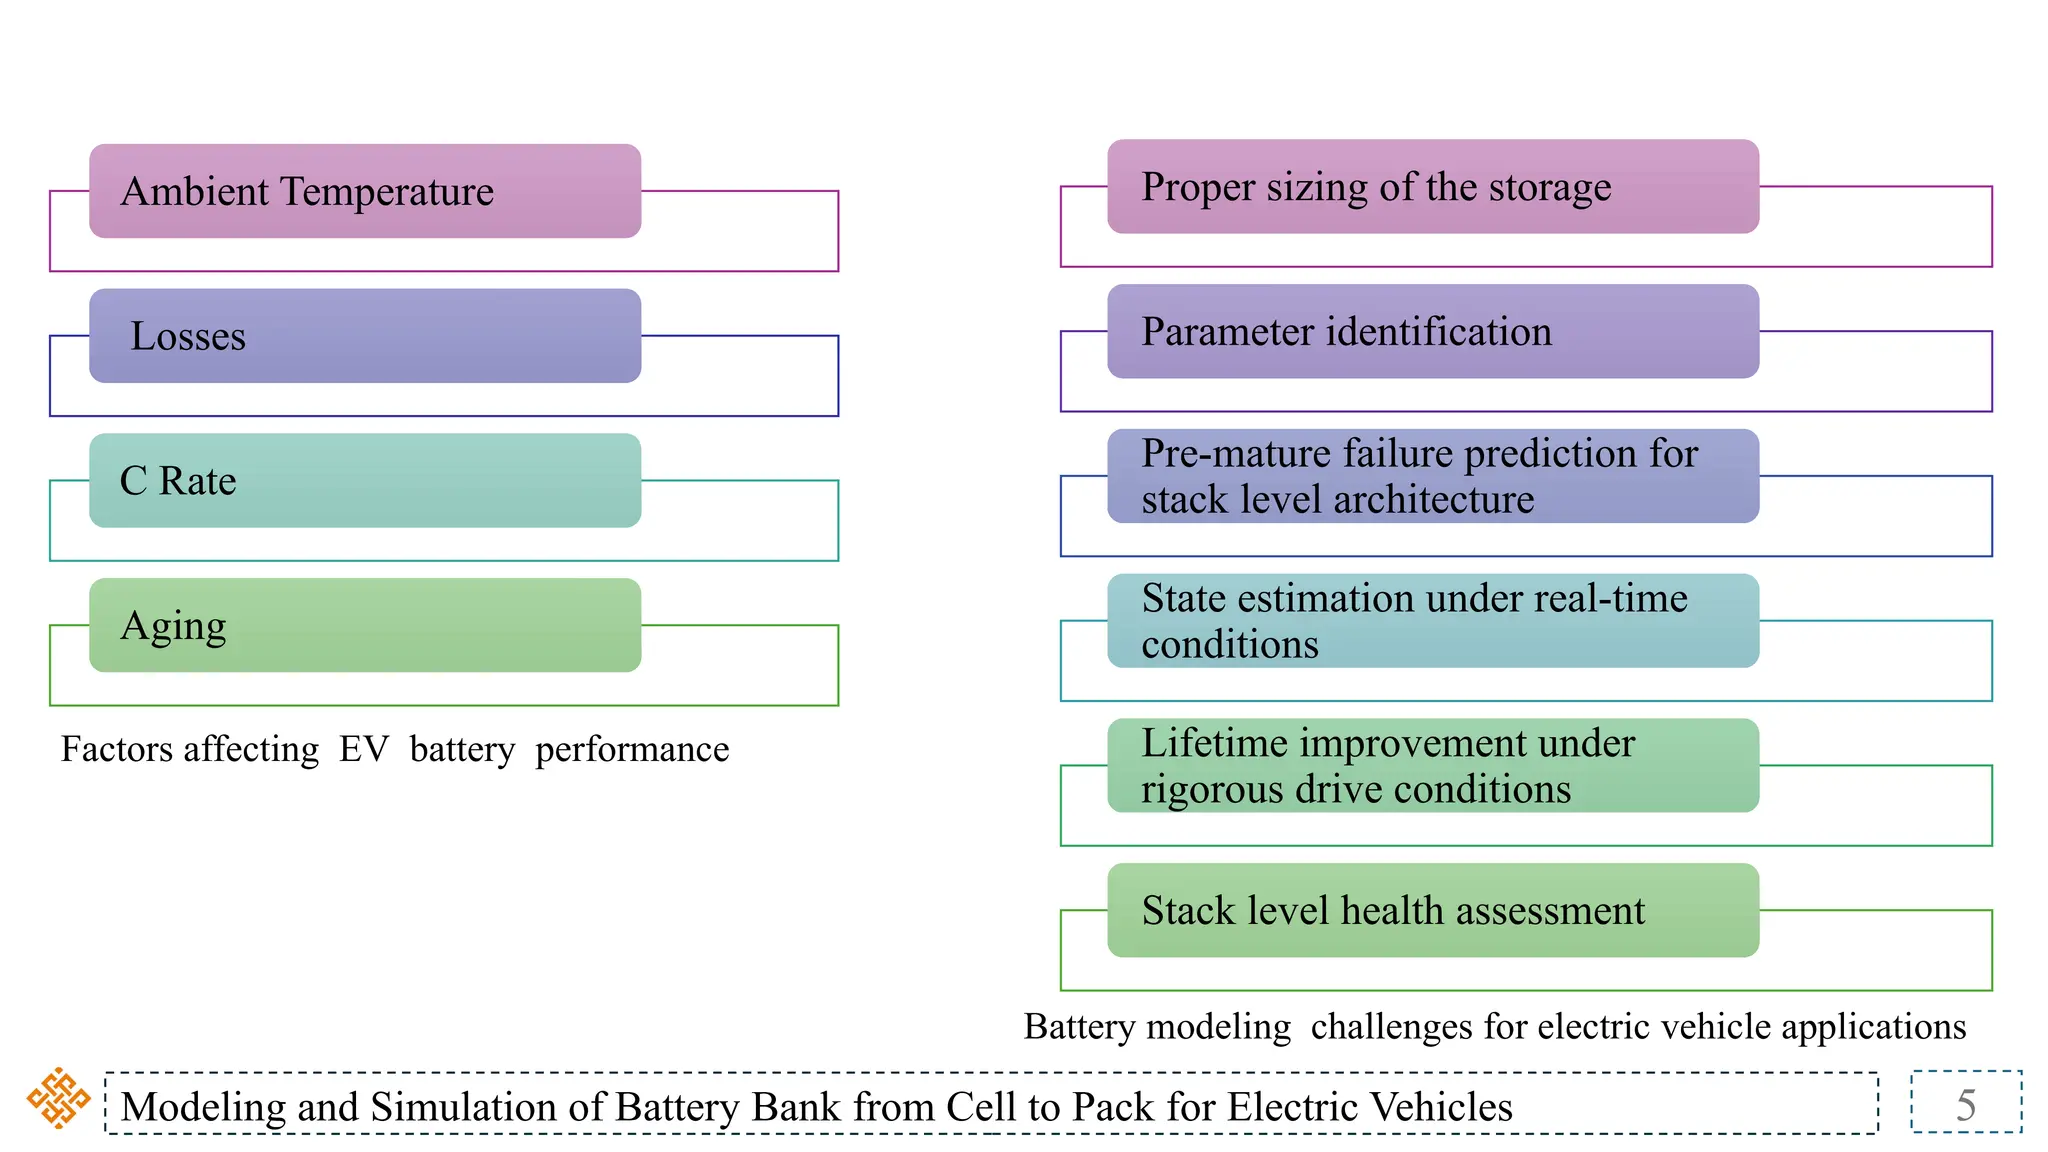
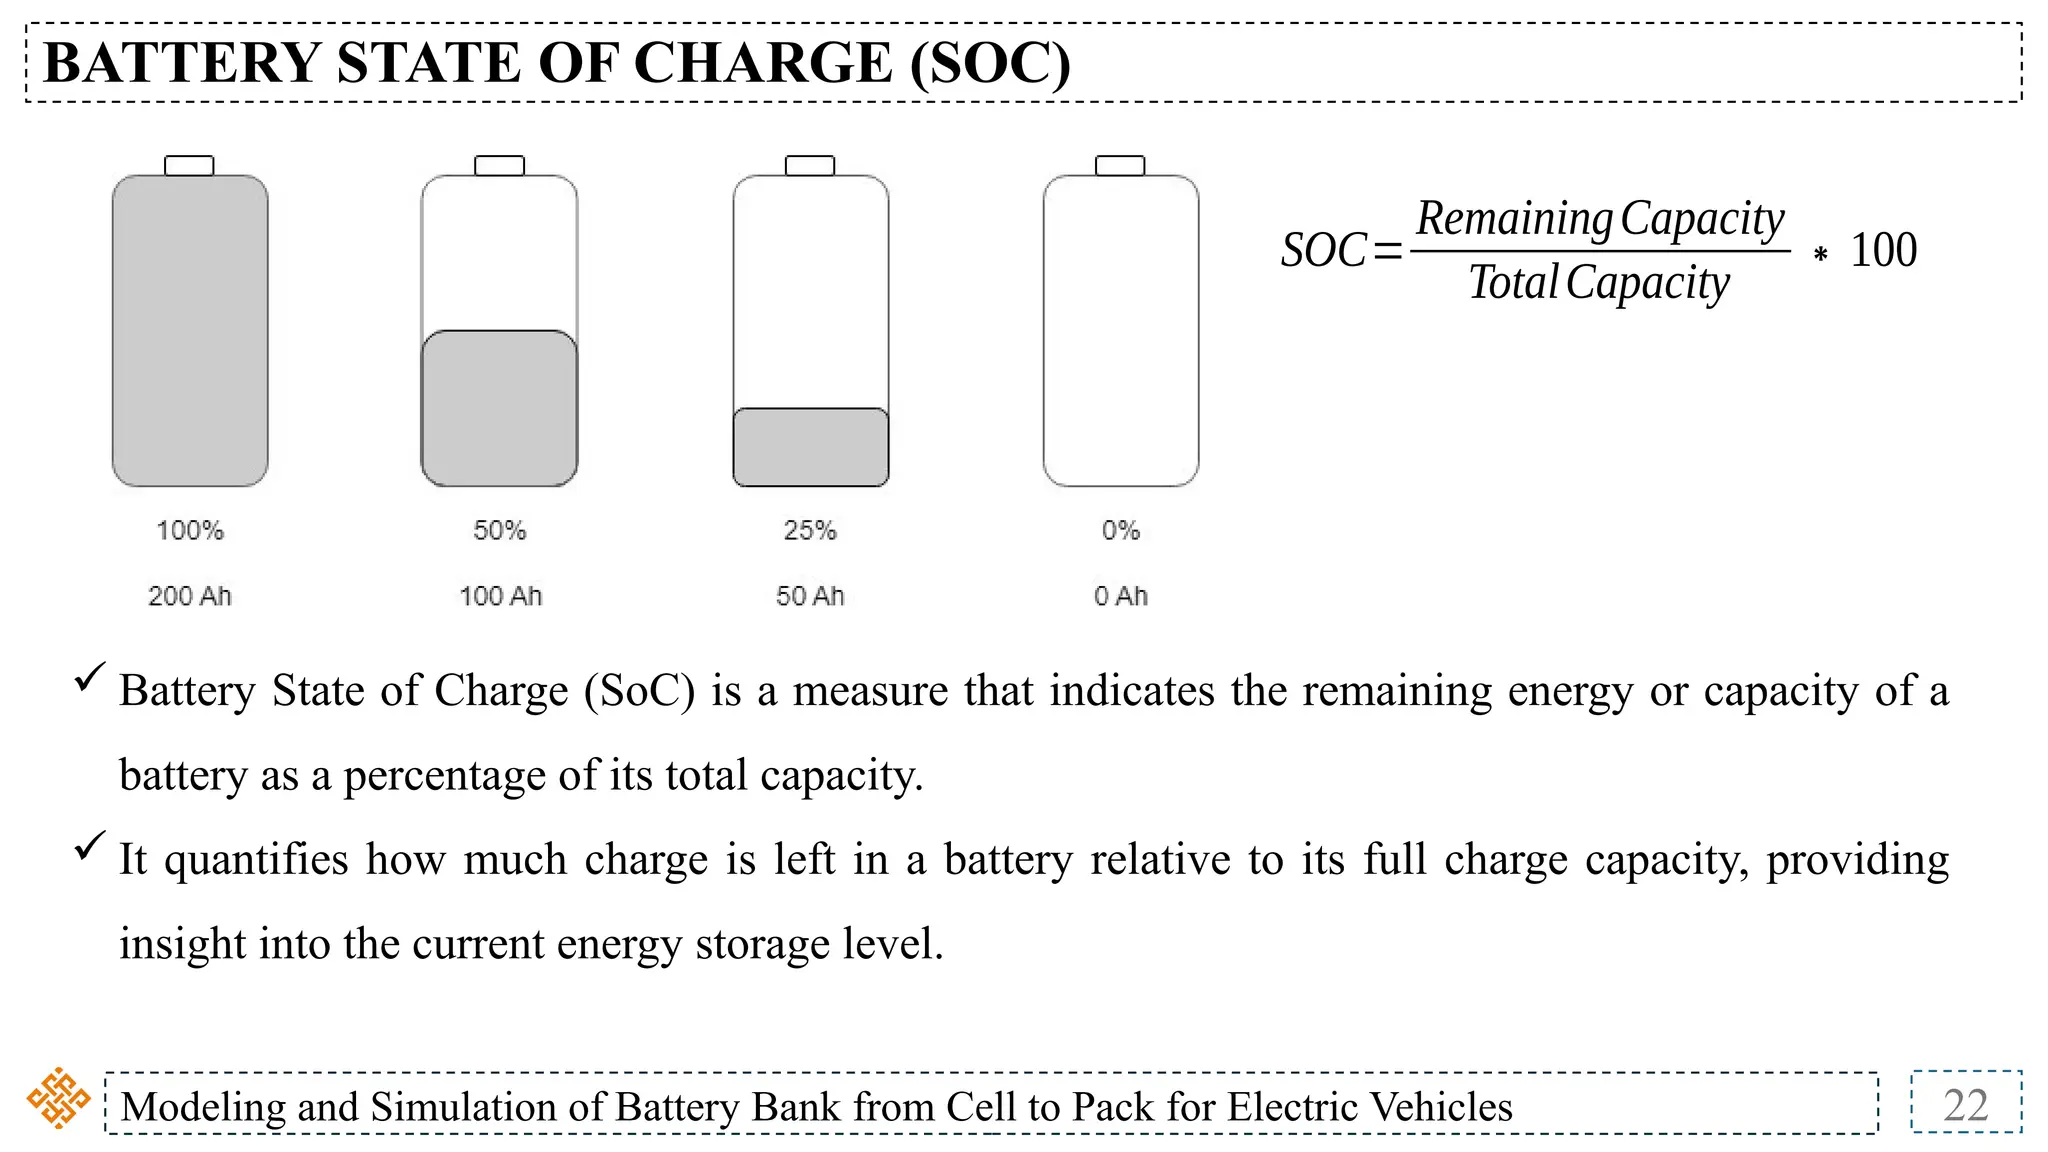
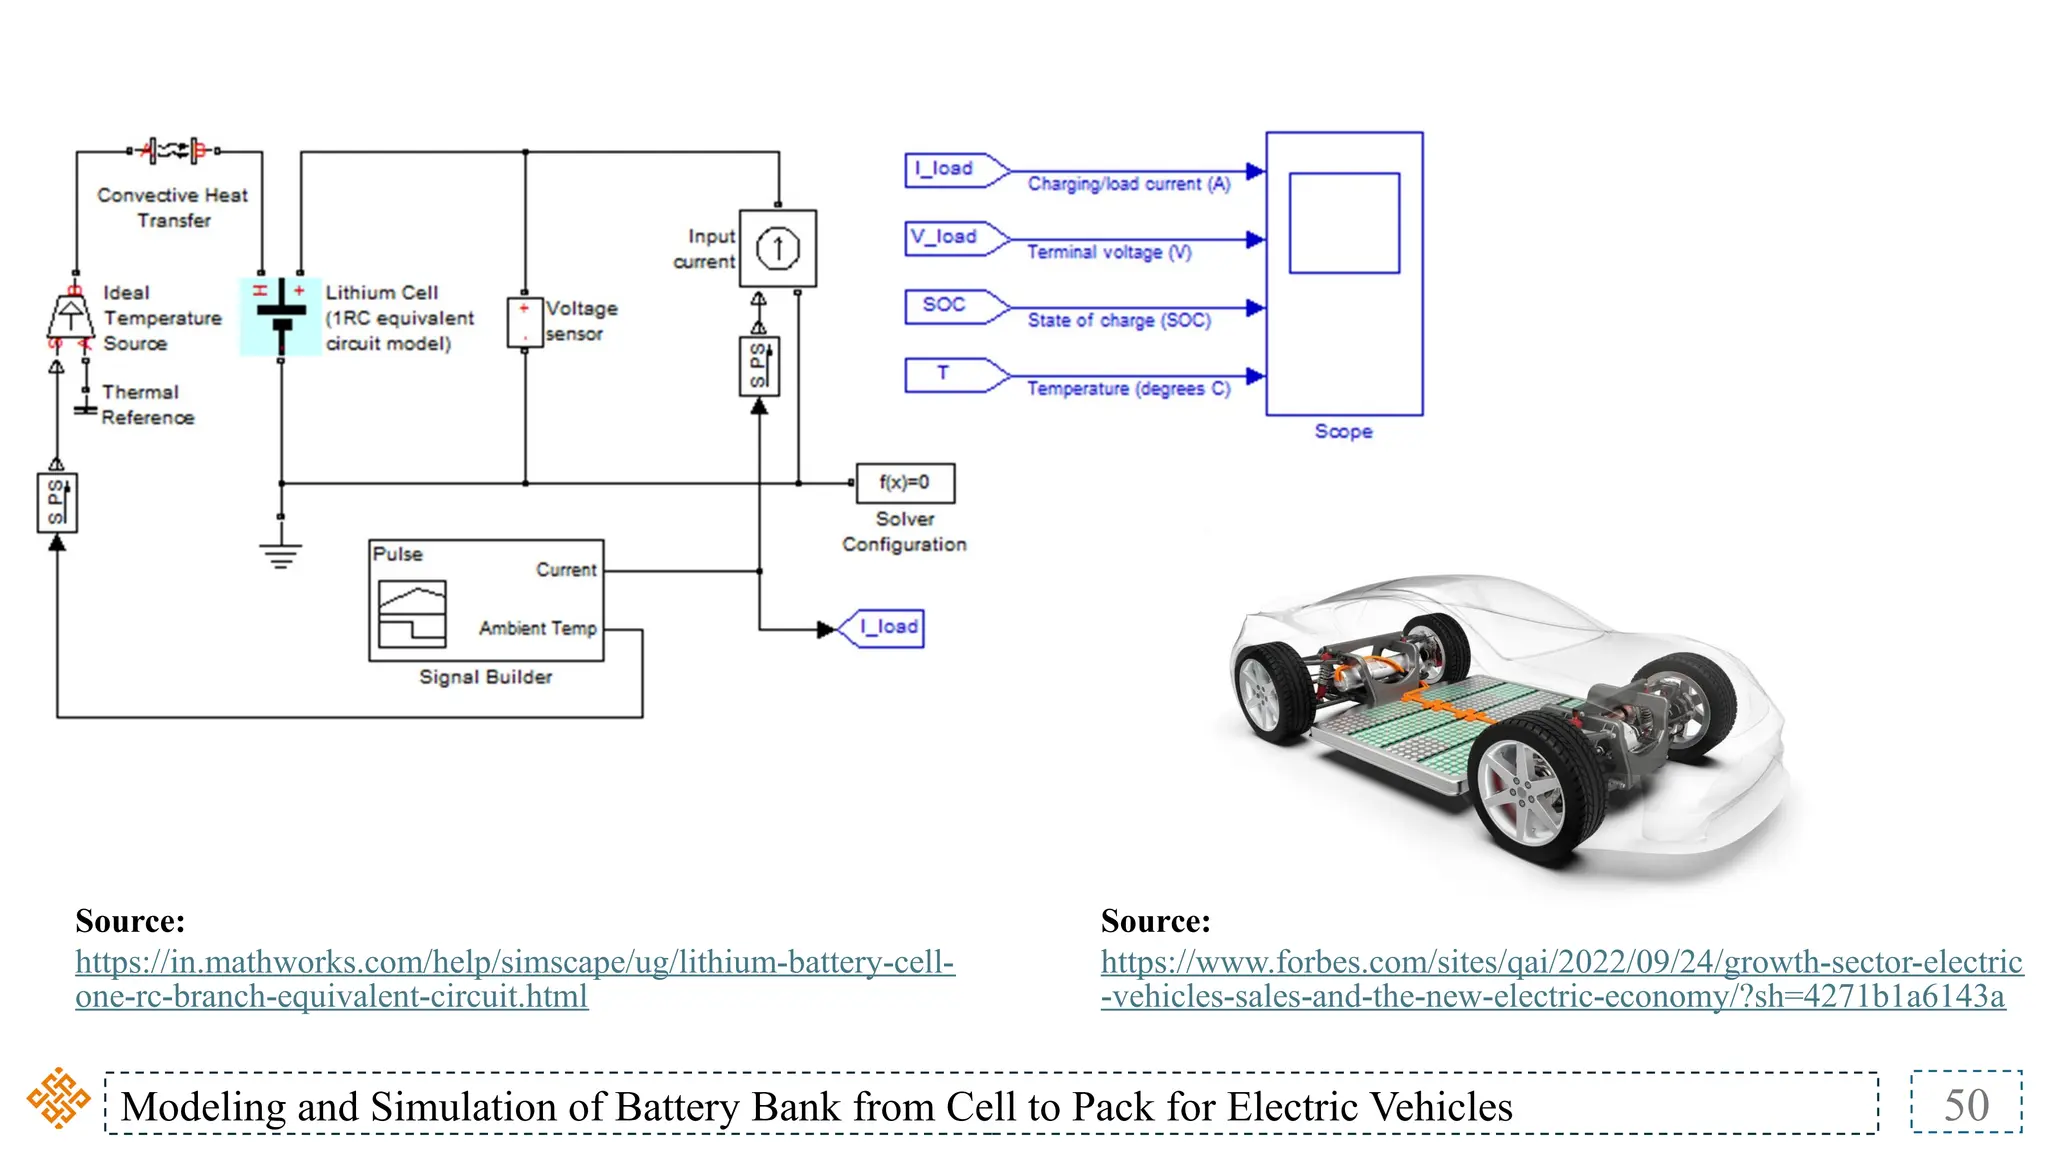
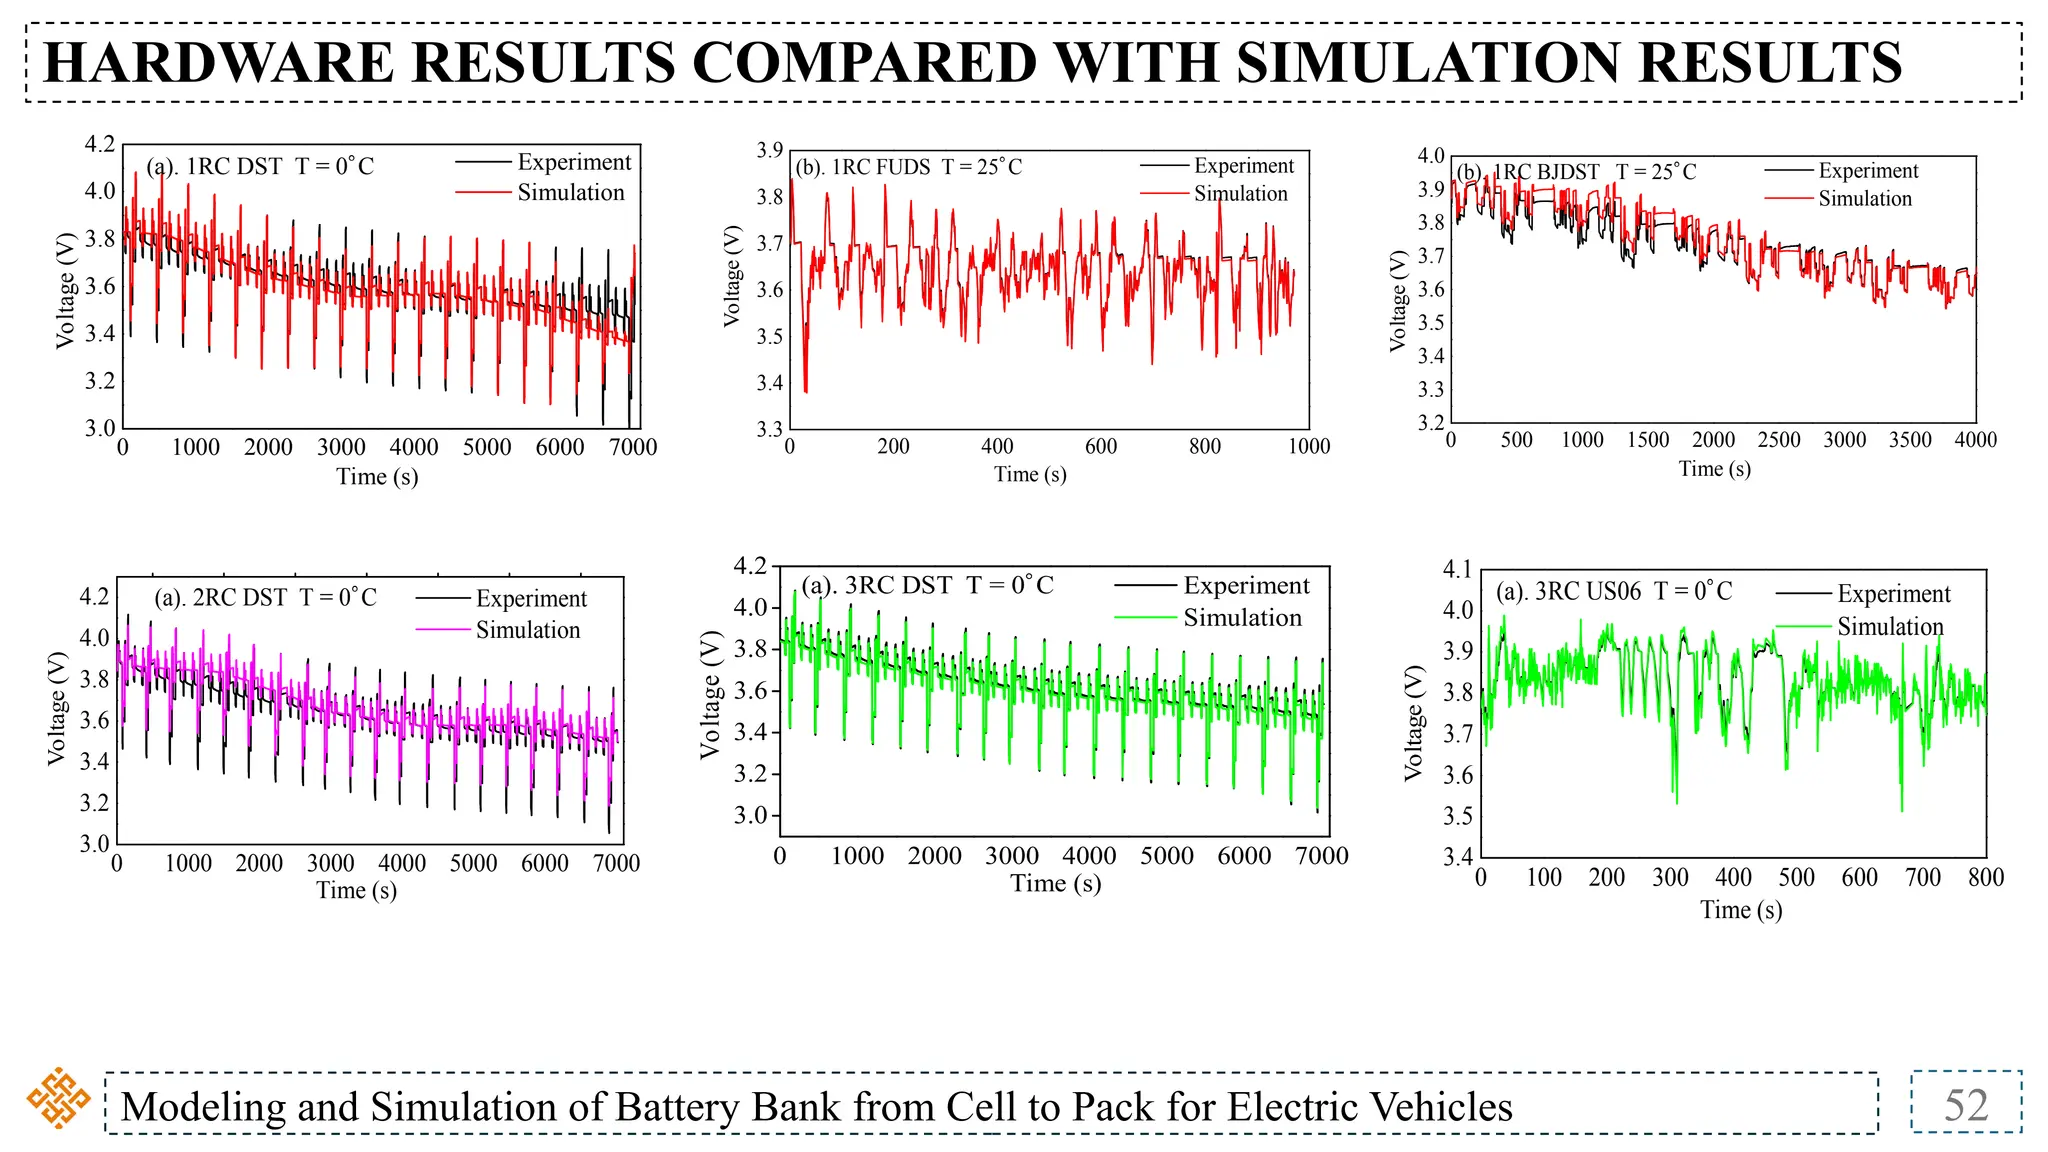
The document discusses the modeling and simulation of battery banks for electric vehicles, covering topics like battery configurations, voltage types, charging processes, state of charge (SOC), and state of health (SOH). It includes various battery chemistries, charging procedures, and how to manage battery performance effectively in electric vehicles. Additionally, it emphasizes the importance of battery modeling to reduce development costs and enhance user satisfaction.
![Modeling and Simulation of Battery Bank from Cell to Pack for Electric Vehicles 9
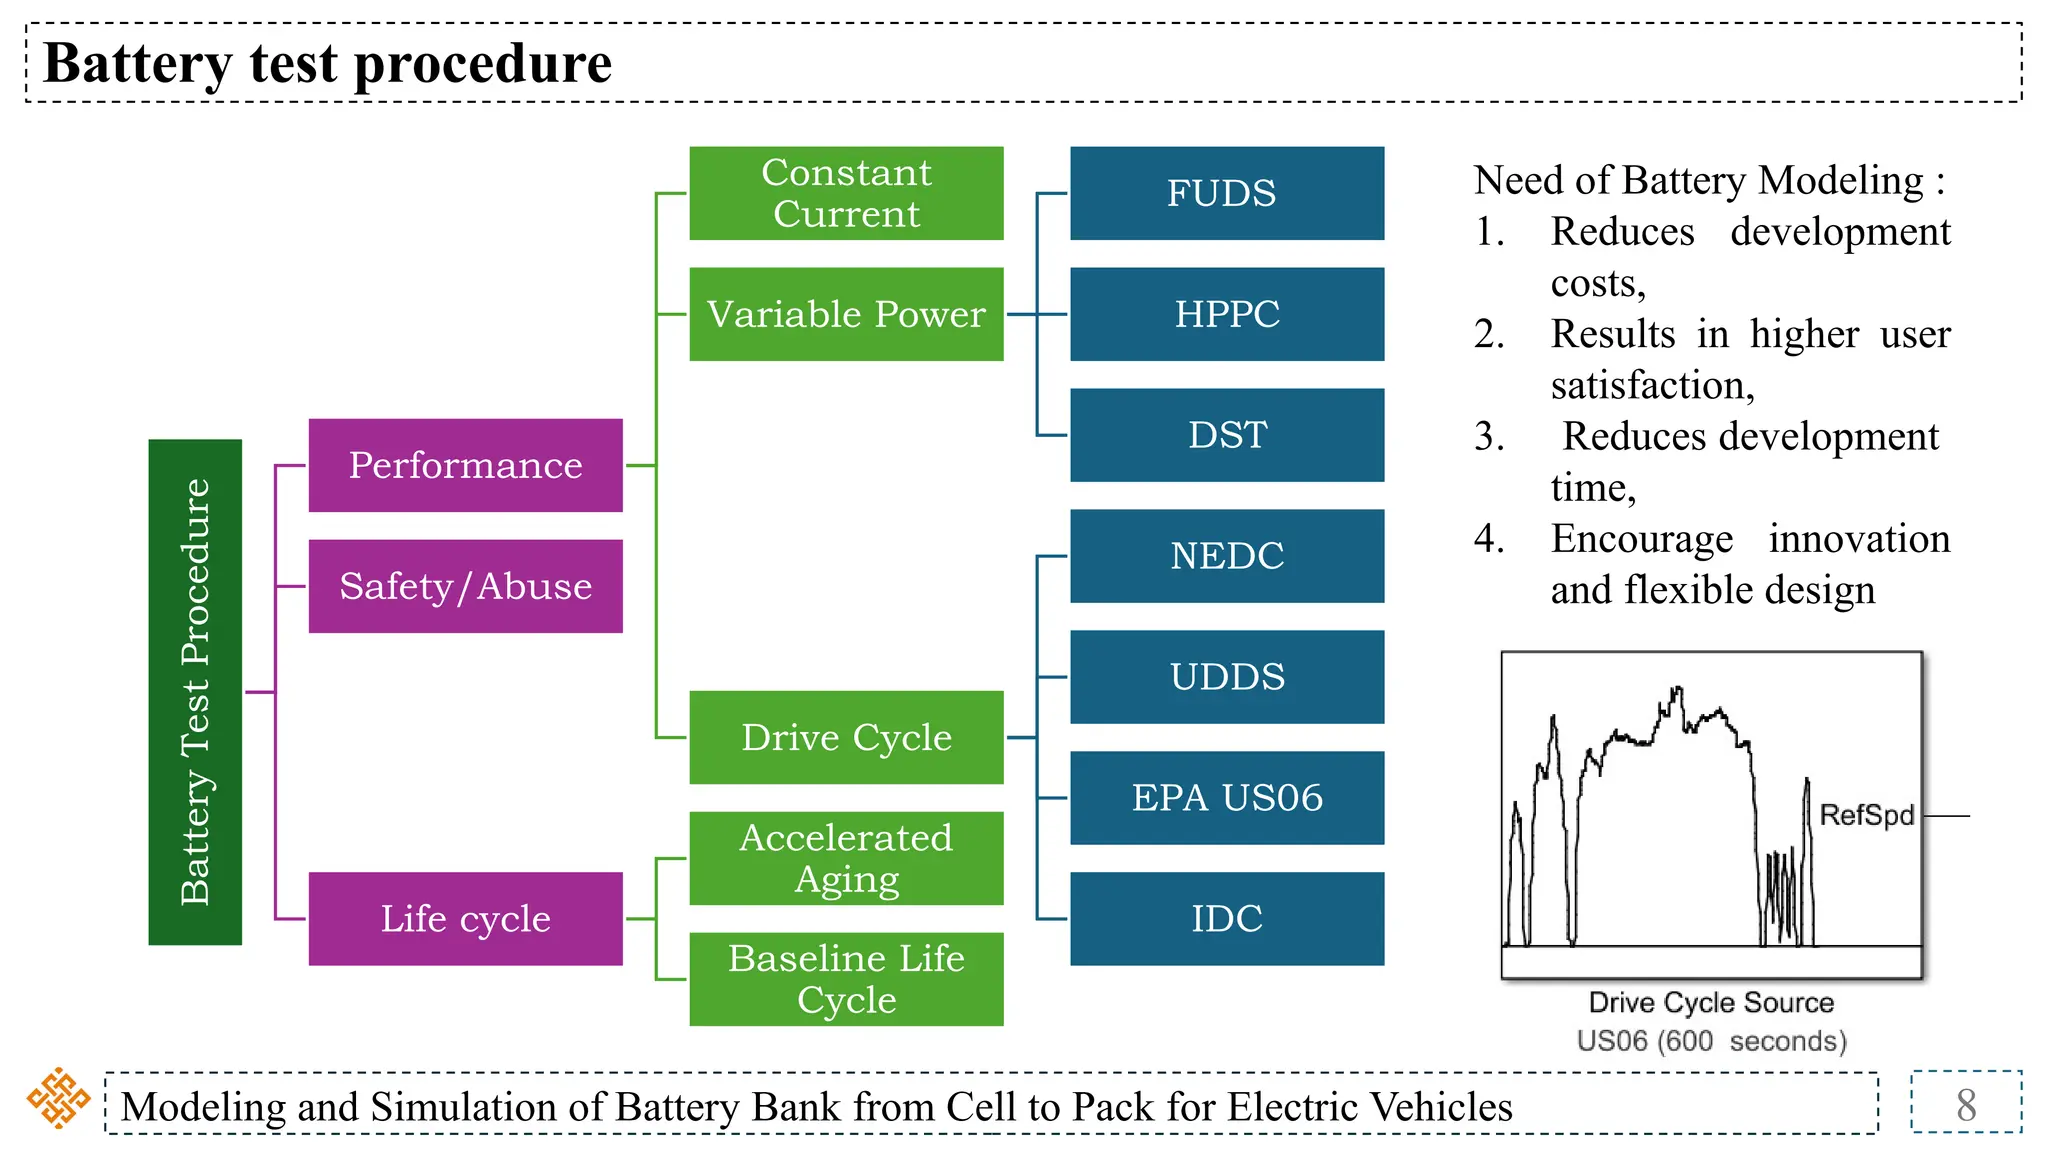
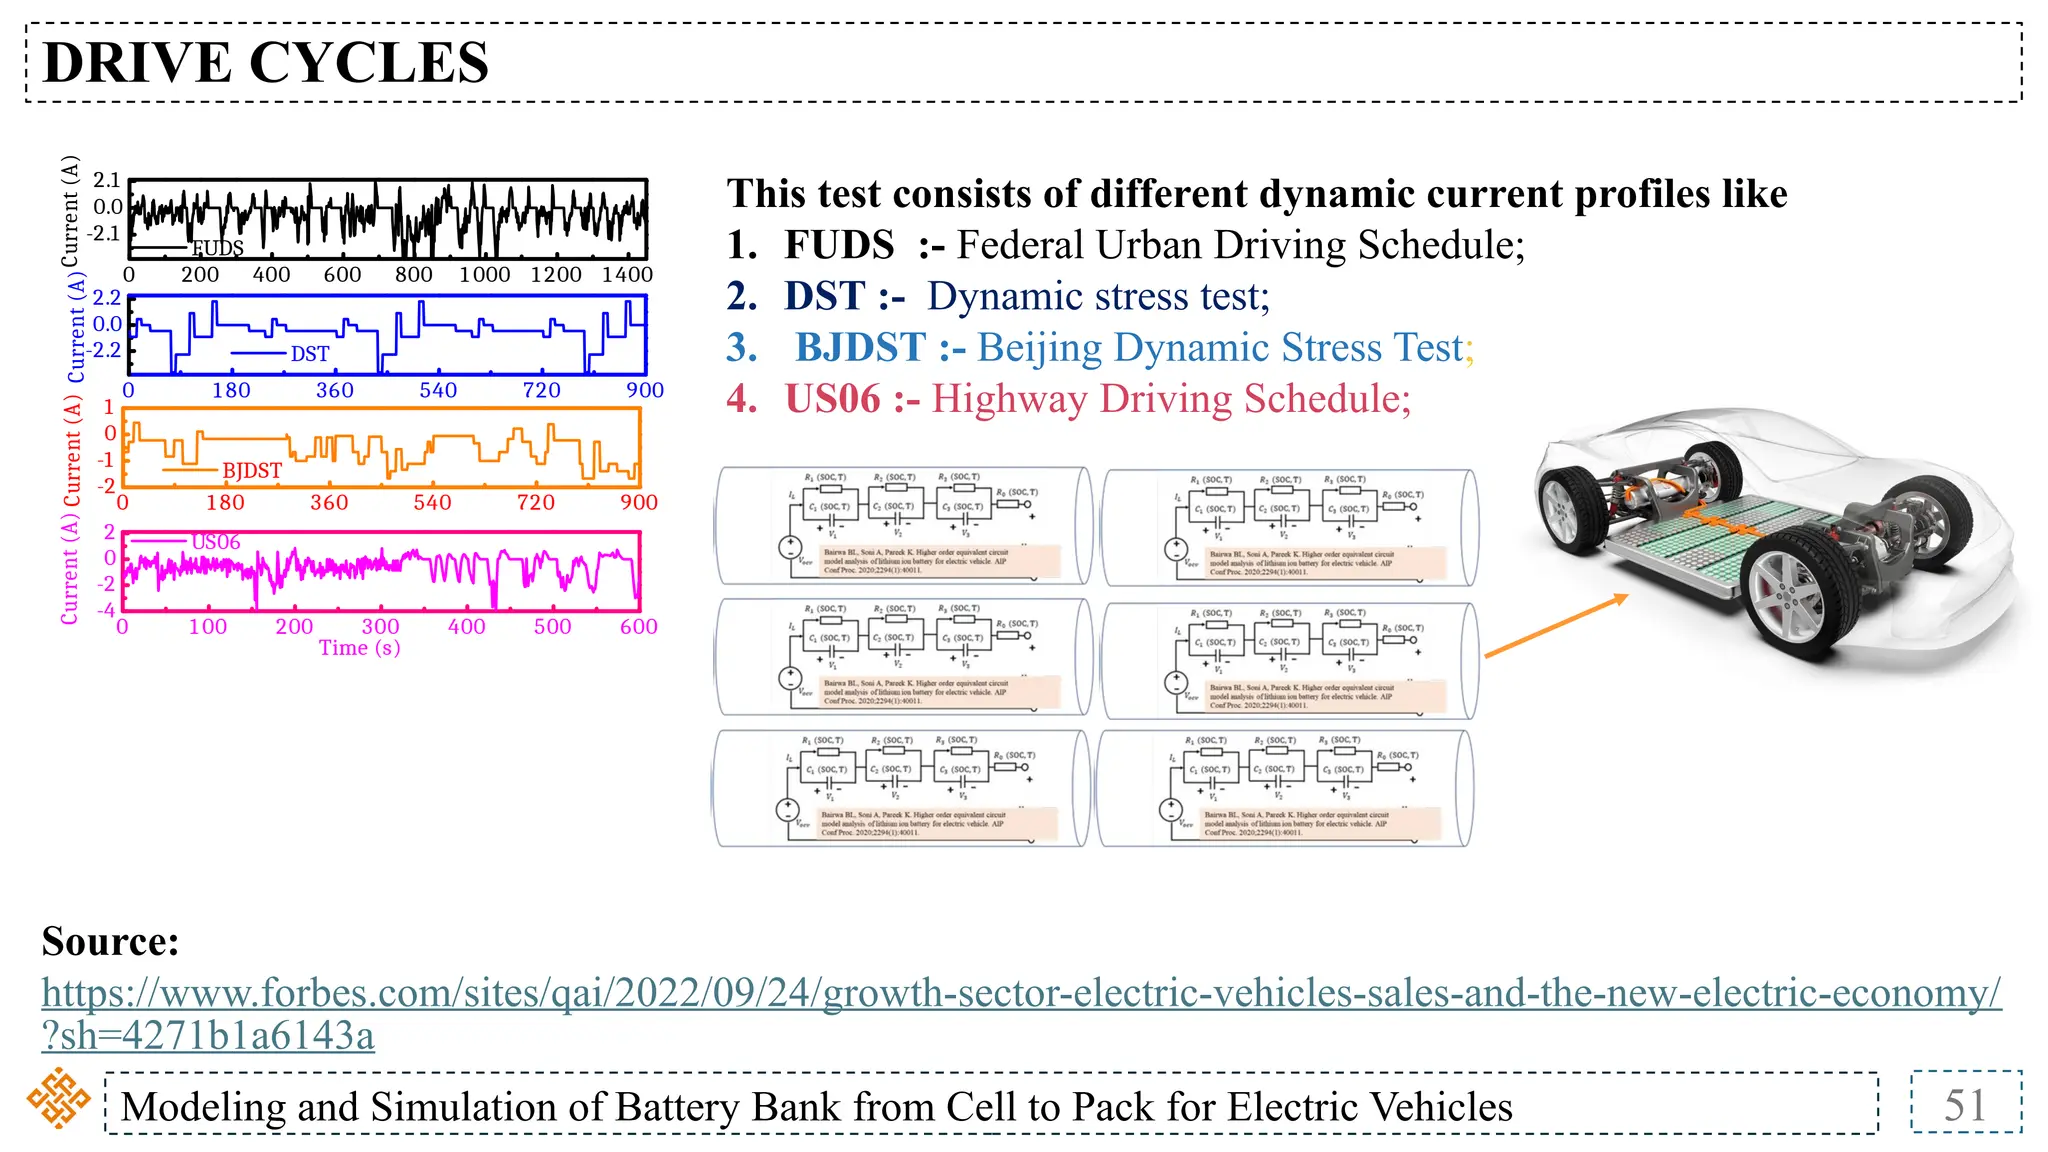
Drive Cycles
0 100 200 300 400 500 600
Time [s]
0
10
20
30
40
Velocity
[m/s]
US06
0 200 400 600 800 1000 1200 1400
Time [s]
0
10
20
30
Velocity
[m/s]
UDDS
0 200 400 600 800 1000 1200
Time [s]
0
10
20
30
40
Velocity
[m/s]
NEDC
0 500 1000 1500 2000 2500
Time [s]
0
10
20
30
Velocity
[m/s]
FTP75](https://image.slidesharecdn.com/1b-241201175339-eb9f2b90/75/1b-Battery-Basics-and-Equivalent-Circuit-Model-pptx-9-2048.jpg)


![Intelligent_Battery_Management_System[1] Automobile_IR111.pptx](https://cdn.slidesharecdn.com/ss_thumbnails/intelligentbatterymanagementsystem1automobileir111-230605074054-e78f70f3-thumbnail.jpg?width=640&height=640&fit=bounds)


