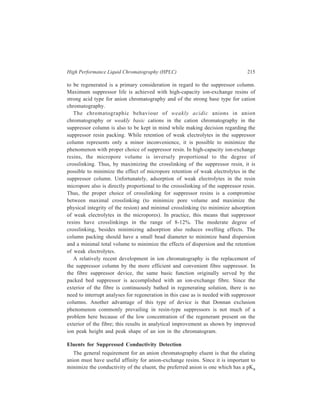
This document is the contents page and introduction section of a textbook on separation and purification techniques. The introduction provides an overview of why separation and purification are important processes in chemistry and biochemistry. It describes how separation techniques work by distributing components between two phases based on differences in properties. The introduction also outlines the basic mathematical principles that describe fractional separation processes involving multiple equilibrium steps between phases.


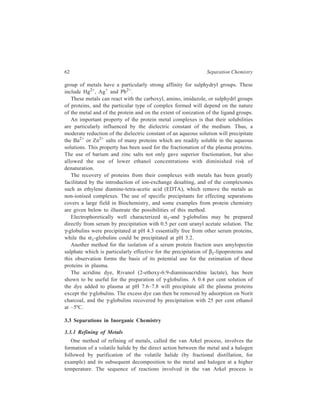
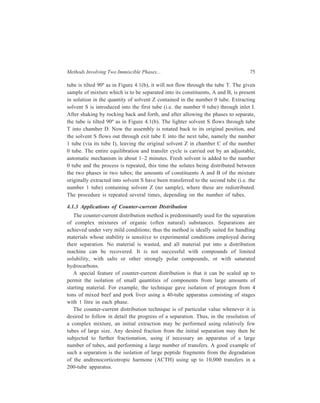
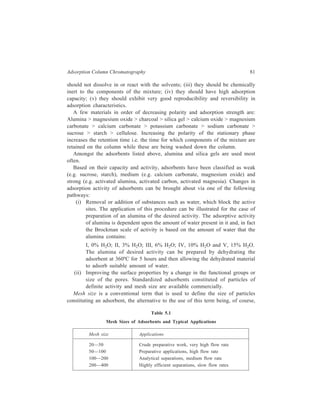
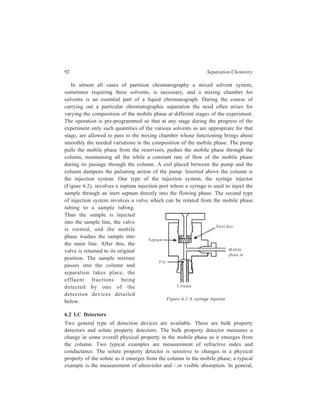
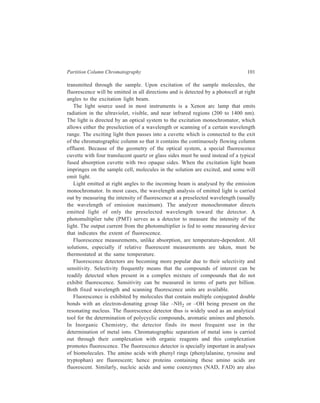
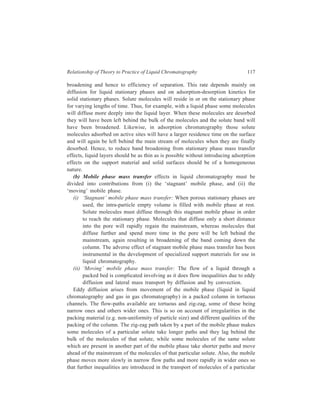
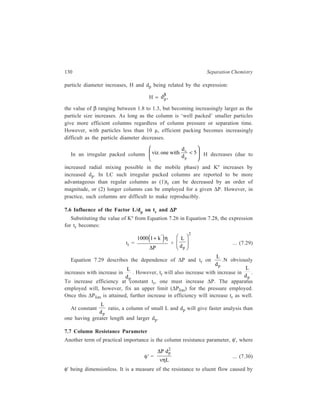
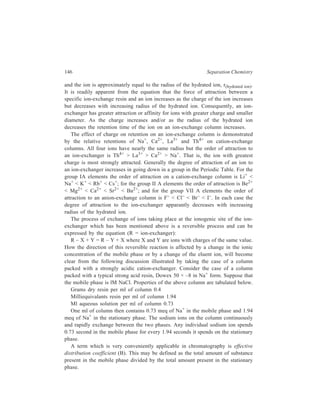
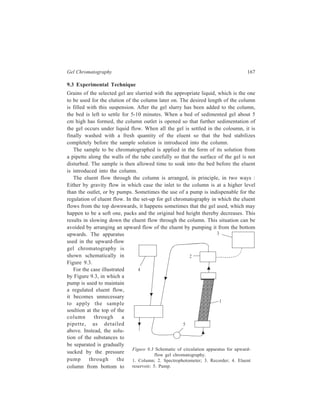
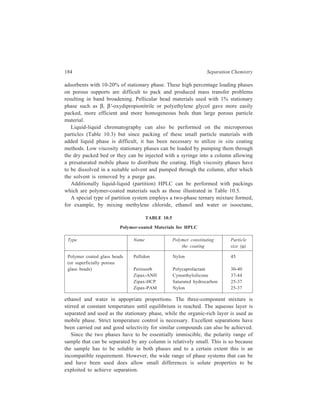
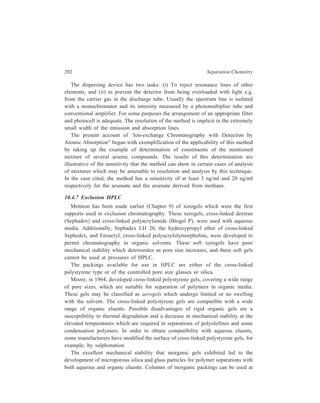
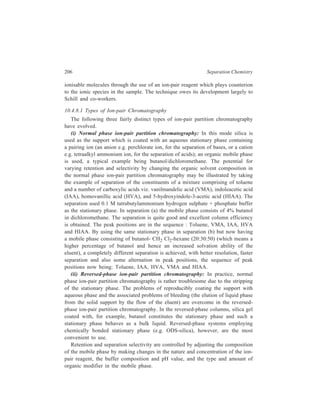
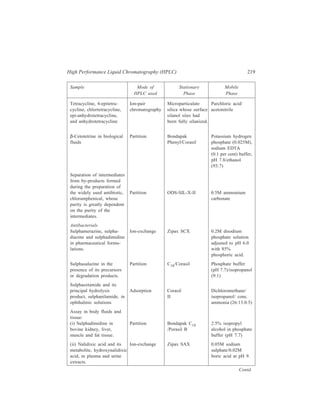
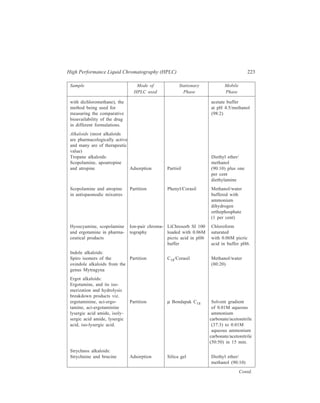
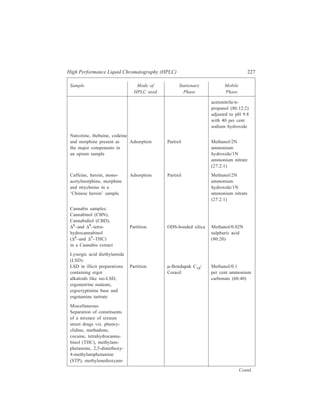
![Contents
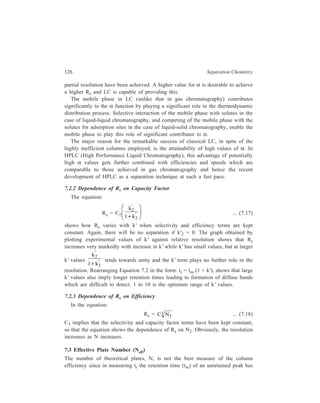
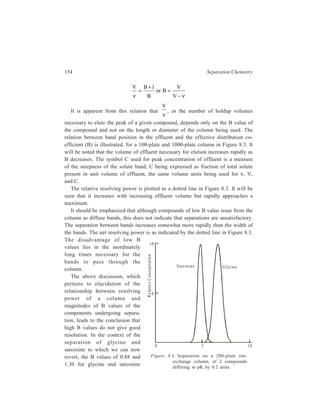
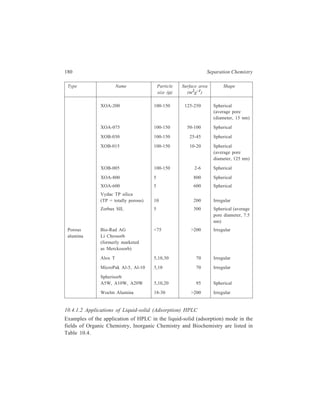
Preface vii
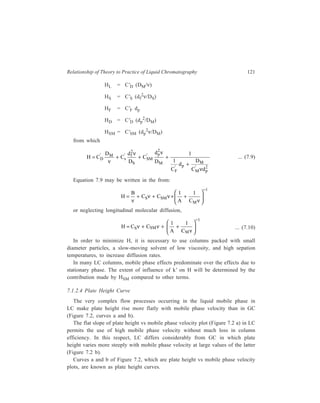
1. Introduction 1
PART I
Traditional Methods of Separation and Purification
2. Methods of Everyday Use 11
PART II
Chemical Methods of Separation and Purification
3. Chemical Methods of Separation and Purification 57
PART III
Chromatographic Techniques
4. Methods Involving Two Immiscible Phases of which
One Phase is Stationary and the other One Mobile 69
5. Adsorption Column Chromatography
[Liquid-Solid Chromatography] 79
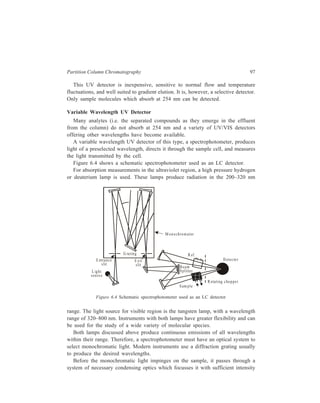
6. Partition Column Chromatography
[Liquid-Liquid Chromatography] 90
7. Relationship of Theory to Practice of Liquid Chromatography 113
8. Ion-Exchange Chromatography 139
9. Gel Chromatography 164
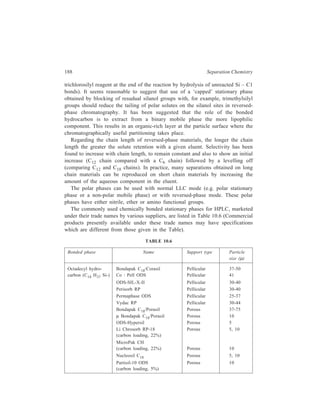
10. High Performance Liquid Chromatography (HPLC) 171
11. Paper Chromatography 240
12. Thin-layer Chromatography 251
13. Gas Chromatography 268
14. Capillary Supercritical Fluid Chromatography 345](https://image.slidesharecdn.com/18252632-separation-chemistry-141124090028-conversion-gate01/85/separation-chemistry-10-320.jpg)


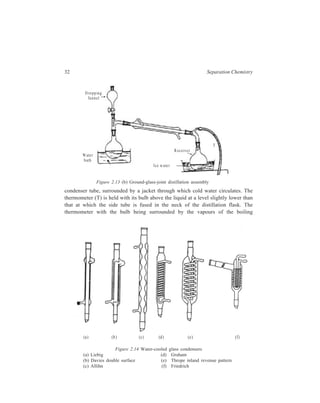
![22 Separation Chemistry
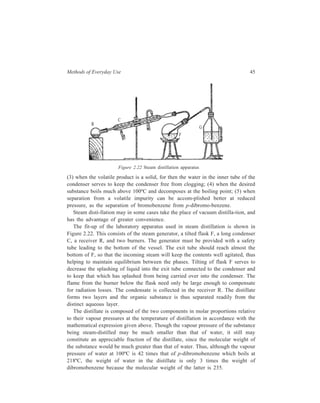
periodically into the flask via the syphon S. The process is thus automatic and
continuous and has the virtue of always being carried out with pure solvent. The
extracted matter is then recovered from the solution collected in the flask by
removal of the solvent by distillation. (Section 2.6)
Application of solid-liquid extraction in the field of Inorganic Chemistry can be
illustrated by taking the examples of separation of (i) lithium chloride from the
chlorides of other members of the alkali metal group and (ii) calcium nitrate from
the nitrates of other members of the alkaline earth group. The solubilities of
sodium chloride and potassium chloride are very small in n-hexanol and
2-ethylhexanol, whereas the solubility of lithium chloride is large enough so that
it can be separated from a mixture of the three chlorides by extraction with these
solvents. Similarly, using a 50-50 per cent mixture of absolute ethanol and ether
calcium nitrate can be removed from a mixture of the anhydrous nitrates of
calcium, barium and strontium.
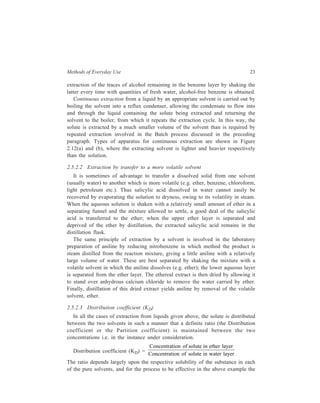
2.5.2 Extraction from liquids
2.5.2.1 Batch and continuous extractions
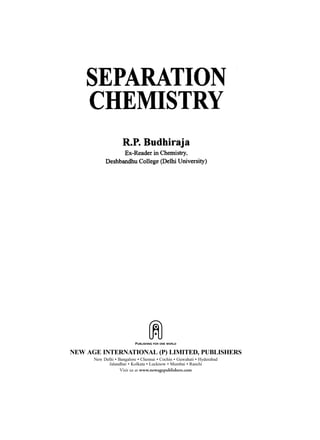
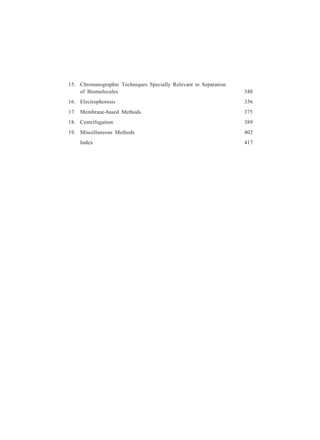
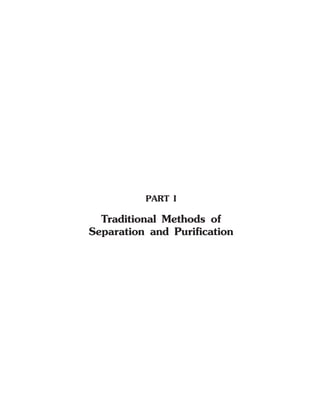
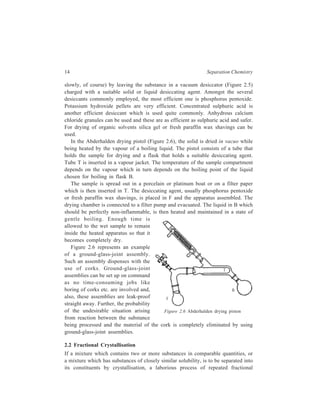
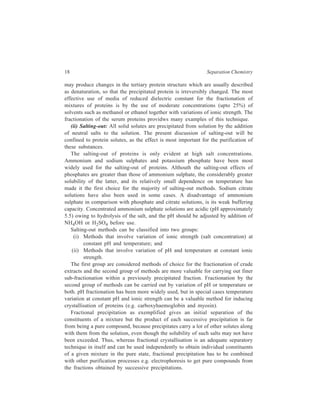
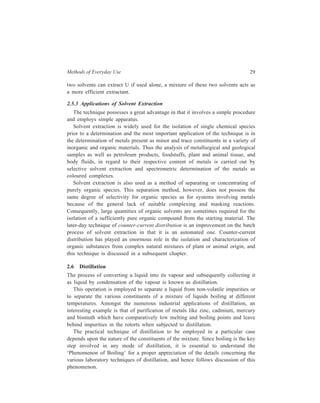
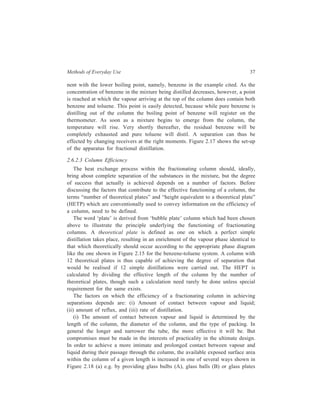
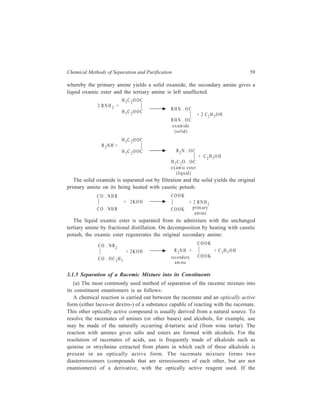
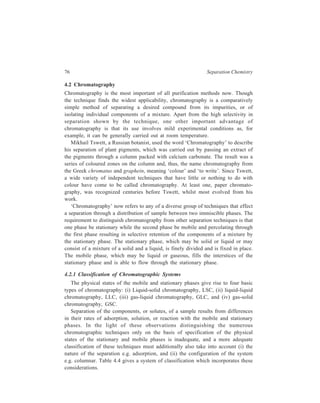
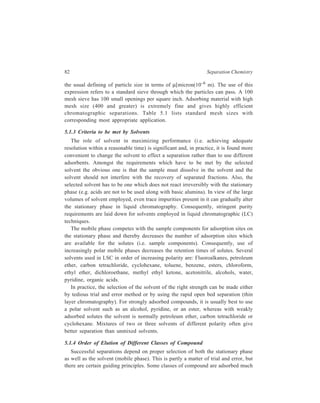
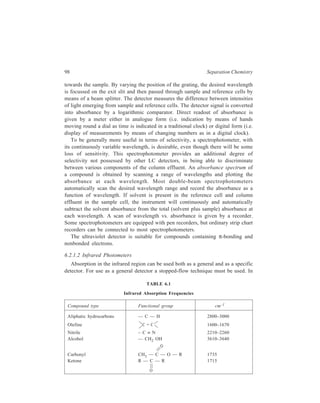
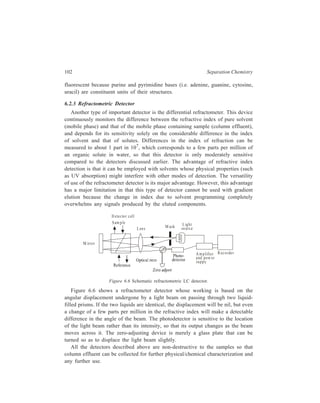
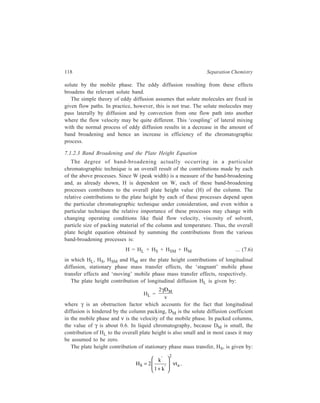
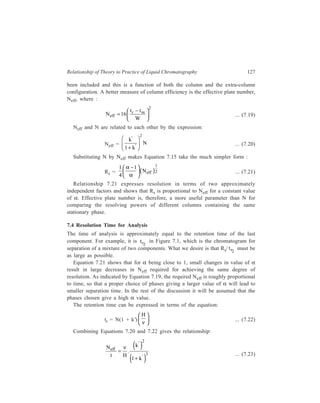
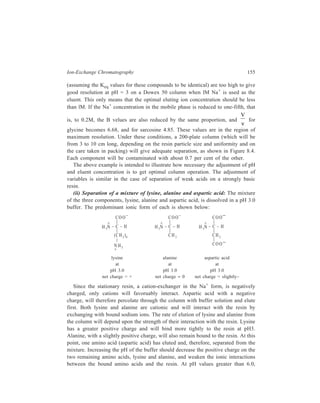
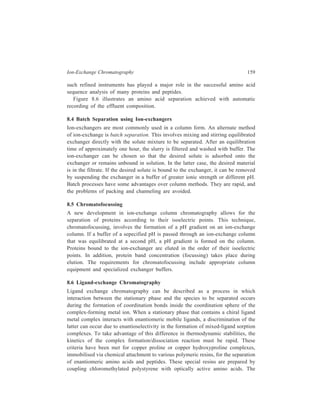
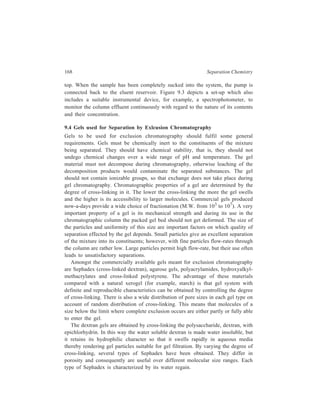
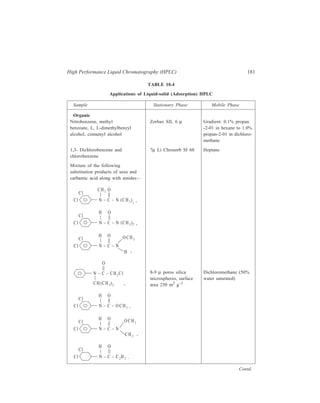
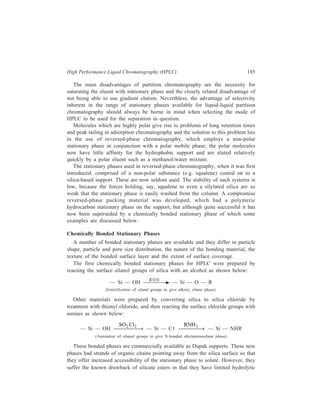
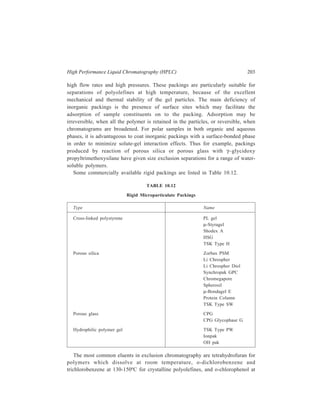
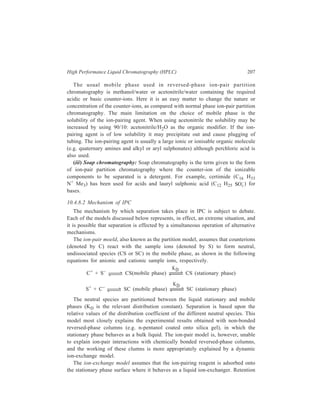
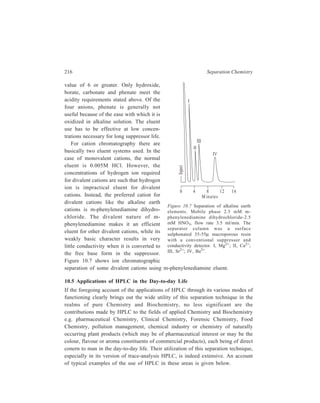
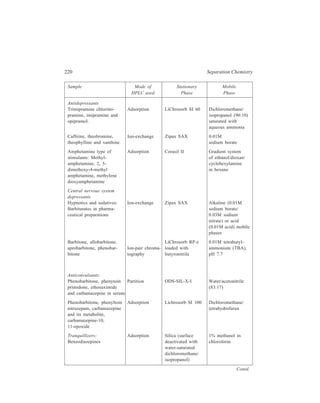
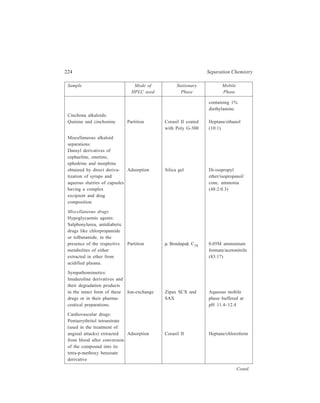
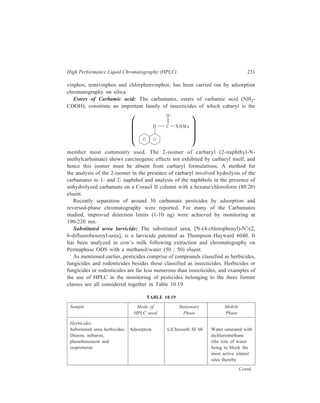
Although no two liquids are absolutely immiscible, yet many examples of pairs
of liquids, such as water and benzene are known which may be regarded as quite
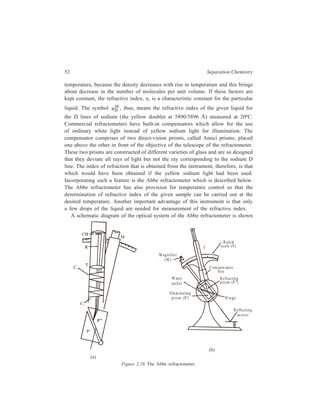
immiscible for all ordinary practical purposes. This
property may sometimes be used to separate one
component from a mixture of liquids. Thus in the Batch
process, benzene is isolated from a solution of benzene
and alcohol by shaking this mixture of the two liquids
(a ) (b )
with an excess of
water in a separa-ting
funnel. Two
r e p r e s e n t a t i v e
types of the sepa-rating
funnel used
1
2
3
4
(a ) (b )
in the Batch
Figure 2.11
process are shown
Separating funnels
in Figure 2.11(a)
and Figure 2.11(b). When the mixture is left
for a while the liquid separates into two
layers. Benzene, which forms the upper layer
[(1) in Figure 2.11(a) or (3) in Figure
2.11(b)] gets separated by running off the
bottom aqueous layer [(2) in Figure 2.11(a)
or (4) in Figure 2.11(b)]. By repeated
Figure 2.12 Apparatus for
continuous extraction of a liquid](https://image.slidesharecdn.com/18252632-separation-chemistry-141124090028-conversion-gate01/85/separation-chemistry-33-320.jpg)
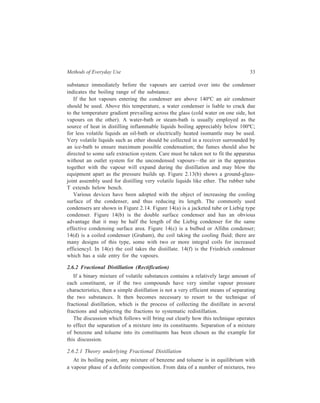
![Methods of Everyday Use 27
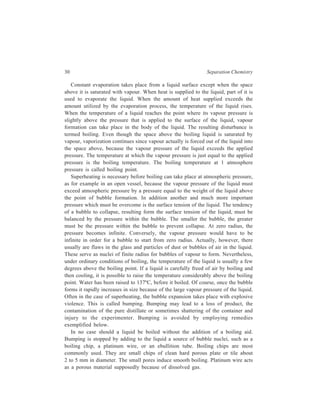
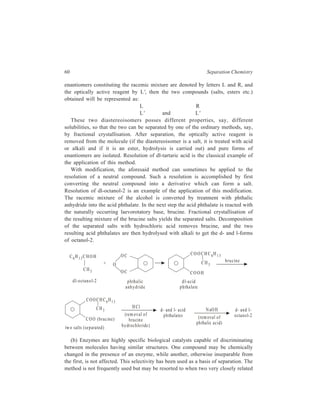
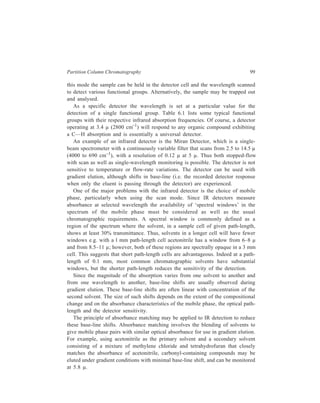
results when the ligand employed uses only one atom at a time as a donor towards
the metal ion. On account of their stability chelates constitute the most important
class of complexes in liquid-liquid extraction.
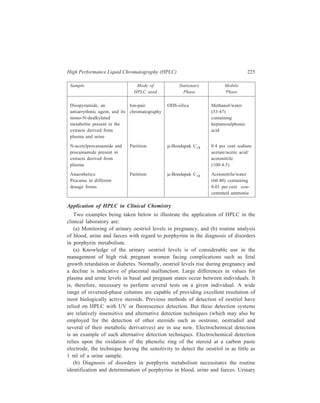
Form amongst the numerous ligands used for metal ion complexation, a few are
given below as examples:
N
OH
8-Hydroxyquinoline
H O 2 NH3
Aquo Ammino N N CH3
CH3 N eocuproin
Neutral chelates are easily extracted in organic solvents. A charged chelate
combines with an oppositely charged ion to produce a neutral entity which is
extractable by an organic solvent. For example, the cationic chelate formed
between Cu+ and neocuproin combines with the anion C104
–, to give an uncharged
entity which is extractable with an organic solvent like chloroform.
An alternative to the above procedure of separation of metal ions from a
solution is masking or sequestering. The given solution may be supposed to
contain two metal ions, Am+ and Bn+, of which the separation is to be carried out
by liquid-liquid extraction through complexation. A complexing ligand is added to
the solution so that the metal ion Am+ is changed into a complex that is not
extractable by the added organic extractant. By this masking or sequestering of the
ion Am+, it is only the metal ion Bn+ which will distribute itself between the
original liquid phase and the added liquid extractant. By repeated extraction using
fresh quantities of the organic extractant, almost complete separation of Am+ and
Bn+ can be achieved.
In liquid-liquid extraction by solvation, the solvent itself takes part in
complexation of the metal ion. This is brought about by donation of electrons by
the donor atom present in the solvent molecule to the coordination sphere of the
metal ion. Such an association of the solvent molecules with the metal ion results
in the formation of a solvated complex that is extractable in the solvent. Thus, for
example, octanol, C8 H17–OH, extracts Co2+ in the presence of perchlorate ion as
[Co (C8 H17–OH)] (C104)2. Extraction by solvation generally employs oxygenated
solvents such as alcohols, ethers or ketones or neutral organophosphorus
compounds. These solvents stand the competition from water for solvation of the
metal ion successfully because of the higher availability of electrons from their
donor atoms.
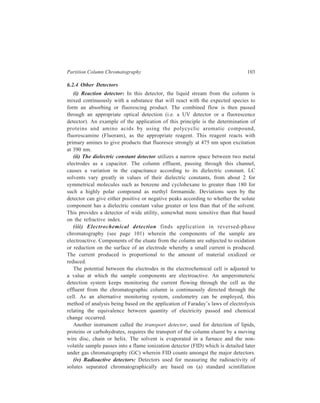
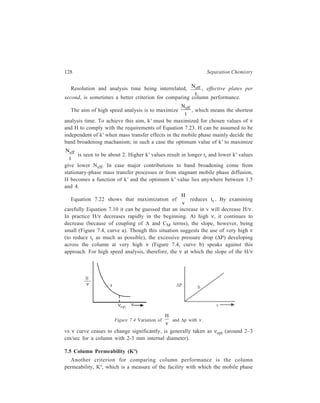
Liquid-liquid extraction by ion-pair formation involves formation of an
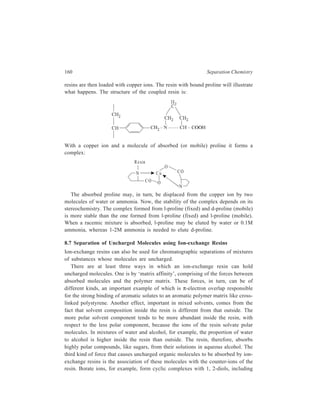
uncharged species as exemplified below for a case in which a tertiary amine like
trioctylamine (TOA) or triisooctylamine (TIOA) is used as the solvent to extract
the anionic metal complex represented by B–.](https://image.slidesharecdn.com/18252632-separation-chemistry-141124090028-conversion-gate01/85/separation-chemistry-38-320.jpg)
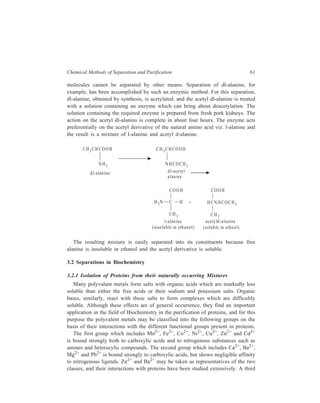
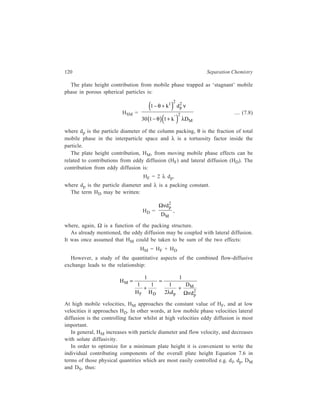
![28 Separation Chemistry
R3Norg + −b g
+ Ha+q + Aa−q R3NH Aorg extraction
+ − + − ( ) R3NH Borg Aaq anion extraction + − + −
R3NH Aorg Baq
The net result is that the liquid tertiary amine has acted as anion exchanger
between the anions A– and B–. Therefore, the extracting amine can also be
designated as a liquid anion-exchanger.
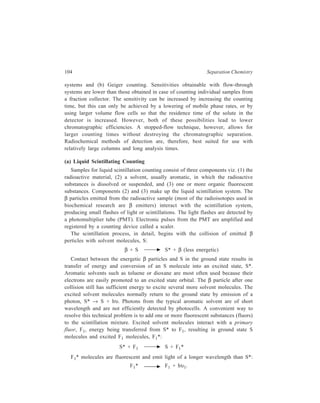
Anionic metal complexes are best extracted by tertiary amines in the presence
of mineral acids, whereas good extractions are obtained with primary and
secondary amines using carboxylic acids. A typical example of the application of
this separatory technique is the extraction of Fe3+, and it is represented by the
following sequence of chemical equilibria:
3+ + 4 − FeCl 4 aq
Feaq Claq
−
R3Norg + Ha+q + Cla−R3NH + q Clorg
−
+ − + − R NH FeCl Cl 3 4 org aq
R3NH Clorg FeCl4 aq
+ − + −
Extraction of Sc and that of U are two important examples of liquid-liquid
extraction by ion-pair formation brought about in the presence of a mineral acid
using a tertiary amine of high molecular weight, nemely, trioctylamine.
Selectivity of separation in liquid-liquid extraction by ion-pair formation is
achieved by making the required variations in parameters like pH used for
complexation, the complexing ligand, and concentration of the extractant effected
by mixing with differing amounts of a suitable diluent which aids extraction. Most
difficult separations, for example, those of acids like malonic, ascorbic, tartaric
and citric in Organic Chemistry have been achieved by this separatory technique.
In the examples considered above, use has been made of liquid anion-exchangers
for extraction by ion-pair formation. Use can also be made of liquid
cation-exchangers for extraction by ion-pair formation and the mechanism of such
an extraction is represented below.
Mn+ + 2n(HX)org M(HX2)n org + nH+
M(HX2)n org + nCaCl2aq [M(Ca X2)n]Clnorg
+ + nClaq
+ nHaq
−
Synergic extraction is still another class of liquid-liquid extractions. Efficiency
of extraction is enhanced in this technique by using two solvents for extraction,
either solvent aiding the extraction by the other and hence the technique being
named as synergic extraction. One of the extractants may be a chelating agent and
the other one a solvating solvent or both may be chelating agents, or bothe may
be solvating agents. An example of synergic extraction is the separation of U using
tributyl phosphate along with 2-thenoyl trifluoroacetone. Although either of these](https://image.slidesharecdn.com/18252632-separation-chemistry-141124090028-conversion-gate01/85/separation-chemistry-39-320.jpg)
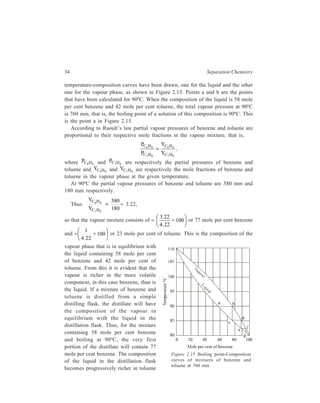
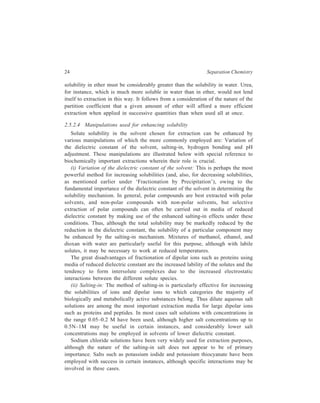
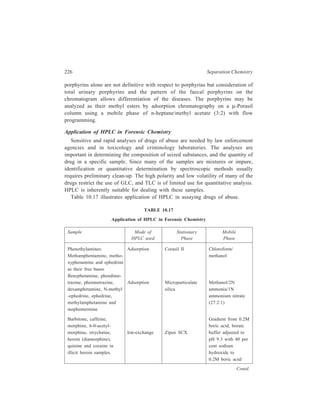
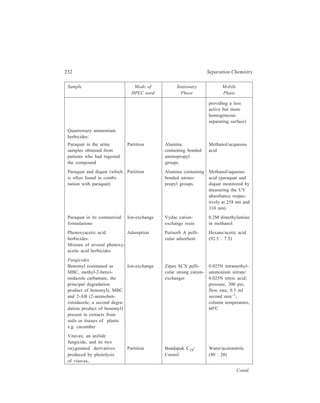
![38 Separation Chemistry
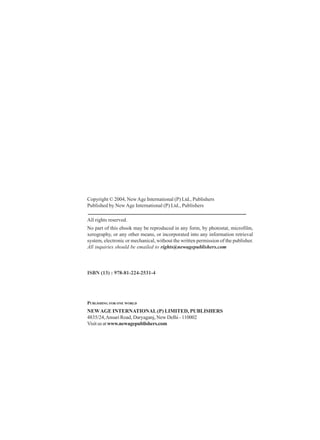
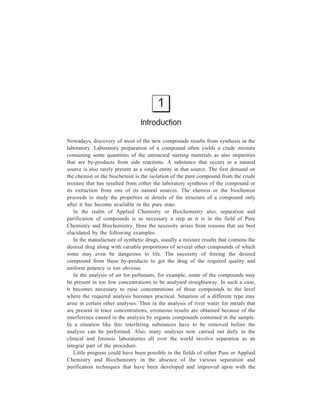
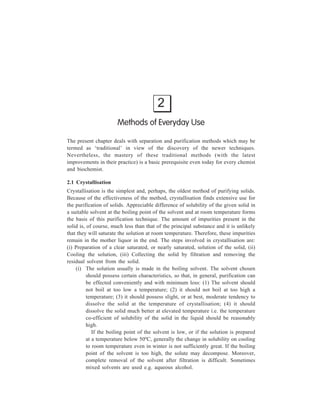
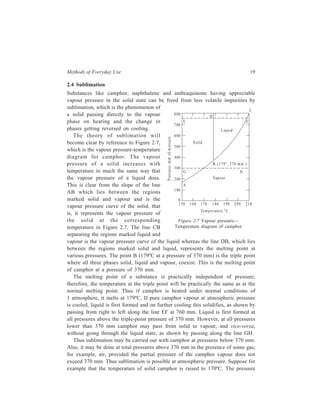
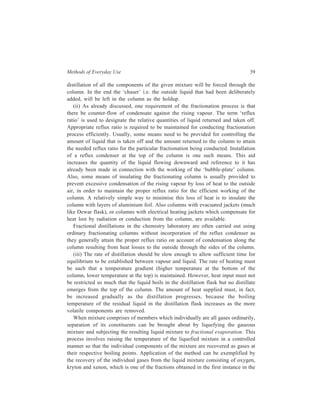
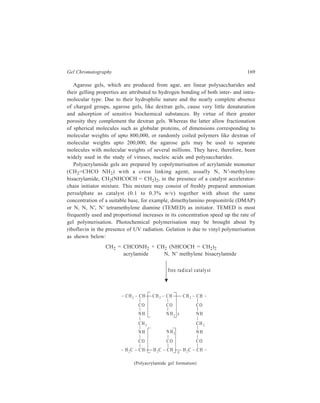
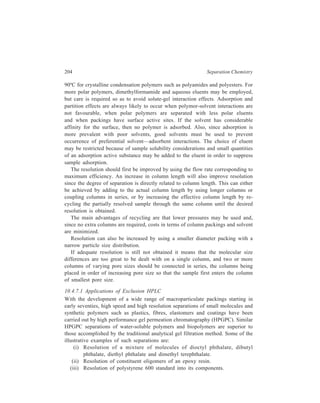
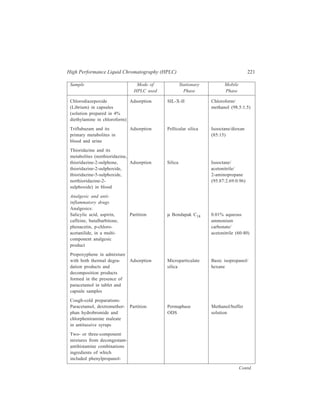
(A ) (B ) (C ) (D ) (E )
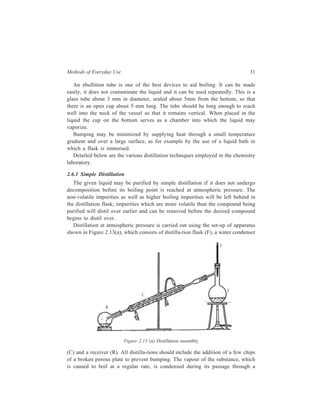
Figure 2.18 (a)
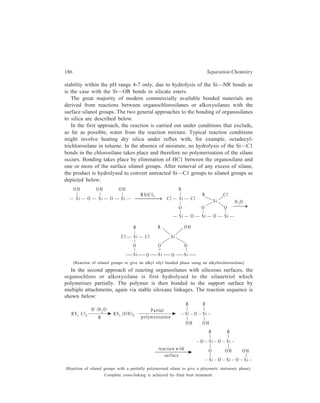
(C), or more satisfactorily by various types of packing such as glass beads (D) or
Lessing’s contact rings (E). The ‘fractional distillation curves’ obtained by plotting
percentage distilled against temperature summarise the results obtained by distilling
a 1:1 mixture of benzene
(b.p. 80º) and toluene
(b.p. 111º) from: (I) An
ordinary distilling flask
with side tube, (II) a
Hampel still-head (D)
[Figure 2.18 (a)] with
glass beads, and (III)
still-head packed with
Lessing’s contact rings
(E) [Figure 2.18 (a)]. A
particularly sharp
separation into two
fractions is noticeable in
the last instance.
It should be apparent
I
II
III
0 20 4 0 6 0 8 0 1 0 0%
110
105
100
95
90
85
80
Tem p eratu re °C
Percentage dis tilled
Figure 2.18 (b)
that those packings that
Fractional distillation curves
present the greatest
amount of surface area (and thus are most efficient) accumulate and hold more
liquid than do less-efficient packings. At the conclusion of the distillation,
therefore, a certain amount of the original sample is lost because of this hold up.
A remedy applied to overcome this drawback is the delibrate addition to the
original mixture of another liquid with a very high boiling point (considerably
above that of the highest boiling component) as a consequence of which complete](https://image.slidesharecdn.com/18252632-separation-chemistry-141124090028-conversion-gate01/85/separation-chemistry-49-320.jpg)
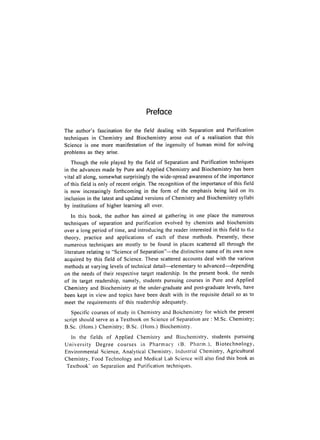
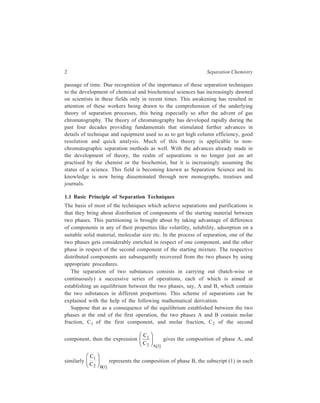
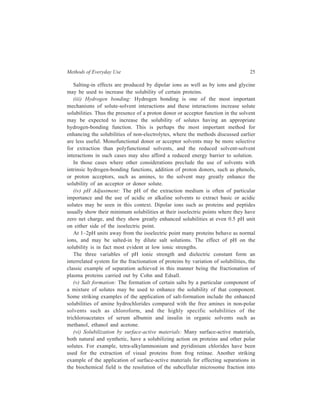
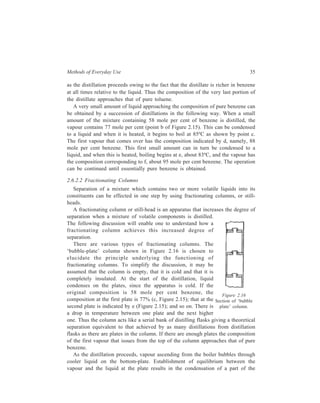
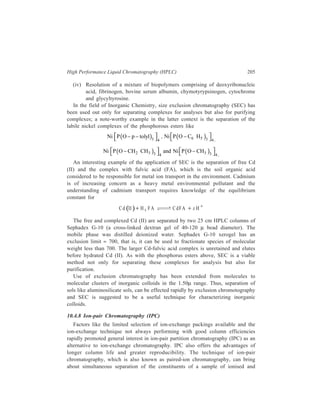
![Methods of Everyday Use 47
temperature has been raised to within 5 or 10 degrees of the expected melting point
so as to minimize the length of time for which the sample is heated.
If the approximate temperature at which the sample will melt is not known, a
preliminary melting point determination should be made in which the temperature
of the bath is raised quickly. Then the more accurate determination using a second
capillary tube containing the sample should be carried out with a rate of heating
of not more than 1ºC per minute near the melting point.
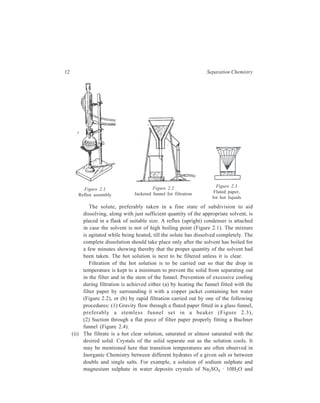
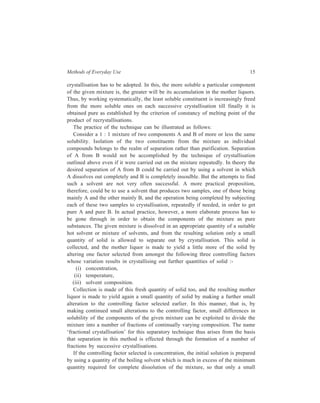
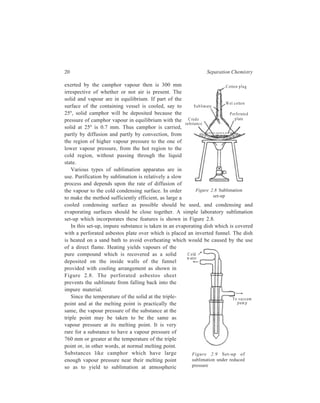
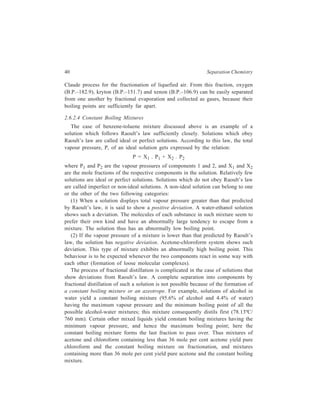
The temperatures to be noted are: The point of first observable shrinkage, the
point at which liquid begins to form, and the point at which the solid is completely
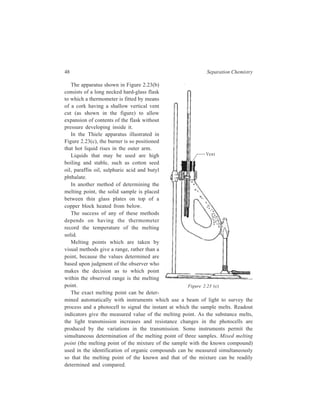
(a) (b)
Figure 2.23 Hot baths for melting-point determination
liquefied. The first one is the softening point. The second and third points
constitute the range of the melting point.
Several of the heating baths used for melting point determination are illustrated
in Figure 2.23.
The simplest liquid bath [Figure 2.23(a)] consists of a beaker of liquid set on
wire gauze above burner, with a thermometer suspended in the liquid. The beaker
is filled one-half to two-thirds full with some suitable liquid which is stirred by an
up-and-down motion of a circular stirrer.](https://image.slidesharecdn.com/18252632-separation-chemistry-141124090028-conversion-gate01/85/separation-chemistry-58-320.jpg)
![50 Separation Chemistry
2.7.2 Boiling Point
The term ‘boiling point’ of a liquid has already been defined earlier and, if
enough of pure liquid is available, its experimental determination is most easily
made by carrying out a simple distillation [Figure 2.13(a)] during which the
vapours of the boiling liquid come into thermal equilibrium with the thermometer
bulb. The temperature of the vapour should be observed during the course of the
distillation, and the temperature range over which most of the material distills
should be taken as the boiling point.
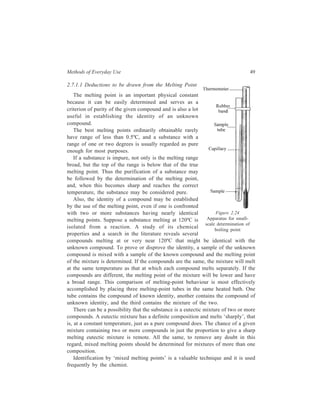
Siwoloboff’s Method
This technique that is quite well adapted to boiling point determination on a
very small scale uses a capillary inverted in a thin-walled boiling tube. A few
drops of the given liquid are placed into the boiling tube which is a 5-7 cm long
glass tube having a diameter of about 5 mm and is sealed at the lower end. A
length of melting point capillary, sealed about 5 mm above its lower end, is
dropped inside the boiling tube. The boiling tube is thereafter fastened, to a
thermometer employing a rubber band (Figure 2.24). Next, the thermometer is
supported in a melting point bath (Figure 2.23), which is heated until a very rapid,
steady stream of bubbles issues from the sealed capillary. The bath is then allowed
to cool slowly, and the temperature at which a bubble just fails to come out of the
capillary and the liquid starts to enter it is taken as the boiling point of the liquid.
If the barometric pressure is not 760 mm, the observed boiling point may be
corrected to the temperature that would be expected at 760 mm. This correction
amounts to about 0.5ºC for each 10 mm deviation of atmospheric pressure from
760 mm—the observed boiling point will be low if the atmospheric pressure is
low.
The boiling points of very small amounts of liquid can be determined accurately
and speedily with electric sensing equipment using photocells. The substance is
put into a special boiling-point sample tube, which is designed to prevent
superheating and achieve smooth and continuous boiling. The tube is illuminated
from the bottom by dark field illumination, and as long as no bubbles are present
(the compound is not boiling), no light passes through the liquid to reach the
photocell sensor. When the boiling point is reached and bubbles begin to rise, the
bubbles reflect light to the photocell. Light is reflected to the photocell with
sufficient intensity and frequency to trigger the readout indicator when the true
boiling point is reached. The initial outgassing bubbles (if any) do not actuate the
sensor. Boiling points are determined with extreme accuracy to ± 0.3ºC.
2.7.2.1 Deductions to be drawn from the Boiling Point
A pure compound boils at a single fixed temperature—the boiling point. In case
the identity of the liquid compound is known, its purity is established if the boiling](https://image.slidesharecdn.com/18252632-separation-chemistry-141124090028-conversion-gate01/85/separation-chemistry-61-320.jpg)
![Methods of Everyday Use 53
in Figure 2.26(a) and the instrument in Figure
2.26(b). Water at 20ºC flows through the water jacket
surrounding the prisms (P', P ). The upper prism P
(which can be lifted and lowered around a hinge
common to both the prisms) is lifted and a few drops
of the given liquid are spread on prism P' with a
Figure 2.27 View through the
wooden applicator. The prisms are then cooled
eyepiece of the Abbe
slowly, any excess liquid being squeezed out. The
Refractometer (when the
reflecting mirror is adjusted so that the light source is
refractometer is set to be read,
the intersection of the cross-hairsfalls
reflected into the illuminating prism P', the upper
on the border
surface of which is rough ground. The rough surface
between the light and dark
acts as the source of an infinite number of rays which
fields; the border should be as
pass through the liquid layer (0.1 mm) in all
sharp and free from colour as
possible).
directions. These rays then strike the polished surface
of the refracting prism P and are refracted. The Abbe refractometer in effect
measures the critical angle for refraction of light passing from the liquid to the
glass prism P of known refractive index. The critical ray, R [Figure 2.26(a)],
forms the border between the light and dark portions of the field when viewed with
the telescope, T, which moves with the scale, S. The scale is provided with a
scale magnifier, M. The field seen through the eye-piece appears as shown in
Figure 2.27. The intersection of the cross-hairs, C.H. [Figure 2.26(a)], should be
on the border between the light and dark sections of the field. Since white light
is being used for illumination, coloured indistinct boundary between the light and
dark portions of the field is only to be expected because of the differences in the
refractive indices for light of different wave langths which constitute the white
light. As already mentioned, provision of a compensator is made in the instrument
to counter this problem arising from dispersion of white light at the liquid
interface. The Amici prisms, C1 and C2 [Figure 2.26(a)] comprising the
compensator, are then set as the next step of operating the refractometer so as to
sharpen and achromatise the border between the light and dark sections until the
difference is as sharp and as near black and white as possible. Finally, the
refractive index is read from the scale when the cross-hairs and the border are
lined up as shown in Figure 2.27.](https://image.slidesharecdn.com/18252632-separation-chemistry-141124090028-conversion-gate01/85/separation-chemistry-64-320.jpg)


![64 Separation Chemistry
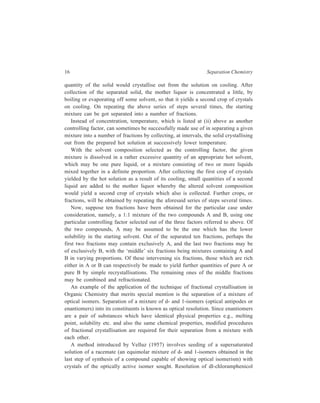
Ce3+ alone is oxidised to the tetrapositive state by alkaline KMnO4 when it is
present in solution along with other tripositive lanthanide cations. Separation of
cerium from other cations is then effected by carrying out this oxidation followed
by the addition of a small quantity of an alkali. Carium alone is precipitated out
as Ce (OH)4 leaving all other tripositive lanthanides in solution. Thus 99% pure
cerium can be obtained starting with a mixture having a cerium content of only
40%.
Eu3+ present in a solution along with other tripositive lanthanide ions can be
isolated almost quantitatively through its reduction to Eu2+. Zn-amalgam reduces
only Eu3+ to the divalent ion leaving the tripositive lons of the other lanthanides
unaffected. Eu2+ is then precipitated out from the aqueous solution as EuSO4,
which is insoluble, leaving behind other lanthanides in solution because the
corresponding sulphates are all soluble in water.
3.3.3 Separations of Isotopes by Exchange Reactions
In ‘exchange reactions’ chemical reaction gives appreciable exchange of
isotopes between the reactants. These reactions can be used for the separation of
isotopes. Obviously, only partial separations can be achieved through exchange
reactions, because these are equilibrium reactions. Some examples of application
of exchange reactions are given below.
(i) When carbon dioxide is kept in contact with water, the liquid gets richer
in 16O and the gas in 18O:
C16O2 + 2H2
18O C18O2 + 2H2
16O
(ii) Isotopic exchange reaction between hydrogen gas and water establishes
the following equilibrium:
HD + H2O H2 + HDO
As a result of this equilibrium, concentration of deuterium in water gets three
to four times as great as in hydrogen.
(iii) Passage of lithuim chloride solution down a column containing sodium
zeolite yields an outgoing solution which is richer in 7Li in comparison
with the starting solution:
Na[AlSiO4] + 6Li+ 6Li [AlSiO4] + Na+
Na[AlSiO4] + 7Li+ 7Li [AlSiO4] + Na+
This happens because 6Li+ reacts faster than 7Li+.
3.4 Conclusion
The examples cited in this chapter are only illustrative of the versatile applicability
of chemical methods for carrying out separation and purification in Chemistry and](https://image.slidesharecdn.com/18252632-separation-chemistry-141124090028-conversion-gate01/85/separation-chemistry-75-320.jpg)

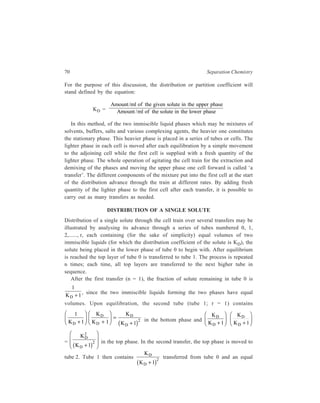
![4
Methods Involving Two Immiscible Phases of which
One Phase is Stationary and the other One Mobile
Although the conventional techniques of purification like distillation, sublimation
and crystallisation etc. with the latest improvements in them in terms of technique
and equipment are as important even today as ever before, they have been
increasingly supplanted by new separation and purification techniques amongst
which chromatography, as practised in its numerous forms, is the most outstanding
example. The importance of these newer techniques can be easily appreciated
when it comes to dealing with compounds of high molecular weights such as
proteins whose purification is not easily amenable to conventional methods dealt
with in the previous two chapters. The present chapter discusses two of these
newer techniques viz. counter-current distribution and chromatography. The
technique of counter-current distribution (counter-current chromatography) is
atypical of the usual chromatographic techniques in that neither of the two phases
in it is supported on an inert support, though the separation of compounds by it
is also based upon the different distribution coefficients between two immiscible
phases of which one phase is mobile and the other one stationary, as are the
separations in conventional chromatography. Because of its bulk (which arises
from the numerous techniques by which chromatography is usually practised, the
topic of typical chromatography has been discussed in detail, technique-wise, in
several subsequent chapters, this topic having been dealt with in just an
introductory manner in this chapter.
4.1 Counter-current Distribution [Counter-current Chromatography (CCC)]
Liquid-liquid partition methods referred to in the previous chapter can be extended
even to the separation of solutes possessing only small differences in their partition
coefficients by a method called counter-current distribution. The technique of
counter-current distribution, developed mainly by Craig, is a multiple partition
process with a large number of stages, entirely discontinuous and stepwise in
nature.
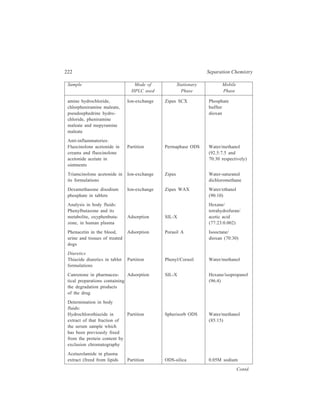
4.1.1 Theory of Counter-current Distribution
The following discussion explains the theory underlying the separation of
constituents of a mixture effected by the counter-current distribution procedure.](https://image.slidesharecdn.com/18252632-separation-chemistry-141124090028-conversion-gate01/85/separation-chemistry-79-320.jpg)
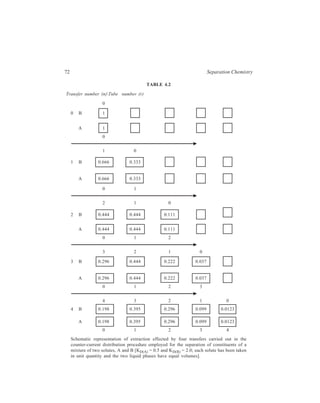
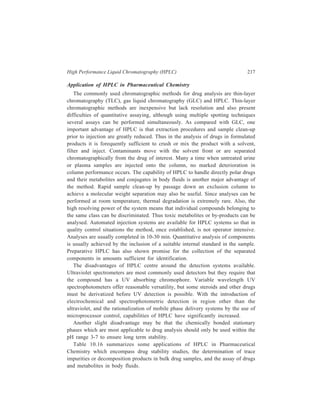
![72 Separation Chemistry
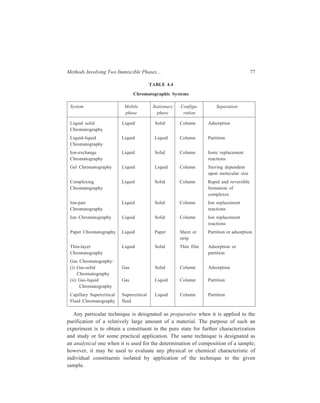
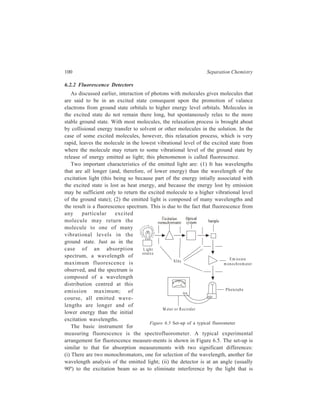
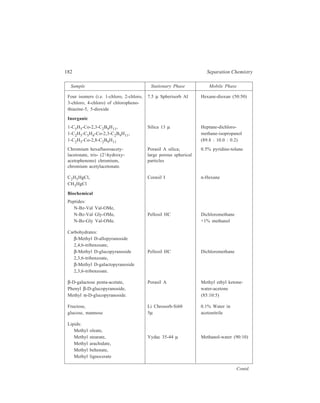
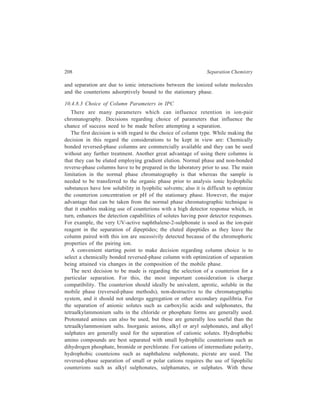
TABLE 4.2
Transfer number (n)Tube number (r)
0
0 B 1
A 1
0
1 0
1 B 0.666 0.333
A 0.666 0.333
0 1
2 1 0
2 B 0.444 0.444 0.111
A 0.444 0.444 0.111
0 1 2
3 2 1 0
3 B 0.296 0.444 0.222 0.037
A 0.296 0.444 0.222 0.037
0 1 2 3
4 3 2 1 0
4 B 0.198 0.395 0.296 0.099 0.0123
A 0.198 0.395 0.296 0.099 0.0123
0 1 2 3 4
Schematic representation of extraction effected by four transfers carried out in the
counter-current distribution procedure employed for the separation of constituents of a
mixture of two solutes, A and B [KD(A) = 0.5 and KD(B) = 2.0; each solute has been taken
in unit quantity and the two liquid phases have equal volumes].](https://image.slidesharecdn.com/18252632-separation-chemistry-141124090028-conversion-gate01/85/separation-chemistry-82-320.jpg)
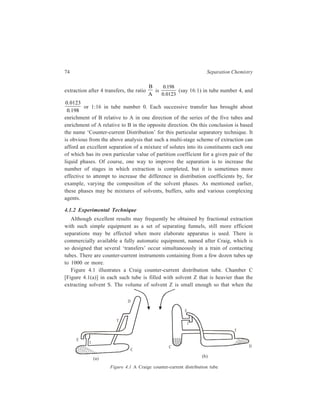
![74 Separation Chemistry
extraction after 4 transfers, the ratio
B
A
is
0.198
0.0123
(say 16:1) in tube number 4, and
0.0123
0.198
or 1:16 in tube number 0. Each successive transfer has brought about
enrichment of B relative to A in one direction of the series of the five tubes and
enrichment of A relative to B in the opposite direction. On this conclusion is based
the name ‘Counter-current Distribution’ for this particular separatory technique. It
is obvious from the above analysis that such a multi-stage scheme of extraction can
afford an excellent separation of a mixture of solutes into its constituents each one
of which has its own particular value of partition coefficient for a given pair of the
liquid phases. Of course, one way to improve the separation is to increase the
number of stages in which extraction is completed, but it is sometimes more
effective to attempt to increase the difference in distribution coefficients by, for
example, varying the composition of the solvent phases. As mentioned earlier,
these phases may be mixtures of solvents, buffers, salts and various complexing
agents.
4.1.2 Experimental Technique
Although excellent results may frequently be obtained by fractional extraction
with such simple equipment as a set of separating funnels, still more efficient
separations may be effected when more elaborate apparatus is used. There is
commercially available a fully automatic equipment, named after Craig, which is
so designed that several ‘transfers’ occur simultaneously in a train of contacting
tubes. There are counter-current instruments containing from a few dozen tubes up
to 1000 or more.
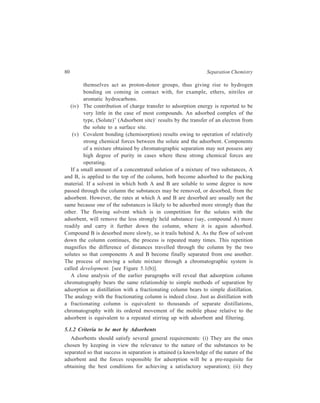
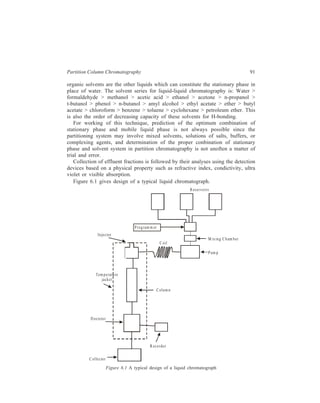
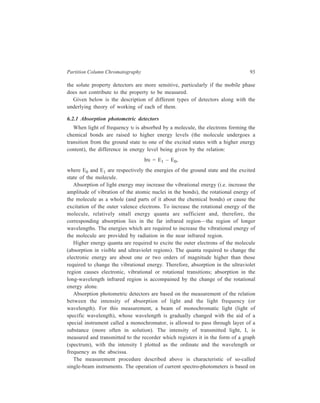
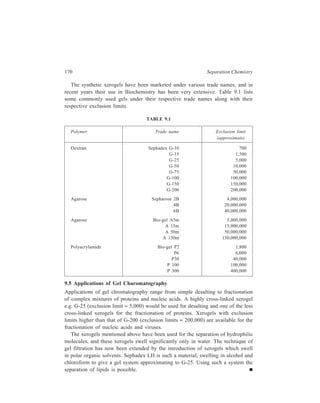
Figure 4.1 illustrates a Craig counter-current distribution tube. Chamber C
[Figure 4.1(a)] in each such tube is filled with solvent Z that is heavier than the
extracting solvent S. The volume of solvent Z is small enough so that when the
I
C
E
(a) (b)
Figure 4.1 A Craige counter-current distribution tube
T
D
C
I
E
T
D](https://image.slidesharecdn.com/18252632-separation-chemistry-141124090028-conversion-gate01/85/separation-chemistry-84-320.jpg)
![5
Adsorption Column Chromatography
[Liquid-Solid Chromatography (LSC)]
Adsorption chromatography, the oldest of the chromatographic methods, originated
from the classical investigations of Tswett (see page 67), who first described these
in 1906. It was not before a lapse of many years that Kuhn Winterstein and
Lederer rediscovered this method of separation of complex natural mixtures in the
early thirties of the twentieth century. In a chromatographic system in which the
stationary phase is a solid as it is in liquid-solid chromatography carried out in a
vertical tube (column), the separation that results is brought through the process of
adsorption and desorption.
5.1 Working of the Technique
5.1.1 Theory underlying Adsorption Column Chromatography
The solid material or adsorbent provides a very large surface area and has the
ability to absorb chemical substances on its surface through such physical and
chemical interactions as (i) Van der Waals forces, (ii) Inductive force, (iii)
Hydrogen bonding, (iv) Charge transfer and (v) Covalent bonding.
(i) Vander Waals forces hold neutral molecules together in the liquid or solid
state. Adsorption based on this is purely physical in nature characterized
by low adsorption energies and rapid equilibrium being set up, and results
in giving good separation. Adsorption of non-polar solutes on non-polar
adsorbents occurs by play of van der Waals forces as, for example, in the
case of hydrocarbons on graphite.
(ii) Inductive forces or dipole-dipole attractions arise when a chemical bond
has a permanent electrical field with it (e.g. C–NO2, C–Cl etc.). The
electrons of an adjacent atom or group or molecule get polarised under the
influence of this field. This in turn gives rise to an induced dipole-dipole
attraction between the adsorbent and the solute. Many adsorptions on
alumina illustrate operation of these inductive forces.
(iii) Hydrogen bonding becomes important when the solutes have a proton-donor
group which can undergo hydrogen bonding with the polar groups
present at the surface of the adsorbent (e.g. the surface hydroxyl groups
possessed by silica or alumina). These surface hydroxyl groups will](https://image.slidesharecdn.com/18252632-separation-chemistry-141124090028-conversion-gate01/85/separation-chemistry-89-320.jpg)
![80 Separation Chemistry
themselves act as proton-donor groups, thus giving rise to hydrogen
bonding on coming in contact with, for example, ethers, nitriles or
aromatic hydrocarbons.
(iv) The contribution of charge transfer to adsorption energy is reported to be
very little in the case of most compounds. An adsorbed complex of the
type, (Solute)+ (Adsorbent site)– results by the transfer of an electron from
the solute to a surface site.
(v) Covalent bonding (chemisorption) results owing to operation of relatively
strong chemical forces between the solute and the adsorbent. Components
of a mixture obtained by chromatographic separation may not possess any
high degree of purity in cases where these strong chemical forces are
operating.
If a small amount of a concentrated solution of a mixture of two substances, A
and B, is applied to the top of the column, both become adsorbed to the packing
material. If a solvent in which both A and B are soluble to some degree is now
passed through the column the substances may be removed, or desorbed, from the
adsorbent. However, the rates at which A and B are desorbed are usually not the
same because one of the substances is likely to be adsorbed more strongly than the
other. The flowing solvent which is in competition for the solutes with the
adsorbent, will remove the less strongly held substance (say, compound A) more
readily and carry it further down the column, where it is again adsorbed.
Compound B is desorbed more slowly, so it trails behind A. As the flow of solvent
down the column continues, the process is repeated many times. This repetition
magnifies the difference of distances travelled through the column by the two
solutes so that components A and B become finally separated from one another.
The process of moving a solute mixture through a chromatographic system is
called development. [see Figure 5.1(b)].
A close analysis of the earlier paragraphs will reveal that adsorption column
chromatography bears the same relationship to simple methods of separation by
adsorption as distillation with a fractionating column bears to simple distillation.
The analogy with the fractionating column is indeed close. Just as distillation with
a fractionating column is equivalent to thousands of separate distillations,
chromatography with its ordered movement of the mobile phase relative to the
adsorbent is equivalent to a repeated stirring up with adsorbent and filtering.
5.1.2 Criteria to be met by Adsorbents
Adsorbents should satisfy several general requirements: (i) They are the ones
chosen by keeping in view the relevance to the nature of the substances to be
separated so that success in separation is attained (a knowledge of the nature of the
adsorbent and the forces responsible for adsorption will be a pre-requisite for
obtaining the best conditions for achieving a satisfactory separation); (ii) they](https://image.slidesharecdn.com/18252632-separation-chemistry-141124090028-conversion-gate01/85/separation-chemistry-90-320.jpg)
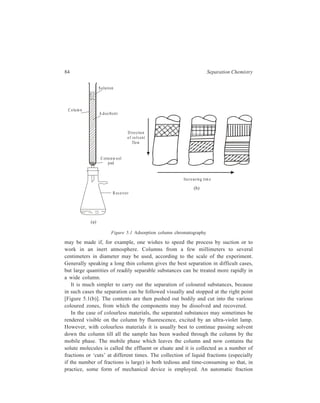
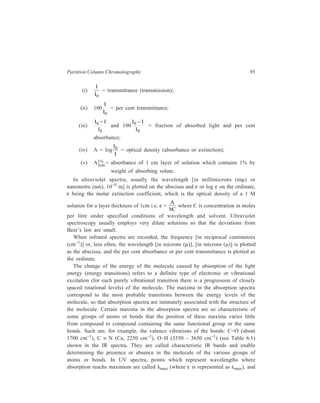
![84 Separation Chemistry
S olu tion
C olumn
A dsorbent
C otto nw o ol
pad
D ire c tion
o f so lven t
flow
R ec e ive r
Increasin g tim e
(b)
(a)
Figure 5.1 Adsorption column chromatography
may be made if, for example, one wishes to speed the process by suction or to
work in an inert atmosphere. Columns from a few millimeters to several
centimeters in diameter may be used, according to the scale of the experiment.
Generally speaking a long thin column gives the best separation in difficult cases,
but large quantities of readily separable substances can be treated more rapidly in
a wide column.
It is much simpler to carry out the separation of coloured substances, because
in such cases the separation can be followed visually and stopped at the right point
[Figure 5.1(b)]. The contents are then pushed out bodily and cut into the various
coloured zones, from which the components may be dissolved and recovered.
In the case of colourless materials, the separated substances may sometimes be
rendered visible on the column by fluorescence, excited by an ultra-violet lamp.
However, with colourless materials it is usually best to continue passing solvent
down the column till all the sample has been washed through the column by the
mobile phase. The mobile phase which leaves the column and now contains the
solute molecules is called the effluent or eluate and it is collected as a number of
fractions or ‘cuts’ at different times. The collection of liquid fractions (especially
if the number of fractions is large) is both tedious and time-consuming so that, in
practice, some form of mechanical device is employed. An automatic fraction](https://image.slidesharecdn.com/18252632-separation-chemistry-141124090028-conversion-gate01/85/separation-chemistry-94-320.jpg)
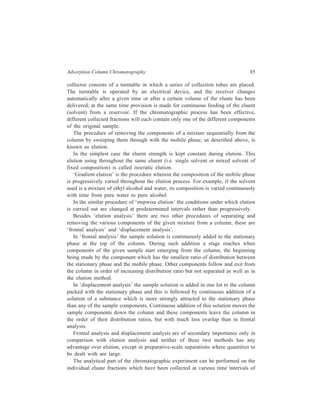
![Adsorption Column Chromatography 89
dibromobenzenes, on silica gel which has polar Si—OH adsorption sites. Because
of the differences in molecular geometry, the para isomer is able to interact with
two surface—OH groups, whereas the meta isomer can only interact with one and
is less strongly retained.
Several cases of application of liquid-solid adsorption chromatography in the
inorganic field have also been reported. The otherwise tedious separation in
Inorganic Chemistry of the ions Li+, Na+, K+ and Mg2+ when present together in
a solution can be effected in the usual manner of adsorption column
chromatography using purified silica gel G as the adsorbent and employing the
mixed solvent, ethanol-acetic acid, for eluting the column. Similarly, separation of
a mixture [e.g. SbCl3, AsCl3 and Bi(NO3)3], consisting of various cations and
anions, has been carried out by liquid-solid column chromatography using alumina
in the presence of tartaric acid. It is, however, to be stressed that these separations
are not governed by adsorption effects alone. Effects such as fractional
precipitation, hydrolysis or complex formation are possible.
Use of organic adsorbents such as 8-hydroxy quinoline has also been suggested
for the separation of inorganic compounds.](https://image.slidesharecdn.com/18252632-separation-chemistry-141124090028-conversion-gate01/85/separation-chemistry-99-320.jpg)
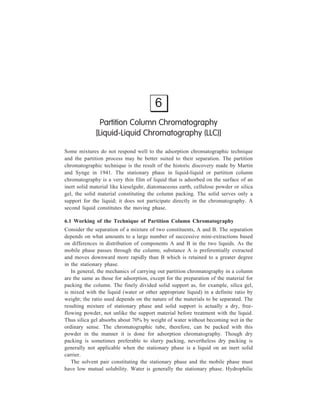
![6
Partition Column Chromatography
[Liquid-Liquid Chromatography (LLC)]
Some mixtures do not respond well to the adsorption chromatographic technique
and the partition process may be better suited to their separation. The partition
chromatographic technique is the result of the historic discovery made by Martin
and Synge in 1941. The stationary phase in liquid-liquid or partition column
chromatography is a very thin film of liquid that is adsorbed on the surface of an
inert solid material like kieselguhr, diatomaceous earth, cellulose powder or silica
gel, the solid material constituting the column packing. The solid serves only a
support for the liquid; it does not participate directly in the chromatography. A
second liquid constitutes the moving phase.
6.1 Working of the Technique of Partition Column Chromatography
Consider the separation of a mixture of two constituents, A and B. The separation
depends on what amounts to a large number of successive mini-extractions based
on differences in distribution of components A and B in the two liquids. As the
mobile phase passes through the column, substance A is preferentially extracted
and moves downward more rapidly than B which is retained to a greater degree
in the stationary phase.
In general, the mechanics of carrying out partition chromatography in a column
are the same as those for adsorption, except for the preparation of the material for
packing the column. The finely divided solid support as, for example, silica gel,
is mixed with the liquid (water or other appropriate liquid) in a definite ratio by
weight; the ratio used depends on the nature of the materials to be separated. The
resulting mixture of stationary phase and solid support is actually a dry, free-flowing
powder, not unlike the support material before treatment with the liquid.
Thus silica gel absorbs about 70% by weight of water without becoming wet in the
ordinary sense. The chromatographic tube, therefore, can be packed with this
powder in the manner it is done for adsorption chromatography. Though dry
packing is sometimes preferable to slurry packing, nevertheless dry packing is
generally not applicable when the stationary phase is a liquid on an inert solid
carrier.
The solvent pair constituting the stationary phase and the mobile phase must
have low mutual solubility. Water is generally the stationary phase. Hydrophilic](https://image.slidesharecdn.com/18252632-separation-chemistry-141124090028-conversion-gate01/85/separation-chemistry-100-320.jpg)
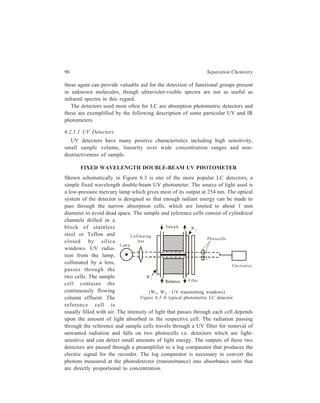
![Partition Column Chromatography 95
(i)
I
I0
= transmittance (transmission);
(ii) 100
I
I0
= per cent transmittance;
(iii)
−
I I
I
0
0
and 100
−
I I
I
0
0
= fraction of absorbed light and per cent
absorbance;
(iv) A = log
I
I
0 = optical density (absorbance or extinction);
(v) A1 1
cm
% = absorbance of 1 cm layer of solution which contains 1% by
weight of absorbing solute.
In ultraviolet spectra, usually the wavelength [in millimicrons (mμ) or
nanometre (nm), 10–9 m] is plotted on the abscissa and ε or log ε on the ordinate,
ε being the molar extinction coefficient, which is the optical density of a 1 M
solution for a layer thickness of 1cm i.e. ε =
A
bC
where C is concentration in moles
per litre under specified conditions of wavelength and solvent. Ultraviolet
spectroscopy usually employs very dilute solutions so that the deviations from
Beer’s law are small.
When infrared spectra are recorded, the frequency [in reciprocal centimetres
(cm–1)] or, less often, the wavelength [in microns (μ)], [in microns (μ)] is plotted
as the abscissa, and the per cent absorbance or per cent transmittance is plotted as
the ordinate.
The change of the energy of the molecule caused by absorption of the light
energy (energy transitions) refers to a definite type of electronic or vibrational
excitation (for each purely vibrational transition there is a progression of closely
spaced rotational levels) of the molecule. The maxima in the absorption spectra
correspond to the most probable transitions between the energy levels of the
molecule, so that absorption spectra are intimately associated with the structure of
the molecule. Certain maxima in the absorption spectra are so characteristic of
some groups of atoms or bonds that the position of these maxima varies little
from compound to compound containing the same functional group or the same
bonds. Such are, for example, the valence vibrations of the bonds: C=O (about
1700 cm–1), C ≡ N (Ca, 2250 cm–1), O–H (3550 – 3650 cm–1) (see Table 6.1)
shown in the IR spectra. They are called characteristic IR bands and enable
determining the presence or absence in the molecule of the various groups of
atoms or bonds. In UV spectra, points which represent wavelengths where
absorption reachs maximum are called λmax (where ε is represented as εmax), and](https://image.slidesharecdn.com/18252632-separation-chemistry-141124090028-conversion-gate01/85/separation-chemistry-105-320.jpg)
![Relationship of Theory to Practice of Liquid Chromatography 123
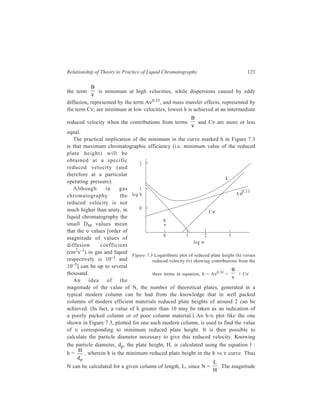
the term
B
ν is minimum at high velocities, while dispersions caused by eddy
diffusion, represented by the term Aν0.33, and mass transfer effects, represented by
the term Cν, are minimum at low velocities, lowest h is achieved at an intermediate
reduced velocity when the contributions from terms
B
ν and Cν are more or less
equal.
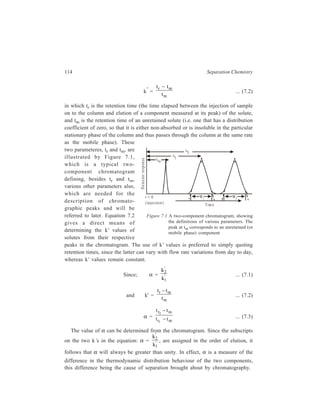
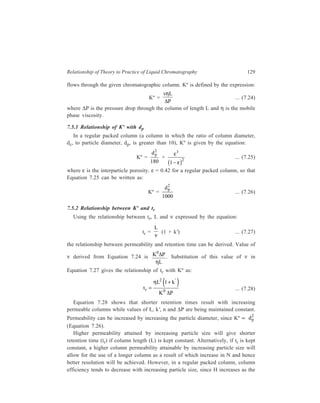
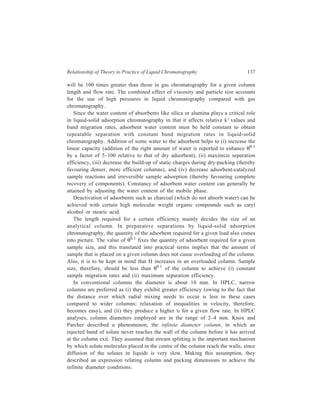
The practical implication of the minimum in the curve marked h in Figure 7.3
is that maximum chromatographic efficiency (i.e. minimum value of the reduced
plate height) will be
obtained at a specific
reduced velocity (and
therefore at a particular
operating pressure).
Although in gas
chromatography the
reduced velocity is not
much higher than unity, in
liquid chromatography the
small DM values mean
that the υ values [order of
magnitude of values of
diffusion coefficient
(cm2s–1) in gas and liquid
respectively is 10–1 and
10–5] can be up to several
thousand.
An idea of the
0 1 2 3
2
1
Figure 7.3 Logarithmic plot of reduced plate height (h) versus
reduced velocity (ν) showing contributions from the
three terms in equation, h = Aν0.33 +
B
ν + Cν
magnitude of the value of N, the number of theoretical plates, generated in a
typical modern column can be had from the knowledge that in well packed
columns of modern efficient materials reduced plate heights of around 2 can be
achieved. (In fact, a value of h greater than 10 may be taken as an indication of
a poorly packed column or of poor column material.) An h-υ plot like the one
shown in Figure 7.3, plotted for one such modern column, is used to find the value
of υ corresponding to minimum reduced plate height. It is then possible to
calculate the particle diameter necessary to give this reduced velocity. Knowing
the particle diameter, dp, the plate height, H, is calculated using the equation l :
h = H
dp
, wherein h is the minimum reduced plate height in the h vs ν curve. Thus
N can be calculated for a given column of length, L, since N =
L
H
. The magnitude
Cν
A ν0 .33
h
log h
log ν
0
B
ν](https://image.slidesharecdn.com/18252632-separation-chemistry-141124090028-conversion-gate01/85/separation-chemistry-133-320.jpg)
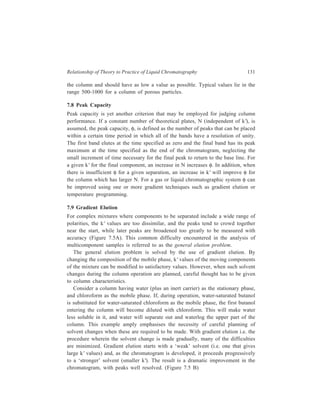
![Relationship of Theory to Practice of Liquid Chromatography 133
also in effecting some increase in the solubility of sparingly soluble substances in
the mobile phase. However, in liquid chromatography, since k' is strongly
dependent on the nature of the solvent, gradient elution is employed for improving
resolution, instead of temperature programming, which is the means used in gas
chromatography for improving resolution.
7.11 Overloading
In the discussion of the mechanism of chromatographic separation, it was tacitly
assumed that the distribution coefficient is a constant, which, in other words,
means occurence of a linear relationship between the concentration of the sample
molecules in the stationary and mobile phases irrespective of the quantity of the
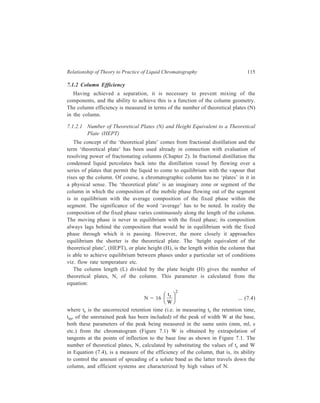
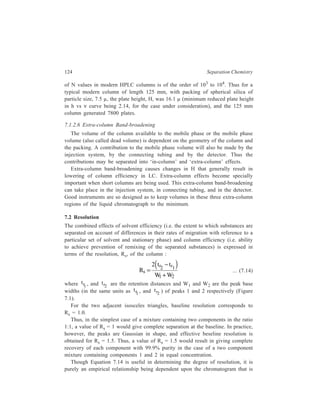
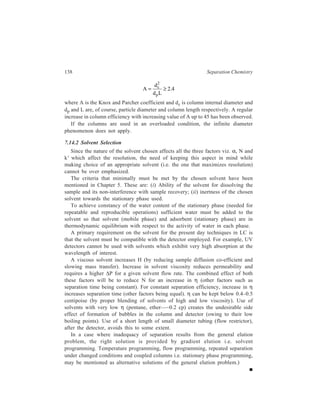
sample. An elution peak with a Gaussian distribution in the chromatogram is taken
to represent such a situation, namely, that the isotherm of the relationship:
Concentration of the solute in the stationary phase
Concentration of the solute in the mobile phase
, is linear [Figure 7.6(a)].
Concentration in
stationary phase
Detector response
Lin ear Langmuir Anti-Langmuir
Concentration in m obile phase
G au ss ian Ta ilin g F ro n tin g
(a ) (b ) (c )
Time
Figure 7.6 Three basic isotherm shapes and their effect on peak shape and retention time.
Under these conditions the retention time is independent of the sample size. When
the distribution coefficient, as often happens, is not independent of sample
concentration, abnormal behaviour of the column results. Skewed peaks are the
result of non-linear distribution isotherms, as shown in Figure 7.6(b) and Figure
7.6(c), and the retention time will vary with sample concentration.](https://image.slidesharecdn.com/18252632-separation-chemistry-141124090028-conversion-gate01/85/separation-chemistry-143-320.jpg)
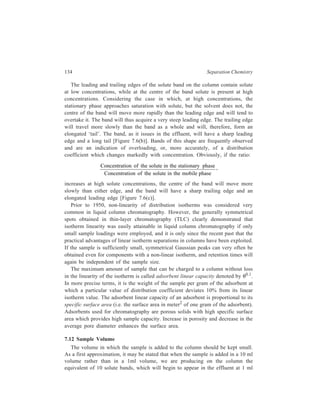
![134 Separation Chemistry
The leading and trailing edges of the solute band on the column contain solute
at low concentrations, while at the centre of the band solute is present at high
concentrations. Considering the case in which, at high concentrations, the
stationary phase approaches saturation with solute, but the solvent does not, the
centre of the band will move more rapidly than the leading edge and will tend to
overtake it. The band will thus acquire a very steep leading edge. The trailing edge
will travel more slowly than the band as a whole and will, therefore, form an
elongated ‘tail’. The band, as it issues in the effluent, will have a sharp leading
edge and a long tail [Figure 7.6(b)]. Bands of this shape are frequently observed
and are an indication of overloading, or, more accurately, of a distribution
coefficient which changes markedly with concentration. Obviously, if the ratio:
Concentration of the solute in the stationary phase
Concentration of the solute in the mobile phase
,
increases at high solute concentrations, the centre of the band will move more
slowly than either edge, and the band will have a sharp trailing edge and an
elongated leading edge [Figure 7.6(c)].
Prior to 1950, non-linearity of distribution isotherms was considered very
common in liquid column chromatography. However, the generally symmetrical
spots obtained in thin-layer chromatography (TLC) clearly demonstrated that
isotherm linearity was easily attainable in liquid column chromatography if only
small sample loadings were employed, and it is only since the recent past that the
practical advantages of linear isotherm separations in columns have been exploited.
If the sample is sufficiently small, symmetrical Gaussian peaks can very often be
obtained even for components with a non-linear isotherm, and retention times will
again be independent of the sample size.
The maximum amount of sample that can be charged to a column without loss
in the linearity of the isotherm is called adsorbent linear capacity denoted by θ0.1.
In more precise terms, it is the weight of the sample per gram of the adsorbent at
which a particular value of distribution coefficient deviates 10% from its linear
isotherm value. The adsorbent linear capacity of an adsorbent is proportional to its
specific surface area (i.e. the surface area in meter2 of one gram of the adsorbent).
Adsorbents used for chromatography are porous solids with high specific surface
area which provides high sample capacity. Increase in porosity and decrease in the
average pore diameter enhances the surface area.
7.12 Sample Volume
The volume in which the sample is added to the column should be kept small.
As a first approximation, it may be stated that when the sample is added in a 10 ml
volume rather than in a 1ml volume, we are producing on the column the
equivalent of 10 solute bands, which will begin to appear in the effluent at 1 ml](https://image.slidesharecdn.com/18252632-separation-chemistry-141124090028-conversion-gate01/85/separation-chemistry-144-320.jpg)
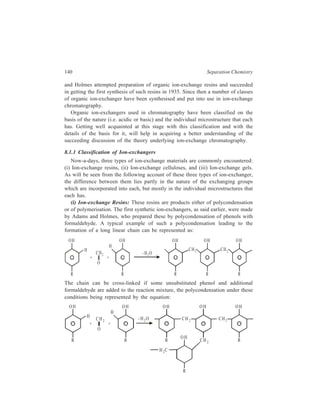
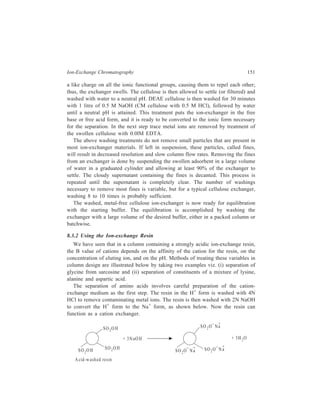
![142 Separation Chemistry
properties. The functional groups are introduced either by subsequent treatment of
the resin or by incorporating the functional groups into the starting material.
If the ion-exchangers liberate and exchange cations they are called cation-exchangers
or catexes. Anion-exchangers or anexes set free and exchange anions.
Each type of exchanger is also classified as strong or weak according to the
ionising strength of the functional group. A strongly acidic cation-exchanger
contains the sulphonic acid group, whereas the weakly acidic carboxylic and
phenolic groups would lead to a weakly acidic cation-exchanger. The functional
groups all dissociate to release hydrogen ions, which are exchanged for other
cations e.g.
Na+C l–
H +C l–
R SO 3H RSO3 H R SO3 Na − − + − − +
(R = organic polymeric matrix)
Similarly, an exchanger with a quaternary basic group is a strongly basic anion-exchanger,
whereas presence of a primary or secondary aromatic or aliphatic
amino group will give a weakly basic anion-exchanger. A typical anion-exchange
reaction with a strongly basic anion-exchanger (a quaternary base) is given by the
equation:
Na+C l–
N a O H + − ( 3 )3 ( 3 )3 R − N + CH O H − R − N + C H Cl−
The preparation of polycondensates has been gradually abandoned and today
ion-exchangers produced mainly by polymerisation reactions are used. Polymeric
ion-exchangers possess higher chemical stability than polycondensates; also it is
easier to make ion-exchangers with the necessary outer shape, porosity and
chemical composition from polymer resins.
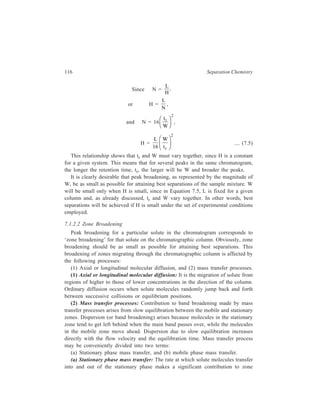
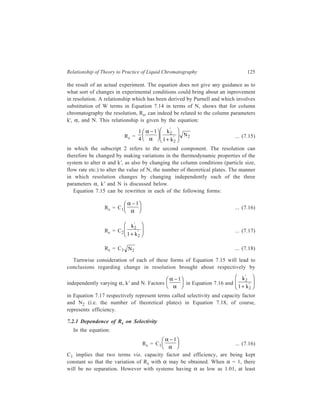
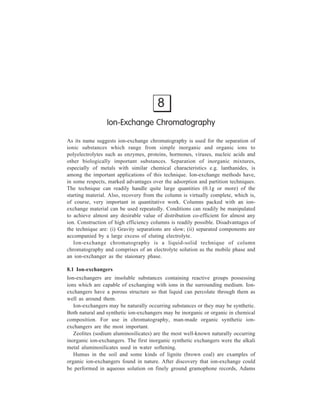
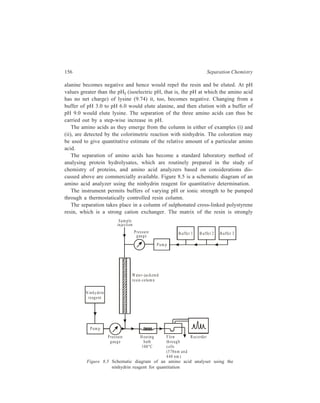
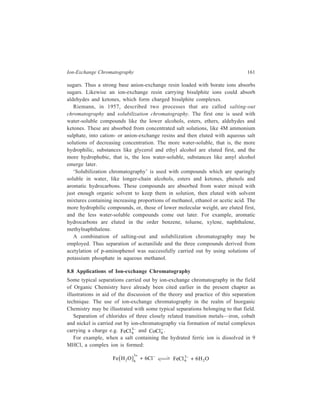
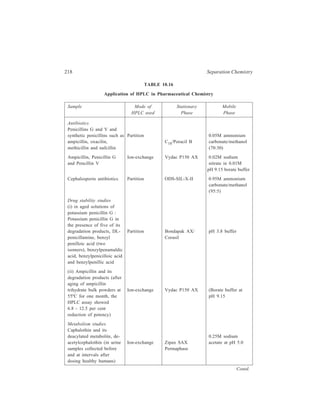
Polymer resin beads may be of two types (Figure 8.1): (i) Microreticular (gel)
[Figure 8.1(a)], and (ii) macroreticular (macroporous) [Figure 8.1(b)]. The gel type
becomes porous on swelling, with the pore
size dependent on the degree of cross-linking.
(ii) Ion-exchange Celluloses :
Derivatives of cellulose with ion-exchanging
groups play an important role
in chromatography of biochemical
mixtures. Carboxy-methyl cellulose [known
as CM — cellulose, represented in Figure
8.2(a)] and diethylaminoethyl cellulose
[DEAE — cellulose, represented in Figure
8.2(b)] are the two ion-exchange celluloses
Micropores
Micropores
M acropores
(a ) (b )
Figure 8.1 Ion-exchange packings
(a) Microreticular ion-exchanger with
small pores.
(b) Macroreticular ion-exchanger with
macropores](https://image.slidesharecdn.com/18252632-separation-chemistry-141124090028-conversion-gate01/85/separation-chemistry-152-320.jpg)
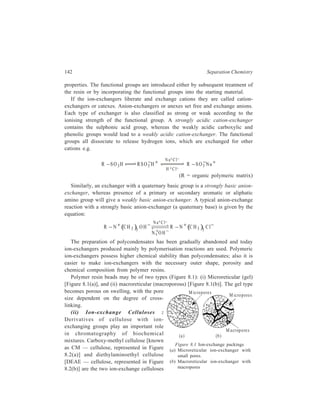
![144 Separation Chemistry
(C2H5)2], sulphoethyl (–C2H4SO3
– ), sulphopropyl (–C3H6SO3
– ) and quaternary
basic groups like – N⊕R3 or N⊕R2 have been prepared. Because of the high
content of hydroxyl groups of dextran, the ion-exchangers based on this
polysaccharide are highly hydrophilic and they, therefore, swell up in water or
electrolyte solutions to give semi-transparent gel particles. These can be packed in
the normal way into columns for chromatography.
Dextran ion-exchangers differ from the cellulose ones primarily in their physical
structures. Though having much larger pores, dextran ion-exchangers are similar
in their physical structure to the microporous type of ion-exchange resins, the
porosity of which is a consequence of swelling. Like ion-exchange resins, dextran
TABLE 8.1
Examples of some commonly used ion-exchangers
Type Polymer Functional group Examples of
commercial products
Weakly acidic Polyacrylic acid –COO– Ambarlite IRC 50
(cation exchanger) Bio-Rex 70
Zeocarb 226
Cellulose or –CH2COO– CM–Sephdex
dextran Cellex CM
Agrose –CH2COO– CM–Sepharose
Strongly acidic Amberlite IR 120
(action exchanger) Polystyrene − SO3
− Bio-Rad AG 50
Dowex 50
Zeocarb 225
Cellulose or
dextran –CH2CH2CH2SO3
– SP-Sephadex
Weakly basic
(anion-exchanger) Polystyrene –CH2N+HR2 Amberlite IR 45
Bio-Rad AC = 3
Dowex WGR
+
H(CH2CH3)2 DEAE-Sephadex
Cellulose or –CH2CH2N
Dextran Cellex D
Agrose –CH2CH2N
+
H(CH2CH3)2 DEAE-Sepharose
+
(CH3)3 Amberlite IRA 401
Strongly basic Polystyrene –CH2N
(anion exchanger) Bio-Rad AG1
Dowex 1
+
(CH3)2 Amberlite IRA 410
–CH2N
Bio-Rad Ag-2
CH2CH2OH Dowex 2
Cellulose or
dextran –CH2CH2N
+
(CH2CH3)2 Cellex T](https://image.slidesharecdn.com/18252632-separation-chemistry-141124090028-conversion-gate01/85/separation-chemistry-154-320.jpg)
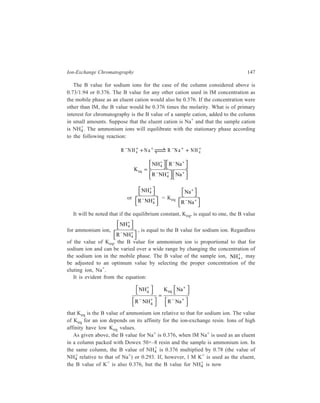
![Ion-Exchange Chromatography 163
232Th(n, r)
233Th −β− →
233
Pa
−β− → 233
U,
the fissionable product 233U must be separated from the thorium matrix. Selective
removal of traces of 233U from Th and from other macroimpurities except Fe was
carried out by passing the solution through AGl-X8 anion exchange resin in the
Cl– form. Further purification of U for removal of Fe was based on a subsequent
passage of the solution through another column of the same resin in the NO3
–
form.
Medicinal radioisotopes for clinical diagnostics and highly specific
radioisotopes for use in tracer and other analytical applications are produced via
accelerator cyclotron, and neutron activation techniques, some examples of theses
radioisotopes being 28Mg, 47Sc, K 42, 43, 38, 201Tl, 123I, 99Mo, Br 76, 77, 97Ru,
18F, 13N, 11C, 15O. In almost every case of the generation of the desired isotope
via electron, photon, proton, neutron, or charged particles activation of the target
nuclide, the produced isotope must be chemically separated from matrix isotopes.
The production of reasonably pure isotopes has been based on selective ion-exchange
separations following the activation of the target nuclide. For example,
99Mo is recovered from nuclear radiated MoO3 following its dissolution in 10M
sodium hydroxide, reduction with 0.2M I2 in alkali solution, acidification to 0.1—
6M with acid, and formation of [Mo (SCN6]3– complex, which is then separated
by an anion exchanger with nitrilodiacetate groups. The anion was then eluted
from the column with mineral acid. Any straightforward adoption of conventional
chemistry with an appropriate ion-exchange separation can be used to isolate and
recover the produced radioisotope.
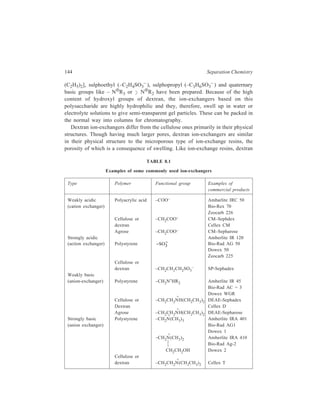
This illustrative account of the applications of ion-exchange chromatography
can be concluded with Table 8.3, which shows the potential of this technique for
effecting separation of constituents of complex mixtures which are not easily
amenable to resolution by other chromatographic techniques.
TABLE 8.3
Separations Resin used Elution method
Aldehydes, ketones, alcohols Anion Ketones and aldehydes held as
bisulphite addition compounds.
Eluted with hot water and NaCl
respectively.
Carboxylic acids Anion Gradient pH elution
Phosphate mixtures e.g. ortho-, Anion lM to 0.005M KCl
pyro-, tri–, tetra– etc.
Lanthanides Cation Stepwise or gradient elution with
citrate buffers.
Transition metals e.g. Ni2+, Co2+, Stepwise elution 12M to 0.005M
Mn2+ Cu2+, Fe3+, Zn2+ Anion HCl](https://image.slidesharecdn.com/18252632-separation-chemistry-141124090028-conversion-gate01/85/separation-chemistry-173-320.jpg)
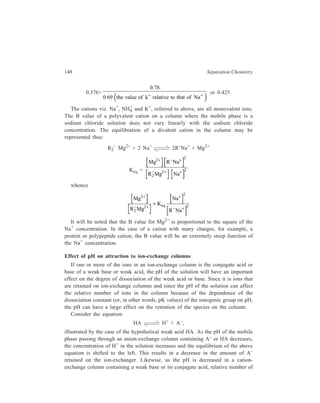
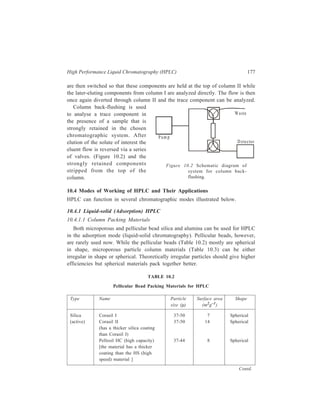
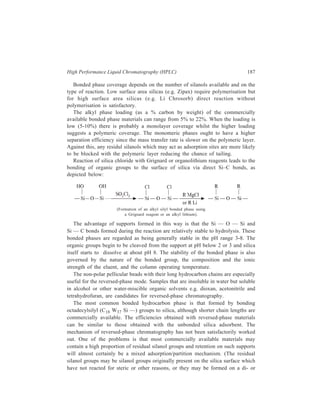
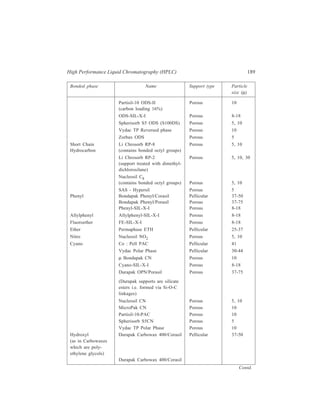
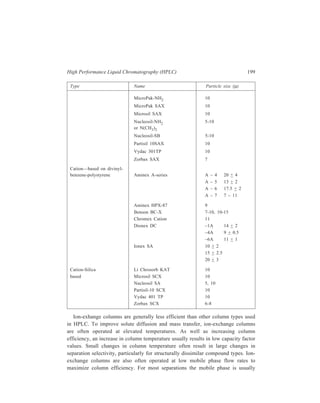
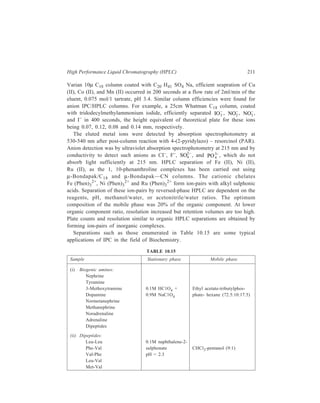
![High Performance Liquid Chromatography (HPLC) 177
are then switched so that these components are held at the top of column II while
the later-eluting components from column I are analyzed directly. The flow is then
once again diverted through column II and the trace component can be analyzed.
Column back-flushing is used
to analyse a trace component in
the presence of a sample that is
strongly retained in the chosen
chromatographic system. After
elution of the solute of interest the
eluent flow is reversed via a series
of valves. (Figure 10.2) and the
strongly retained components
stripped from the top of the
column.
Figure 10.2 Schematic diagram of
system for column back-flushing.
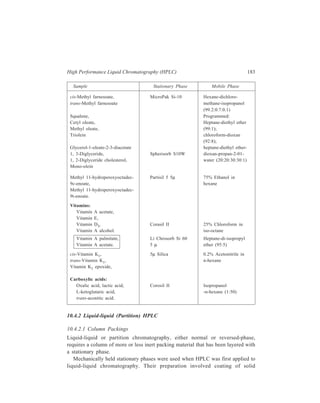
10.4 Modes of Working of HPLC and Their Applications
HPLC can function in several chromatographic modes illustrated below.
10.4.1 Liquid-solid (Adsorption) HPLC
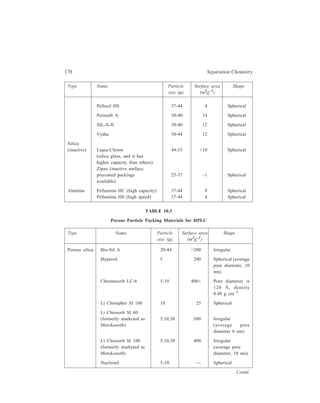
10.4.1.1 Column Packing Materials
Both microporous and pellicular bead silica and alumina can be used for HPLC
in the adsorption mode (liquid-solid chromatography). Pellicular beads, however,
are rarely used now. While the pellicular beads (Table 10.2) mostly are spherical
in shape, microporous particle column materials (Table 10.3) can be either
irregular in shape or spherical. Theoretically irregular particles should give higher
efficiencies but spherical materials pack together better.
TABLE 10.2
Pellicular Bead Packing Materials for HPLC
Type Name Particle Surface area Shape
size (μ) (m2g–1)
Silica Corasil I 37-50 7 Spherical
(active) Corasil II 37-50 14 Spherical
(has a thicker silica coating
than Corasil I)
Pellosil HC (high capacity) 37-44 8 Spherical
[the material has a thicker
coating than the HS (high
speed) material ]
Contd.
Pump
Waste
D etector](https://image.slidesharecdn.com/18252632-separation-chemistry-141124090028-conversion-gate01/85/separation-chemistry-187-320.jpg)
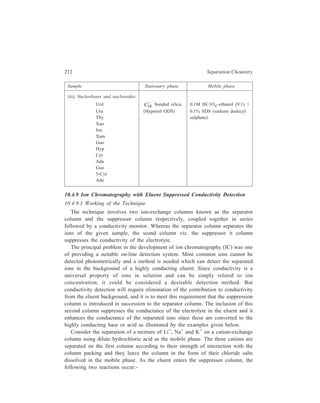
![192 Separation Chemistry
Sample Stationary Phase Mobile Phase
Gibberellin A8
Gibberellin A29 Bondapak C18/Porasil B Solvent A,
Gibberellin A23 1% aqueous
Gibberellin A1 acetic acid
Solvent B,
95% ethanol
Inorganic
Metaldiethyldithiocarbamates
Pb
Ni
Co Li Chrosorb RP-18 Acetonitrile-
Cu water (65:35)
Hg
Organic
Dinitrophenyl hydrazones of:
n-Pentanal
n-Butanal same retention times Zipax + 1% tri- Hexane saturated
Acetone for the column used (2-cyanoethoxy) with stationary
Acetaldehyde propane phase
Formaldehyde
o-Hydroxyphenylacetic acid
6-Hydroxycoumarin
7-Hydroxycoumarin
same retention
8-Hydroxycoumarin times for the
column used
5-Hydroxycoumarin Methanol–
o - Coumaric acid Partisil 10 ODS water–
Coumarin acetic acid
3 - Hydroxycoumarin (400:600:1)
Pre-column of Co : Pell ODS
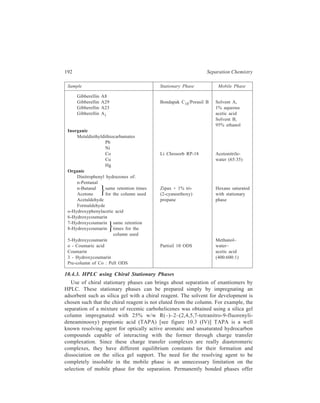
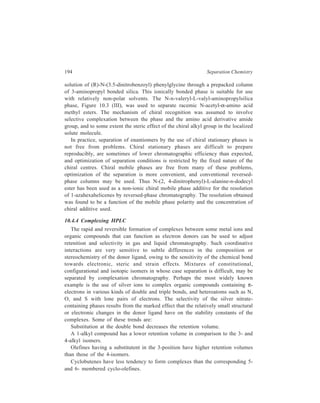
10.4.3. HPLC using Chiral Stationary Phases
Use of chiral stationary phases can brings about separation of enantiomers by
HPLC. These stationary phases can be prepared simply by impregnating an
adsorbent such as silica gel with a chiral reagent. The solvent for development is
chosen such that the chiral reagent is not eluted from the column. For example, the
separation of a mixture of recemic carbohelicenes was obtained using a silica gel
column impregnated with 25% w/w R(–)–2–(2,4,5,7-tetranitro-9-fluorenyli-deneaminooxy)
propionic acid (TAPA) [see figure 10.3 (IV)] TAPA is a well
known resolving agent for optically active aromatic and unsaturated hydrocarbon
compounds capable of interacting with the former through charge transfer
complexation. Since these charge transfer complexes are really diasteromeric
complexes, they have different equilibrium constants for their formation and
dissociation on the silica gel support. The need for the resolving agent to be
completely insoluble in the mobile phase is an unnecessary limitation on the
selection of mobile phase for the separation. Permanently bonded phases offer](https://image.slidesharecdn.com/18252632-separation-chemistry-141124090028-conversion-gate01/85/separation-chemistry-202-320.jpg)
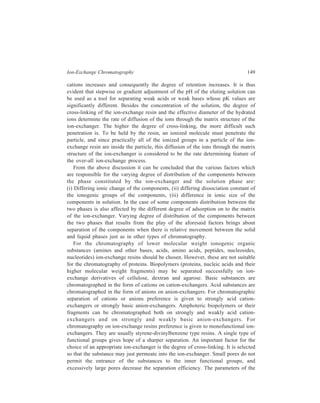
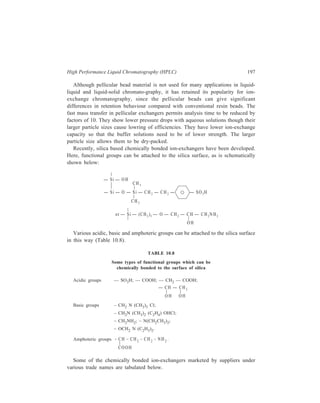
![196 Separation Chemistry
Investigations carried out with the columns using alkali and alkaline earth metal
ions showed the differences between ion-exchange resin columns and these crown
ether columns.
With cation exchange resins having sulphonic acid or carboxylic acid as
exchange sites, retention is typically dependent on mass/charge ratios:
Li+ Na+ K+ Rb+ Cs+; Mg2+ Ca2+ Sr2+ Ba2+; Na+ Ca2+ Al3+.
With crown ethers, retention is dependent upon the relative size of the cation
and the ring of crown ether. The ring in this investigation was (– C – O – C –)5
and the orders of elution were Li+ Na+ Cs+ Rb+ K+ and Mg+2 Ca2+
Sr2+ Ba2+. Flow rates were 1.0 ml/min and pressure drops were 40 to 140 kg/
cm2. The effect of solute-solvent interactions upon the separations also was
investigated by changing solvents (water/methanol ratios) and counterions.
Decreasing water content increases retention time, but differently for each cation.
For example, in one experiment when water content was decreased to 50% by
using methanol, the retention times for Li+, Na+, Cs+, Rb+, and K+ were 1.11,
1.63, 1.85, 4.09 and 6.64 times higher. When counterions are compared, in
retention KC1 KBr KI.
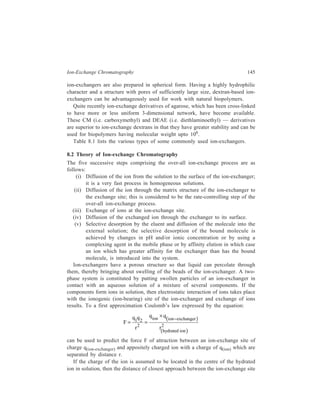
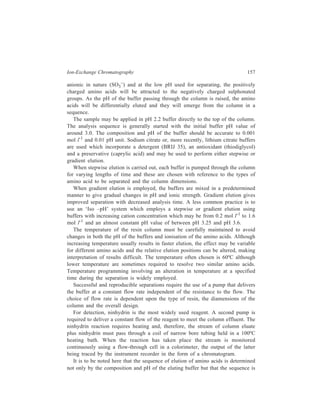
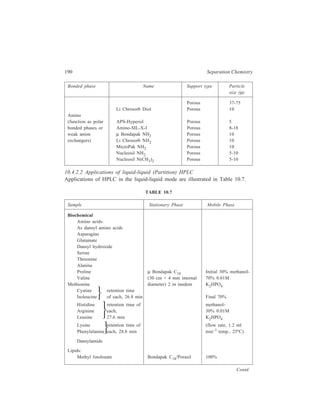
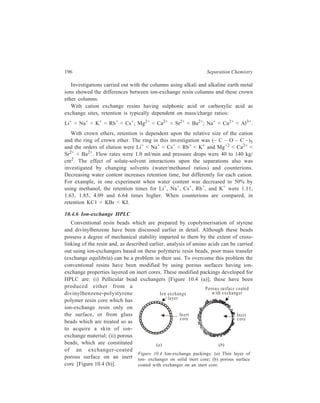
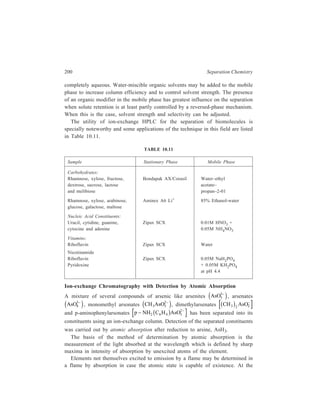
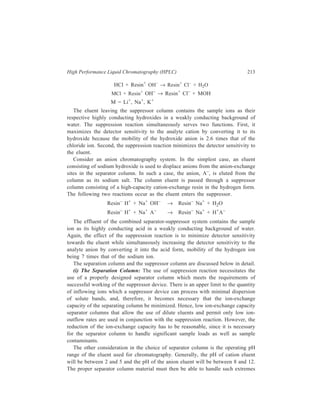
10.4.6 Ion-exchange HPLC
Conventional resin beads which are prepared by copolymerisation of styrene
and divinylbenzene have been discussed earlier in detail. Although these beads
possess a degree of mechanical stability imparted to them by the extent of cross-linking
of the resin and, as described earlier, analysis of amino acids can be carried
out using ion-exchangers based on these polymeric resin beads, poor mass transfer
(exchange equilibria) can be a problem in their use. To overcome this problem the
conventional resins have been modified by using porous surfaces having ion-exchange
properties layered on inert cores. These modified packings developed for
HPLC are: (i) Pellicular bead exchangers [Figure 10.4 (a)]; these have been
produced either from a
divinylbenzene-polystyrene
polymer resin core which has
ion-exchange resin only on
the surface, or from glass
beads which are treated so as
to acquire a skin of ion-exchange
material; (ii) porous
beads, which are constituted
of an exchanger-coated
porous surface on an inert
core [Figure 10.4 (b)].
Porous surface coated
with e xchanger
Ion exchange
layer
In ert
core
(a) (b)
In ert
core
Figure 10.4 Ion-exchange packings: (a) Thin layer of
ion- exchanger on solid inert core; (b) porous surface
coated with exchanger on an inert core.](https://image.slidesharecdn.com/18252632-separation-chemistry-141124090028-conversion-gate01/85/separation-chemistry-206-320.jpg)
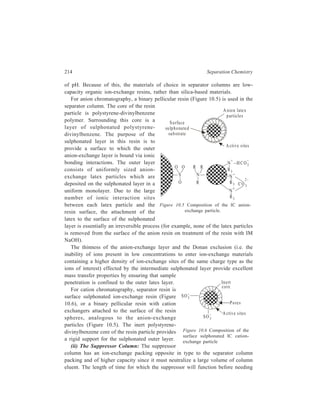
![210 Separation Chemistry
pair formation with the chiral counterion, (+)–10–camphosulphonate.
Diastereomeric ion-pairs have structural differences resulting in different
distribution coefficients between the mobile and stationary phases.
In the field of Inorganic Chemistry, separation of metal ions has been carried
out efficiently by paired-ion chromatography. Cassidy and Elchuk have combined
the principles of paired-ion chromatography and the performance of modern 5- and
10μ C18 phases bonded to silica. Table 10.14 gives the ion-pairing reagents
commonly used.
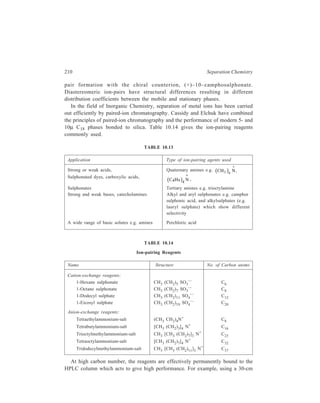
TABLE 10.13
Application Type of ion-pairing agents used
( )+
Strong or weak acids, Quaternary amines e.g. CH 3 N ,
4 Sulphonated dyes, carboxylic acids, ( ) 4 9 4 C H N +
,
Sulphonates Tertiary amines e.g. trioctylamine
Strong and weak bases, catecholamines Alkyl and aryl sulphonates e.g. camphor
sulphonic acid, and alkylsulphates (e.g.
lauryl sulphate) which show different
selectivity
A wide range of basic solutes e.g. amines Perchloric acid
TABLE 10.14
Ion-pairing Reagents
Name Structure No. of Carbon atoms
Cation-exchange reagents:
1-Hexane sulphonate CH3 (CH2)5 SO3
— C6
1-Octane sulphonate CH3 (CH2)7 SO3
— C8
1-Dodecyl sulphate CH3 (CH2)11 SO4
— C12
1-Eicosyl sulphate CH3 (CH2)19 SO4
— C20
Anion-exchange reagents:
Tetraethylammonium-salt (CH3 CH2)4N+ C8
Tetrabutylammonium-salt [CH3 (CH2)3]4 N+ C16
Trioctylmethylammonium-salt CH3 [CH3 (CH2)7]3 N+ C25
Tetraoctylammonium-salt [CH3 (CH2)7]4 N+ C32
Tridodecylmethylammonium-salt CH3 [CH3 (CH2)11]3 N+ C37
At high carbon number, the reagents are effectively permanently bound to the
HPLC column which acts to give high performance. For example, using a 30-cm](https://image.slidesharecdn.com/18252632-separation-chemistry-141124090028-conversion-gate01/85/separation-chemistry-220-320.jpg)
![High Performance Liquid Chromatography (HPLC) 229
undertaken to evaluate the persistence of pollutants such as pesticides and
carcinogens and their metabolites in the environment with a view to defining
acceptable daily intakes of pesticide residues and food additives. Two of the
problems involved in this complex analytical undertaking centre firstly on the
severe demands placed on the sensitivity and selectivity to be achieved by
detection systems monitoring trace components, and secondly on the large number
of samples which must be analyzed in pesticide screening projects.
Although the detectors currently available for HPLC do not usually match the
sensitivity of GLC detectors [e.g. electron capture detector (Chapter 13) and GLC/
mass spectrometer (MS) combination (Chapter 13)], the practical detection limits
of the two methods are about equal since large sample volumes can be injected
into HPLC columns. Thus monitoring of solutes in picogram amounts, as is
achieved by GLC, has now been attained by HPLC also in several cases. Further,
selective HPLC detectors such as spectrofluorimeters and electrochemical detectors
can significantly increase sensitivity or reduce sample clean-up for suitable
analytes. The advantage of wave length variation in the UV monitoring of
pesticides has also been made use of. Further advances in the HPLC/MS link-up
can also be expected to improve detection limits and specificity in environmental
analysis. The use of non-destructive detectors in HPLC also allows samples to be
collected for structure elucidation or confirmation or, on the preparative scale, for
biological testing or further chemical modification.
The solution to the problem of analyzing large numbers of samples in
environmental screeing projects has been found in the development of automated
pesticide analyzers. Also, the range of automatic injection devices for HPLC now
available reduces operator involvement in analyzing large numbers of samples.
As in other areas of analysis, HPLC is a useful complementary technique to
GLC in analyzing pollutants in the environment. An advantage of HPLC in
environmental analysis is that molecules of varying polarity (e.g. pesticide +
metabolite mixtures) can be analyzed in one chromatographic run. Since aqueous
mobile phases can be used in reversed-phase HPLC (including ion-pair partition
modes) sample preparation is often less extensive than in GLC. The number of
clean-up steps can also be reduced by the use of a precolumn to protect the
analytical column or by a preliminary size separation of a crude extract on an
exclusion column.
Pesticides
Pesticides can be classified as insecticides, herbicides, fungicides and
rodenticides. Application of HPLC for monitoring pesticides is illustrated below
by taking examples of each of these types.
Insecticides
Pyrethrins and insect juvenile harmones provide examples of naturally occurring
compounds which are of interest as alternatives to chemical insecticides. The class](https://image.slidesharecdn.com/18252632-separation-chemistry-141124090028-conversion-gate01/85/separation-chemistry-239-320.jpg)
![230 Separation Chemistry
of chemical insecticides consists of chlorinated insecticides, organophosphorus
insecticides, esters of carbamic acid, and this class of insecticides also includes
larvicides e.g. Thompson-Hayward 6040 which is a substituted area.
Pyrethrins: These have low mammalian toxicity. Separation of constituents of
pyrethrum extracts has been achieved by chromatography on permaphose ODS.
Insect juvenile harmones: These act against insects by retarding their
maturation. Steroidal insect moulting hormones such as β-ecdysone have been
analyzed by HPLC. A study of the persistence of the synthetic juvenile hormone
JH-25 [7-ethoxy - 1 (p-ethylphenoxy)-3, 7-dimethyl-2-octene] in flour samples has
been carried out by HPLC.
Chlorinated insecticides: The analysis of chlorinated pesticides in residue
samples in complicated by the fact that they usually occur along with
polychlorinated biphenyls (PCBs). The latter compounds occur widely in the
environment due to their use as plasticizers, dye stuff additives and hydraulic oils,
and both chlorinated pesticides and polychlorinated biphenyls are persistent in the
environment. Since both compound classes include non-polar aromatic molecules,
adsorption chromatography has been the mode of choice for the HPLC separation
of these compounds.
Using a 250 × 3 mm i.d. column of 5 μ LiChrosorb SI 60 silica and dry hexane
as the mobile phase, hexachlorobenzene, aldrin, p, p'–DDE, o-p'–DDE, o, p'-DDT,
p, p'–DDT and p, p’–DDD were separated from each other and from
decachlorobiphenyl and biphenyl in 8 min, at a column temperature of 27ºC and
a flow rate of 4 ml min–1. A 10- to 80- fold increase in sensitivity was btained for
all pesticides except the DDE isomers (metabolites of DDT) by using the UV
detector at 205 nm rather than 254 nm. Using the LiChrosorb SI 60 silica/dry
hexane system chlorinated PCBs such as Aroclor 1254, 1260 and 1268 (where 12
represents biphenyl and the remaining two digits represent the per cent by weight
of chlorine in the mixture) elute before the less highly chlorinated PCBs (Aroclors
1232, and 1248) and are quantitatively separated from longer-retained pesticides
such as the DDT isomers, o, p'–DDE and p, p'–DDD. Pesticides with even longer
retention times (lindane ≡ γ-benzene hexachloride ≡ γ – BHC, endosulfan, endrin,
dieldrin and methoxychlor) were well separated from all of the Aroclors.
Organophosphorus insecticides: Separation of insecticides like phosphamidon,
monocrotophos, CGA 18809 (an experimental insecticide) and dicrotophos has
been achieved by chromatography on Permaphase ETH columns.
In a study of the analysis of organophosphorus pesticides, fenchlorphos,
cruformate and fenthion were hydrolyzed to the corresponding phenols which were
reacted with dansyl chloride to form fluorescent derivatives. Separation of the
three derivaties was achieved by adsorption chromatography on silica. Separation
of the cis and trans isomers of three organophosphorus pesticides, dimethyl-](https://image.slidesharecdn.com/18252632-separation-chemistry-141124090028-conversion-gate01/85/separation-chemistry-240-320.jpg)
![High Performance Liquid Chromatography (HPLC) 231
vinphos, temivinphos and chlorphenvinphos, has been carried out by adsorption
chromatography on silica.
Esters of Carbamic acid: The carbamates, esters of carbamic acid (NH2-
COOH), constitute an important family of insecticides of which cabaryl is the
O
O C
NHMe
member most commonly used. The 2-isomer of carbaryl (2-naphthyl-N-methylcarbamate)
shows carcinogenic effects not exhibited by carbaryl itself, and
hence this isomer must be absent from carbaryl formulations. A method for
the analysis of the 2-isomer in the presence of carbaryl involved hydrolysis of the
carbamates to 1- and 2- naphthol and analysis of the naphthols in the presence of
unhydrolyzed carbamate on a Corasil II column with a hexane/chloroform (80:20)
eluent.
Recently separation of around 30 carbamate pesticides by adsorption and
reversed-phase chromatography were reported. For many of the Carbamates
studied, improved detection limits (1-10 ng) were achieved by monitoring at
190-220 nm.
Substituted urea larvicide: The substituted urea, [N-(4-chlorophenyl)-N'-(2,
6-difluorobenzoyl-urea], is a larvicide patented as Thompson–Hayward 6040. It
has been analyzed in cow’s milk following extraction and chromatography on
Permaphase ODS with a methanol/water (50 : 50) eluent.
As mentioned earlier, pesticides comprise of compounds classified as herbicides,
fungicides and rodenticides besides those classified as insecticides. Herbicides or
fungicides or rodenticides are far less numerous than insecticides, and examples of
the use of HPLC in the monitoring of pesticides belonging to the three former
classes are all considered together in Table 10.19.
TABLE 10.19
Sample Mode of Stationary Mobile
HPLC used Phase Phase
Herbicides
Substituted urea herbicides: Adsorption LiChrosorb SI 60 Water saturated with
Diuron, neburon, dichloromethane
phenobenzuron and (the role of water
isoproturon being to block the
most active silanol
sites thereby
Contd.
](https://image.slidesharecdn.com/18252632-separation-chemistry-141124090028-conversion-gate01/85/separation-chemistry-241-320.jpg)
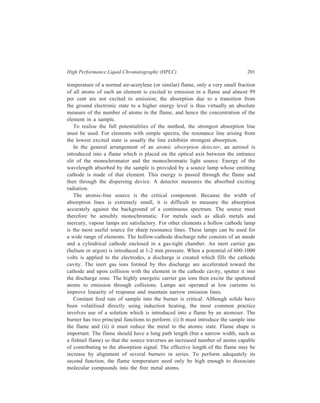
![234 Separation Chemistry
Sample Mode of Stationary Mobile
HPLC used Phase Phase
1, 2-Dimethylhydrazine:
Separation of 1, 2-dimethyl-hydrazine,
a potent colon
carcinogen in rats, from Partition μ Bondapak C18 1% aqueous ethanol
azomethane, azoxy-methane eluent gave good
and methylazoxymethanol, resolution of all the
formaldehyde and methanol compounds except
(probable metabolites of 1, 1, 2-dimethylhydra-
2- dimethylhydrazine) zine itself, which
was excessively
retained and badly
tailed, and this
compound could be
eluted in the proto-nated
form by
changing the eluent
to 0.05M acetic acid.
1, 2-Dimethylhydrazine, Ion-exchange Aminex A-27 (a With eluent having
azomethane, azoxy- strong anion- pH 5.6, 1, 2-di-methane
and methylazoxy- exchange polystrene methylhydrazine
methanol, formaldehyde based resin) could be eluted
and methanol rapidly through the
column, with rea-sonable
resolution of
the other metabolites
(except methanol
and formaldehyde).
(Azo and azoxy
com-pounds were
detected at 205 nm
and radioactive, 1,
2-di-methylhydra-zine
and formal-dehyde
were
detected by liquid
scintillometry of
collected fractions.)
Polynuclear hydrocarbons:
Separation of benzo [a]
Contd.](https://image.slidesharecdn.com/18252632-separation-chemistry-141124090028-conversion-gate01/85/separation-chemistry-244-320.jpg)
![High Performance Liquid Chromatography (HPLC) 235
Sample Mode of Stationary Mobile
HPLC used Phase Phase
pyrene (a powerful
hydrocarbon carcinogen
which is emitted into the Partition Permaphase ODS Methanol/water
atmosphere as a conse- gradient
quence of the combustion
of fossil fuels, the com-pound
being metabolized
to oxygenated derivatives
from 8 metabolites viz.
three dihydrodiols (9, 10;
7, 8; and 4, 5), three
quinones (benzo [a]
pyrene-1, 6, -3, 6-; and
-6, 12-dione) and two
phenols (3- and 9-
hydroxybenzo [a] pyrene)
Phenathrene, anthracene, Methanol/water
fluoranthene, pyrene, (65 : 35) gradient of
triphenylene, benzo [ghi] 1 per cent methanol
fluoranthene, chrysene, min–1 initiated after
benzo [a] anthracene, benzo Partition Zorbax ODS 70 min; pressure,
[j] fluoranthene, benzo 1200 psi; flow rate,
[b] fluoranthene, benzo [e] 0.21ml min–1;
pyrene, perylene, benzo column temperature,
[k] flouranthene, benzo 60ºC
[a] pyrene, benzo [ghi]
perylene, indeno [123 cd]
pyrene, anthanthrene,
coronene, in an air sample.
Analysis of Industrial Pollutants in Environment
Analysis of phenols in complex mixtures and in industrial wastes using UV
detection and monitoring of trace phenols in aqueous environmental samples with
the use of fluorimetric detectors have been achieved by HPLC. Chlorophenols,
which can be formed during the disinfection of industrial waste by chlorination,
can be analyzed as quinones after oxidation by ruthenium tetroxide.
HPLC has been applied to the analysis of nitro compounds e.g. nitroglycerine
in waste waters, and trinitrotoluene in munition waster waters.
HPLC has also been applied to the analysis of trimethylolpropane and
pentaerythritols in industrial synthesis solutions, 2-mercaptobenzothiazole in waste
dump effluent, polythionates in mining waste water, isocyanates in working
atmospheres, carcinogenic amines, aniline in waste water, polyethylene oxide fatty
acid surfactants in industrial process waters and phthalate esters in river water.](https://image.slidesharecdn.com/18252632-separation-chemistry-141124090028-conversion-gate01/85/separation-chemistry-245-320.jpg)
![236 Separation Chemistry
Application of HPLC in Chemical Industry
Some examples of the application of HPLC in the chemical industry have been
given earlier in this chapter during the course of discussion of working of the
individual modes of HPLC. Table 10.21 lists some more examples of the
application of HPLC in the chemical industry.
TABLE 10.21
Sample Mode of Stationary Mobile
HPLC used Phase Phase
Benzene, naphthalene Partition Merck SI 60 + n-Hexane
and phenanthrene added water
Anthracene, pyrene, Partition Durapak OPN Isooctane
chrysene, perylene,
and anthanthrene
Benzene, biphenyl, Adsorption Perisorb A n-Heptane
m-terphenyl,
m-quaterphenyl,
m-quinquephenyl
Phenanthrene, Partition Li Chrosorb RP – 8 Water-methanol
pyrene, chrysene, (20 : 80)
and benzo [a] pyrene
Polymers:
Polystyrene—
mol.wt. 1,800,000 Exclusion Three in series: Dichloromethane
mol. wt. 92,000 CPG 75, CPG 240,
mol. wt. 4,00 CPG 700
(porous glass)
Surfactants:
Non-ionics Ion-exchange MicroPak-NH2 Non-linear gradient
surfactant Igepal 430 0 to 100%
n = 2 isopropanol in
n = 3 hexane
n = 4
Explosives and propellants:
TNT, tetryl and RDX Adsorption Corasil II 30% dioxan + 70%
cyclohexane
Trinitroglycerine,
1, 3-dinitroglycerine, Adsorption Vydac Dichloromethane –
1, 2-dinitroglycerine hexane (60 : 40)
Contd.](https://image.slidesharecdn.com/18252632-separation-chemistry-141124090028-conversion-gate01/85/separation-chemistry-246-320.jpg)
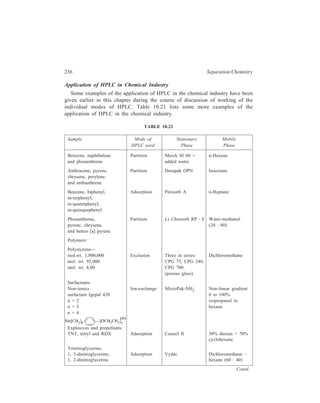
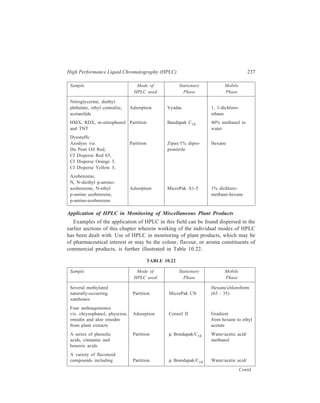
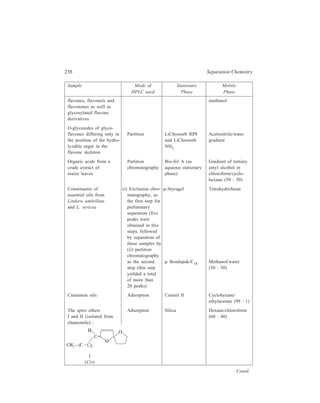
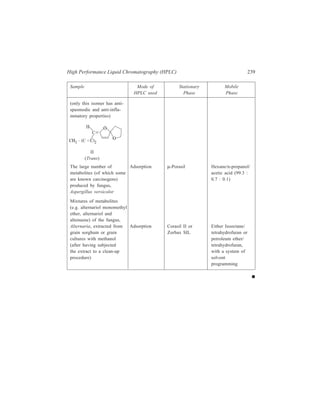
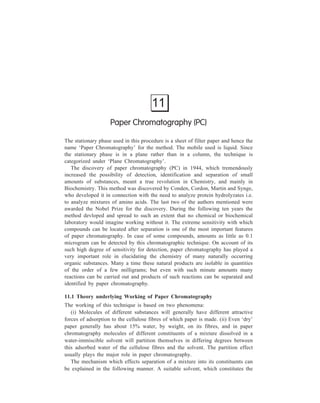
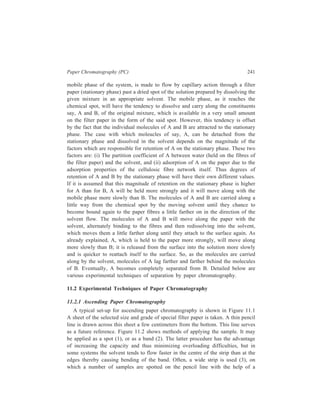
![Paper Chromatography (PC) 243
Chemistry of the Ninhydrin Colour Test
O
C
C
O
C
N inhydrin
OH
OH
O
C
C
O
C = O
NH – C RHCO H 2 2
–H2O
O
C
C
O
C = N – CH R C O2H
–CO2
O
C
C
O
H
C – N = CHR
H2O
O
R – C – H +
O
C
C
O
C
H
N = C
O
C
C
O
C
C
O
C
H
NH2
–H O 2
O
C
+ C = O
C
O
O
–H
O
C
C
O
C – N = C
O
C
C
O
+
[Coloured product formed is the same (blue-violet)
with most of the amino acids, H2N–CHRCO2H]
Dithiooxamide provides an example of a detecting agent used in paper
chromatography in Inorganic Chemistry. Its use can be illustrated by taking the
example of separation of chlorides of copper, cobalt and nichek. The developer
employed for the purpose is a solution made up of HCl-water-ketone mixture
which is prepared just before it is to be used. Spot locations are revealed by
spraying with 0.1% dithiooxamide in 60% ethanol. Colours produced are green,
yellow and blue with copper, cobalt and nickel respectively.
Table 11.1 lists important examples of chromogenic reagents used as detecting
agents in paper chromatography.](https://image.slidesharecdn.com/18252632-separation-chemistry-141124090028-conversion-gate01/85/separation-chemistry-253-320.jpg)
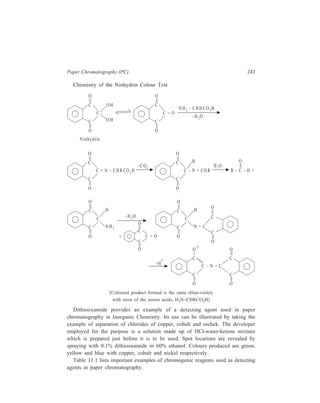
![Paper Chromatography (PC) 245
with solvent X
[Figure 11.3 (a)].
X is then dried off,
the paper turned
through 90º, and
developed with
another solvent Y.
By suitable choice
of X and Y, a
complete two di-mensional
sepa-ration
may be
A BC DE F
Solv ent fron t X
A
B
C
Figure 11.3 Two-dimensional paper chromatography
obtained, as in Figure 11.3 (b). An outstanding example of the application of this
technique is provided by the sucess that Dent achieved in separating all the
individual constituents of a mixture containing no less than sixty two amino acids.
11.2.3 Descending Paper Chromatography
A disadvantage of the ascending technique described earlier is that the solvent
can ascend only until it reaches the top edge of the paper at which stage the flow
of the solvent ceases, and compounds with low Rf values are often incompletely
separated. With the descending technique the developing solvent can be allowed
to run off the end of the paper under the influence of gravity so that one is able
Trough for
so lvent Anti-siphon
rod
Wire s fixed
to sides o f
tank on w hic h
trough can rest
G lass
tank
(a) Layout of the tank
Glass anchor rod
Anti-siphon
rod
(b) Insertion of Paper
G lass
anchor
rod
Figure 11.4 Descending paper chromatography
D
E
F
Solv ent front Y
(a ) (b )
Paper
suspended
in trough
Serrated
edge to a llow
solv ent to
flow u n iformly
off the paper](https://image.slidesharecdn.com/18252632-separation-chemistry-141124090028-conversion-gate01/85/separation-chemistry-255-320.jpg)
![246 Separation Chemistry
to increase considerably the effective length of the run and thus improve the
separation.
In the descending technique solvent is placed in a glass trough which is set in
the chromatographic tank as shown in Figure 11.4 (a). Some of the solvent is
poured into the bottom of the tank so as to saturate the atmosphere with its vapour.
The paper, prepared as described under ‘Ascending Paper Chromatography’ is
then suspended in the solvent and the lid placed securely on the tank. The paper
is anchored in the trough by means of a glass rod and passes over a second rod
slightly higher than the edge of the trough to prevent siphoning of the solvent, the
arrangement being shown in Figure 11.4 (b).
11.2.4 Chromatography on Circular Papers
This method has proved particularly useful in separating mixtures of dyestuffs.
A circular paper is held between two discs of glass or plastic, the upper one of
Solvent
Paper
Figure 11.5 : Circular paper chromatography
(a)
(b)
II III
I
which has a hole in its centre [Figure 11.5 (a)]. The mixture (in solution) is placed
in the centre hole followed dropwise by solvent, which spreads radially by
capillary attraction carrying the components, I, II, III, into concentric rings as in
Figure 11.5 (b). With coloured substances a circular trough may be cut in the lower
disc and elution continued until each ring is washed to the edge, collected, and
drained off for subsequent recovery. The circular method has the following
advantages over the others:
(1) The apparatus is even simpler, no air-tight container being need. (2) The
run-out is very rapid. (3) Separations are usually sharper. (4) Much larger
quantities (upto 100 mg) of mixture can be handled.
11.3 Factors affecting Resolution on Paper Chromatography
In a paper chromatogram, the mechanism of distribution of solute which takes
place between the mobile phase (developing solvent) and the stationary phase may
be distribution between the solvent and an immiscible liquid phase which moistens](https://image.slidesharecdn.com/18252632-separation-chemistry-141124090028-conversion-gate01/85/separation-chemistry-256-320.jpg)
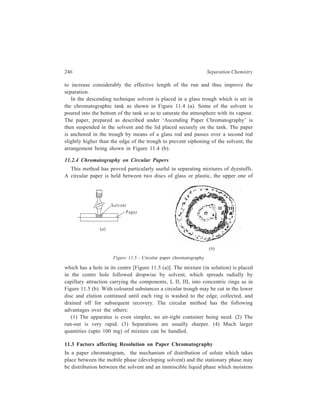
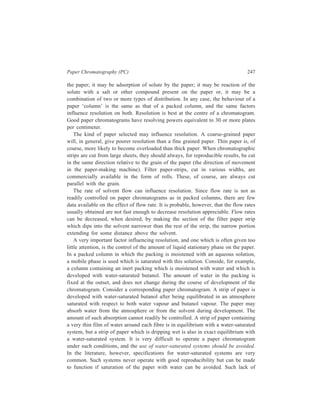
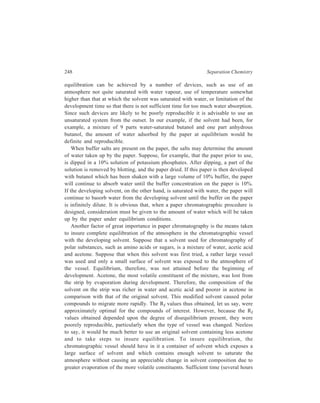
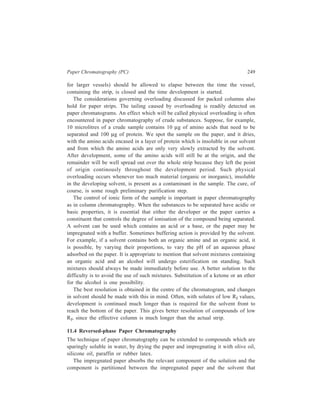
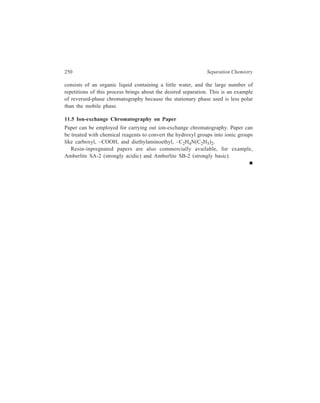
![252 Separation Chemistry
(a)
(c)
Spreader
P late
Adsorbent
A
B
(A +B) B A
Sta rting
lin e
L id
Paper a roun d
sides o f tank
Plate in th e
course o f d evelopmen t
Solvent
(b)
Figure 12.1 Thin-layer Chromatography (a) Device for spreading a layer of adsorbent; (b)
Chamber for chromatographing with a solvent (aluent) at the bottom; (c) A developed plate
showing mixture (A+B) having separated into its constituents B and A; spots marked (A+B), B
and A on the starting line refer to those of the mixture and known compounds B and A
respectively.
are excellent supports; commercial plates are prepared on metal and polymer foils
and can be cut to size). The solid e.g. alumina, chosen as the stationary phase is
mixed with liquid (usually, water) to obtain a slurry, which is spread uniformly on
the plate. An excess of slurry (over the desired thickness) is removed with the aid
of a roller [Figure 12.1 (a)], and the layer is dried in an oven at 100-150ºC. If there
is poor adherence of the layer to the plate, a binding agent such as calcium
sulphate may be added. For analytical purposes, a 0.25 mm layer is spread, and for
preparative purposes, a layer from 0.75 to 2 mm. The plate thus prepared is
referred to as a chromatoplate.
12.1.2 Running a Thin-layer Chromatogram
Test solutions are applied to the chromatoplate as described under paper
chromatography, except that the greater delicacy of the adsorbent layer on the](https://image.slidesharecdn.com/18252632-separation-chemistry-141124090028-conversion-gate01/85/separation-chemistry-262-320.jpg)
![Thin-layer Chromatography (TLC) 253
plate makes it necessary to take much more care. The test solution is applied from
a micro-pipette on the adsorbent layer at a point on a line (the starting line) parallel
to one end of the plate at a distance of 1 cm from that end. A known substance
is applied as a spot at the same starting line at a distance of about 2 cm from the
first point, and the other control substances are each placed 2 cm farther along the
starting line. Development of the chromatoplate is usually carried out by the
ascending method [Figure 12.1 (b)]. The end of the plate near the starting line is
dipped in an inclined position into the chosen solvent (typica1 mobile phases used
for TLC on silica gel, for example, are listed in Table 12.2) which is at the bottom
of a glass chamber.
TABLE 12.2
Typical Mobile Phases used in Thin-layer Chromatography on Silica Gel
Mobile Phase Applications
Chloroform/acetone Steroids e.g. bile acids, estrogens, sterols
Chloroform/ethanol Alkaloids e.g. belladona, morphine, opium, purine
Water Vitamins A, D and E
Hexane/acetone Vitamins B and C
Light petroleum/ether Hydrocarbon oils, ester oils
Hexane Chlorinated insecticides e.g.
Aldrin, DDT, Heptachlor, Endrin
The air in the chamber is saturated with the solvent vapour. For keeping an
approximately constant temperature, the walls of the chamber and its bottom are
covered with strips of filter paper and the chamber is covered with close-fitting lid.
Usually, the solvent front is allowed to ascend about 10 cm above the origin before
the plate is removed. The solvent front is carefully marked with a sharp pencil. The
solvent in the layer evaporates within a few minutes. Heat can be applied if
necessary, and then the plate is ready for location of the compounds.
Though the usual and easier way to running a thin-layer chromatogram is the
ascending method, various other techniques to suit individual needs or problems
have been tried. As in paper chromatography, it is possible to carry out descending
and circular chromatography. The flow of solvent from the reservoir to the layer
is through a filter paper strip. In circular TLC it is possible to put the glass plate
in such a way that the sorbent layer is either facing upwards or downwards.
In horizontal TLC also the sorbent layer could be facing upwards or downwards.
The solvent is brought to the sorbent layer through filter strip of the same width
as the glass plate.
Continuous TLC is useful for substances having small and close Rf values. It
could be carried out in sandwich or specially constructed chambers. Continuous](https://image.slidesharecdn.com/18252632-separation-chemistry-141124090028-conversion-gate01/85/separation-chemistry-263-320.jpg)
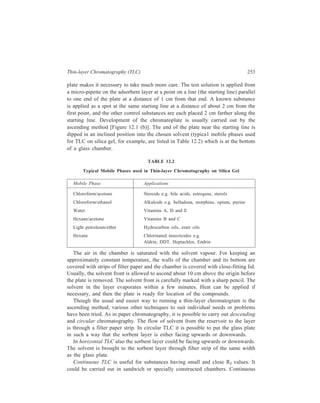
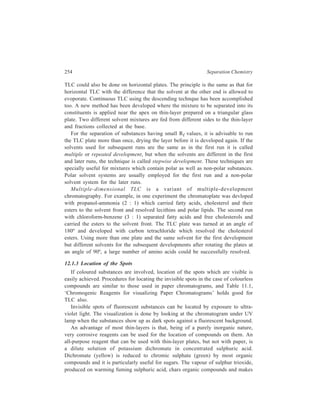
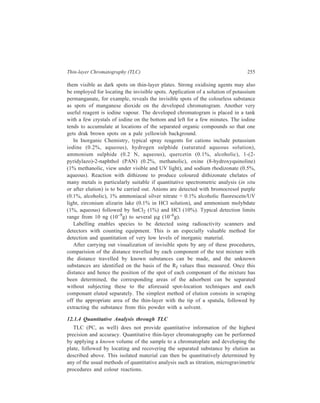
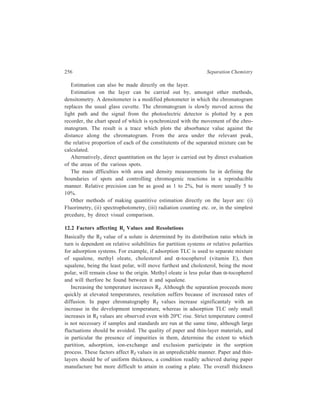
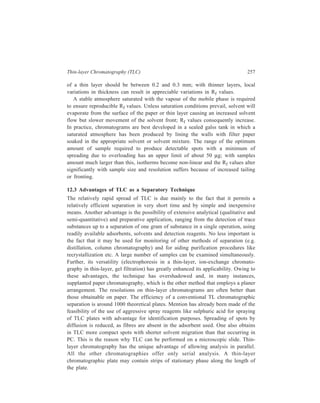
![Thin-layer Chromatography (TLC) 259
Flash Chromatography
This technique has been
described by W.C. Still et al. and
allows for the rapid separation (10
to 15 minutes) of mixtures of
components having a difference
(ΔRf) in Rf values greater or equal
to 0.15 and with a sample loading
of 0.01-10.0 g, although the latter is
not regarded as being a limiting
value. The essential features are
the use of silica gel 60, 40-63 μ
(40-230 mesh), in a column through
which the solvent is passed by the
application of positive air pressure
applied to the column head;
resolution is sensitive to eluent flow
rate, and this is 50.8 + 2.5 mm/
minute. The solvent systems used
are ethyl acetate/light petroleum,
acetone/light petroleum or acetone/
dichloromethane.
The apparatus consists of a
chromatography column and a flow
controller. The flow controller
[Figure 12.2 (a)] is a simple
variable bleed device for precise
regulation of the elution rate and is
constructed from a glass/Teflon
needle valve. Eluate fractions are
collected in test tubes (20 × 150
mm), and separated components
detected by TLC.
The general procedure is as
follows.
C B
A ir
(a )
Flow c ontroller
A
(b ) Chromatography column
18
Figure 12.2 Flash chromatography
First a low viscosity solvent system (e.g. ethylacetate/light petroleum b.p. 30-
60ºC) is found which separates the mixture and moves the desired components on
analytical TLC to an Rf of 0.35. If several compounds are to be separated which
run very close on TLC, the solvent is adjusted to put the midpoint between the
components at Rf 0.35. If the compounds are widely separated, the Rf of the less
mobile component is adjusted to 0.35.](https://image.slidesharecdn.com/18252632-separation-chemistry-141124090028-conversion-gate01/85/separation-chemistry-269-320.jpg)
![260 Separation Chemistry
Having chosen the solvent, a column of appropriate diameter [Figure 12.2 (b)]
is selected and a small plug of glass wool is placed in the tube (A) connecting the
stopcock to the column body.
Next a smooth 3-mm layer of 50-100 mesh sand is added to cover the bottom
of the column and dry 40-63 μ silica gel is poured into the column in a single
portion to give a depth of c 140 mm. With the stopcock open, the column is gently
tapped vertically on the bench top to pack the gel. Next a 3-mm layer of sand is
carefully placed on the flat top of the dry silica-gel bed and the column is clamped
for pressure packing and elution. The solvent chosen as above is then poured
carefully over the sand to fill the column completely. The needle valve (B) of the
flow controller is opened all the way and the flow controller is fitted tightly to the
top of the column and secured with strong rubber bands. The main air-line valve
leading to the flow controller is opened slightly and a finger is placed fairly tightly
over the bleedport (C). This will cause the pressure above the adsorbent bed to
climb rapidly and compress the silica gel as solvent is rapidly forced through the
column. It is important to maintain the pressure until all the air is expelled and the
lower part of the column is cool; otherwise the column will fragment and should
be repacked unless the separation is a trivial one. Particular care is necessary with
large diameter columns. The pressure is then released and excess eluent is forced
out of the column above the adsorbent bed by partially blocking the bleedport (C).
The top of the silica-gel column should not be allowed to run dry. Next the sample
is applied by pipette as 20-25 per cent solution in the eluent to the top of the
adsorbent bed and the flow controller is briefly placed on top of the column to
push all of the sample into the silica gel. The solvent used to pack the column is
ordinarily reused to elute the column. The walls of the column are washed down
with a few millilitres of fresh eluent, the washings are pushed into the gel as before
and the column is carefully filled with eluent so as not to disturb the adsorbent
bed. The flow controller is finally secured to the colunm and adjusted to cause the
surface of the solvent in the column to fall 51 mm/minute. This seems to be the
optimum value of the flow rate for most low-viscosity solvents for any diameter
TABLE 12.3
Column Vol. of Sample typical loading (mg) Typical
diam. (mm) eluent (ml) fraction
ΔRf 0.2 ΔRf 0.1 size (ml)
10 100 100 40 5
20 200 400 160 10
30 400 900 360 20
40 600 1600 600 30
50 1000 2500 1000 50](https://image.slidesharecdn.com/18252632-separation-chemistry-141124090028-conversion-gate01/85/separation-chemistry-270-320.jpg)
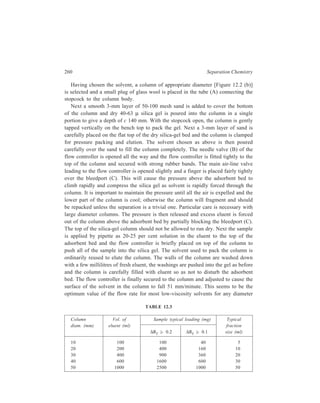
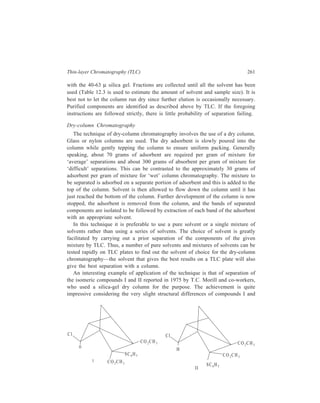
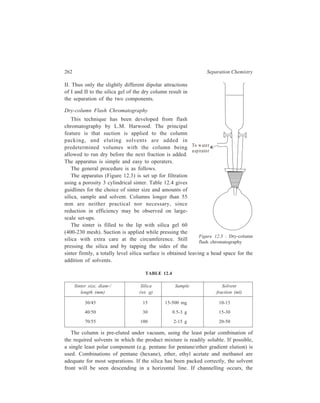
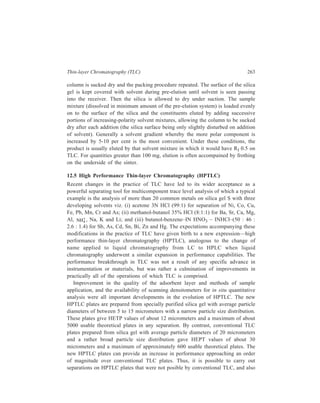
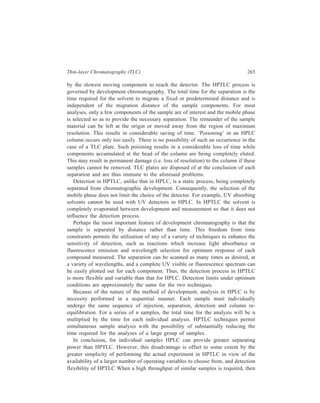
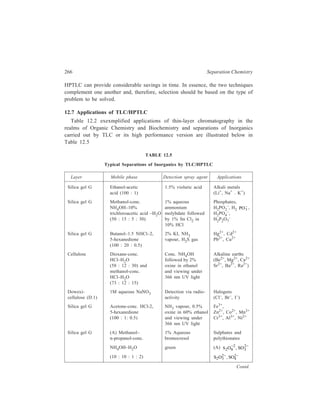
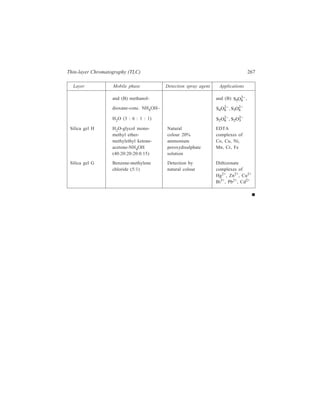
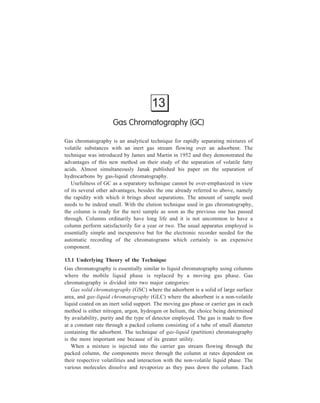
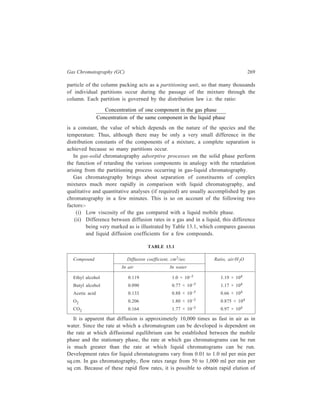
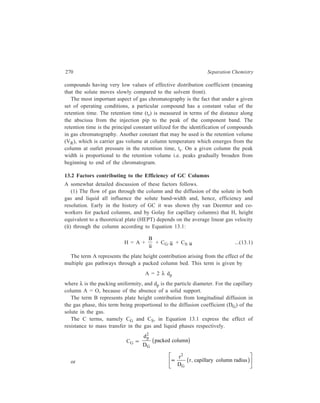
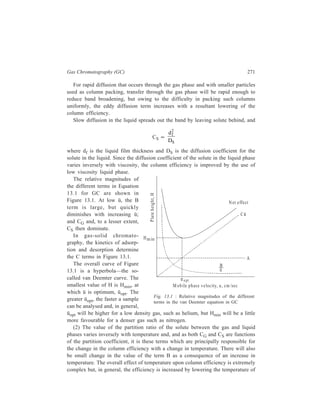
![Gas Chromatography (GC) 273
solubility limit in the stationary phase moves at the same velocity as the carrier
gas. This produces a band [Figure 13.2(a)] with a sharp profile and a diffuse tail.
The converse effect is observed if the column temperature is below the boiling
point of the sample. The excess of sample remains in a condensed state and its
velocity through the column depends entirely upon its solubility in the stationary
phase. The bulk of the sample therefore travels more slowly than the carrier gas
and the eluted band has a diffuse profile and a sharp tail [Figure 13.2(b)]. In both
situations the observed position of the band maximum differs from the true value
as measured for an infinitely small sample. As is to be expected, the column
temperature has a considerable effect upon the band shapes. There is a decrease
in the asymmetry of the band as a result of the higher solubility of the solute in
the stationary phase at the higher temperature.
(5) For a given number of plates the retention volume and the peak width are
proportional to the effective volume of each plate i.e. for two columns of identical
plate number, the column with the smaller HEPT, H, that is, the shorter column
will have the smaller peak width. The amount present at the peak maximum will
be unchanged but the volume of gas required to elute the peak will be less, the
concentration in that gas will be higher, and the recorded peak height will be
greater. In assessing the efficiency of a column the HEPT is important in addition
to the plate number. Since H decreases with decrease in df (liquid film thickness),
as is shown by Equation 13.1 and df in its own turn is dependent upon the ratio
of the liquid phase to solid support, a small proportion of stationary phase (so that
the film thickness is reduced) improves the column efficiency.
(6) For a given retention volume, the peak width is proportional to
1
n
so that
of two columns, the one with the higher plate number gives the sharper peak and
a better separation between substances with retention volumes close together. It is
therefore advantageous to increase the length of the column for a difficult
separation.
(7) The variation in velocity should be small i.e. the ratio
p
p
i
o
(pi = inlet
pressure, po = outlet pressure) must be as small as possible. An increase in the
column length leads to an increase in the ratio, for example, if the outlet is at
atmospheric pressure, a larger column requires a higher inlet pressure. For a given
flow-rate, however, the pressure drop, pi–po, is not very dependent upon the actual
pressure, and it may therefore be advantageous to reduce the ratio
p
p
i
o
by
increasing the outlet pressure po.
(8) A compromise has to be made between the improved column performance
which is theoretically possible using smaller diameter particles, and the loss of](https://image.slidesharecdn.com/18252632-separation-chemistry-141124090028-conversion-gate01/85/separation-chemistry-283-320.jpg)
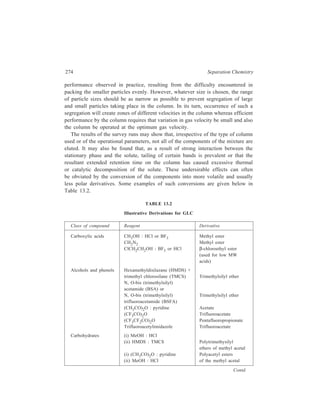
![276 Separation Chemistry
important. [Regarding designing of apparatus for gas chromatography, it
may be commented that band-broadening other than that in the column is
negligible in GC, unlike it is in LC wherein the apparatus has to be
designed so as to keep volumes in the extra-column regions (namely, the
injection system, the connecting tube and the detector) of the liquid
chromatograph to the minimum].
13.3 Working of the Technique
13.3.1 Columns for GC
The column consisting of tube loaded with the appropriate packing is
surrounded by a suitable jacket for maintaining constant temperature environment.
Packed columns are usually constructed from glass, copper, stainless steel, or
aluminium tubing and those used for routine analysis usually have an internal
diameter of between 1/12 in and 3/8 in (2 to 9 mm). Glass as column tubing has
the advantages of being chemically inert, and of allowing inspection of the state
of packing both during the preparation of the column and subsequently after
use—it has been extensively used in laboratory-built equipment. Copper tubing
may sometimes react with components of samples being analyzed or exert catalytic
effect on decomposition, and in such circumstances stainless steel tubing is usually
to be preferred—it is the material most frequently used for columns in commercial
equipment.
13.3.1.1 Column Packings
(a) Packings for GSC: If the column is to achieve separation by adsorption on
a solid (gas-solid chromatography) rather then by solution in the oil (gas-liquid
chromatography), suitable packing materials are alumina, silica gel and activated
charcoal. In gas-liquid chromatography, although the support material is commonly
thought of as being inert and non-active in the separation process, interaction
between the solute and support material does occur, and this interaction becomes
increasingly evident as the solutes become more polar, as the weight of liquid
phase is decreased and as the sample size is decreased. Seen in this context the
distinction drawn between gas-liquid chromatography and gas-solid
chromatography gets blurred and it will become more so because wrok on
adsorbents may well produce materials which will displace diatomaceous earth
from its pre-eminent position as a support. Materials like silica gel or graphitised
carbon black are often used with the addition of a liquid stationary phase so that
they are active supports for gas-liquid chromatography as much as adsorbents for
gas-solid chromatography.
The aim in the development of new adsorbents is to find materials for which the
adsorption isotherms are more nearly linear. Tailing on adsorbents is caused by the](https://image.slidesharecdn.com/18252632-separation-chemistry-141124090028-conversion-gate01/85/separation-chemistry-286-320.jpg)
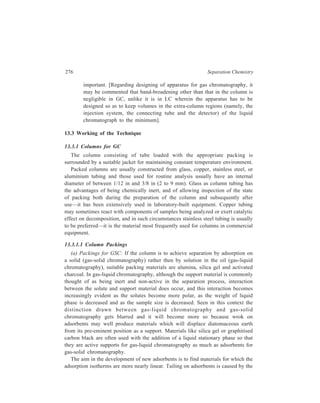
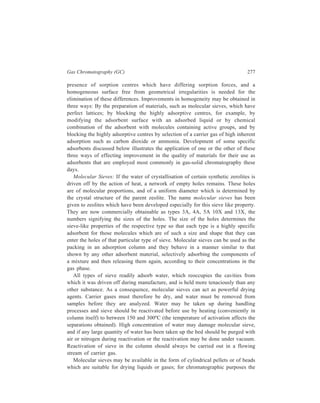
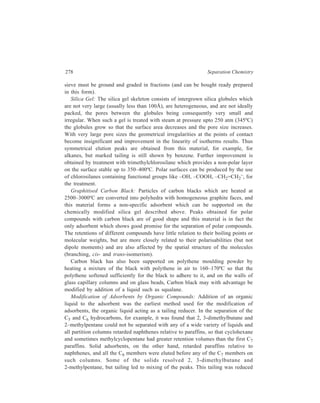
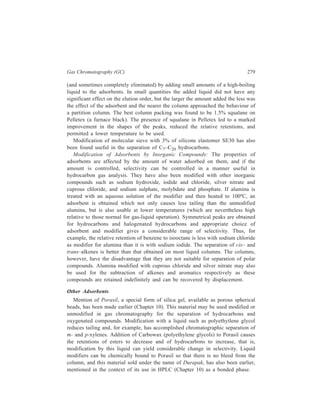
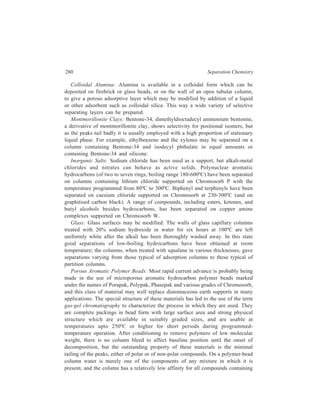
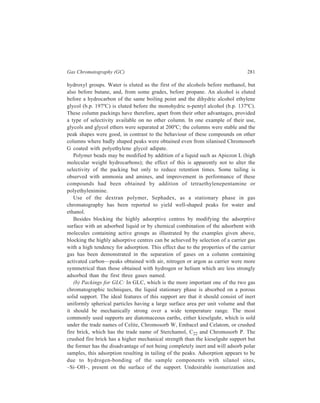
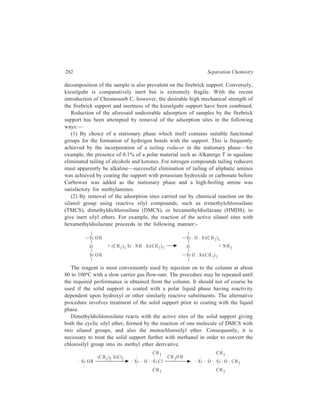
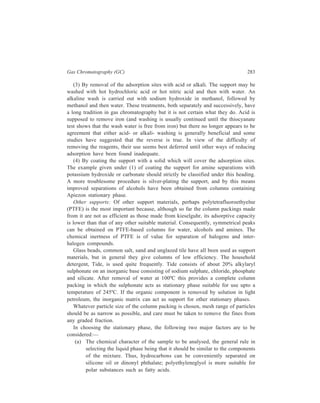
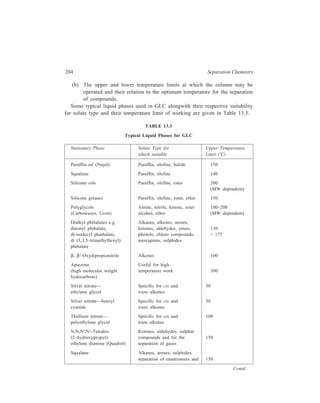
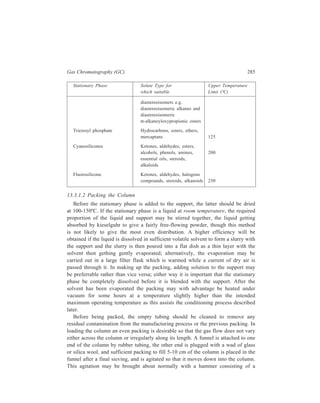
![288 Separation Chemistry
(b )
Ca rrie r ga s
Sample gas
To co lumn
To a tmosphere
Stopcocks
(a )
By-pass
(know n
v o lum e)
Column
Heatin g b lock
Heater
Plunger
Micro sy ringe
0 .1-10.0μ l
C arrier g a s
in le t
N eedle
R ubber septum
Swag elo ck fittin g
decomposed nor pressure surges
created. A precise amount of sample
has to be metered and transferred to the
column without fractionation, conden-sation
or adsorption of components.
Liquid samples are injected by hypo-dermic
syringes through self-sealing,
silicone rubber septum (compressed by
means of a threaded nut) into a heated
metal block flash-evaporator. A typical
arrangement is shown in Figure 13.4(a).
The metal block which encloses the
capillary is heated by a controlled
resistance heater. Here the sample is
vaporized as a ‘plug’ and carried into
the column by the carrier gas. Every
effort should be made to get the needle
Figure 13.4 Sample inlet systems: (a) Hypodermic needle syringe and heater
block for liquids, (b) gas sample introduction.
tip close to the packing or well down into the heated block ahead of the column.
Insertion, injection, and removal of the needle should be performed quickly. For
maximum efficiency the smallest possible sample (1 to 10 μl) consistent with
detector sensitivity should be used.
Solids are dissolved in volatile liquids, or temporarily liquefied by exposure to
infrared heat.
Gas samples are injected by a gas-tight syringe or gas-sampling valve called a
stream-splitter [Figure 13.4(b)]. In the simplest form, the stream-splitter is merely](https://image.slidesharecdn.com/18252632-separation-chemistry-141124090028-conversion-gate01/85/separation-chemistry-298-320.jpg)
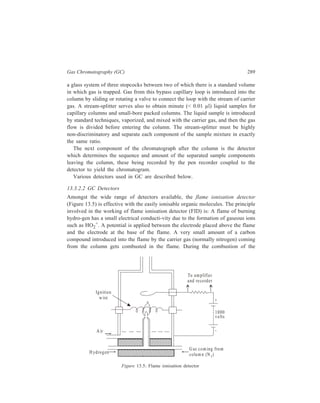
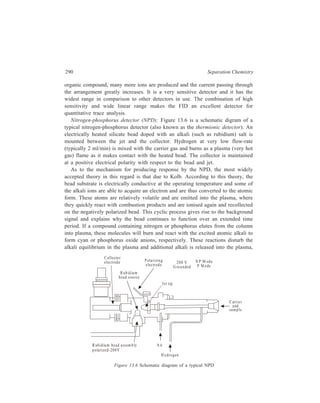
![292 Separation Chemistry
system and the column, then back into the detector through the second cell. Since
the wires in the two cells are similar and heated by equal currents, and everything
else is the same as long as the pure carrier gas is passing through each cell of the
detector, the two wires will be heated to the same temperature and their resistances
will be the same. This will be shown to be so by means of the Wheatstone bridge
which forms part of the circuit which contains the recorder [Figure 13.7(b)]. As
soon as the vapour of an organic compound coming out of the chromatographic
column enters the second cell, thermal conductivity of the gas inside that cell will
be lowered and the wire in this cell will not be able to lose its heat as fast as it
did before, and the temperature of the wire will rise. As the temperature of the wire
rises, so does its electrical resistance so that the balance of Wheatstone bridge will
suffer disturbance to which the recorder pen will correspondingly respond. By
proper circuitry it can be arranged that the movement of the recorder pen is
proportional to the concentration of the concerned constituent of the mixture.
Thermal conductivity detectors work best with helium as carrier gas, because
helium has sufficiently high conductivity, but these detectors give satisfactory
working with nitrogen also. The products are not destroyed by this method and,
so, can be collected in preparative work.
Another detector uses a fundamentally different principle. Using hydrogen as
the carrier gas, the column effluent is burnt in a small flame just above which is
suspended a thermocouple. When an organic compound emerges from the column
the flame temperature increases somewhat, causing a change in the thermocouple
signal, proportional to the vapour concentration.
In another commercially used device, the argon detector, argon is used as the
carrier gas and it flows through an ionisation chamber which is provided with a
radioactive source. Electrons are ejected which are accelerated by an electric field,
and by collisions produce large numbers of metastable argon atoms. When an
organic vapour reaches the detector its molecules collide with these metastable
atoms, producing many more electrons, and causing the ionisation current to
increase. The device is very sensitive and can detect as small a quantity as
10–13 mol of most organic compounds.
The electron capture detector (ECD) (Figure 13.8) measures the loss of signal
rather than an increase in electrical current. As the nitrogen carrier gas flows
Anode
in sula tor
Foil N2
Sample
Anode
Assembly
ECD body
Figure 13.8 Schematic diagram of a typical ECD.](https://image.slidesharecdn.com/18252632-separation-chemistry-141124090028-conversion-gate01/85/separation-chemistry-302-320.jpg)
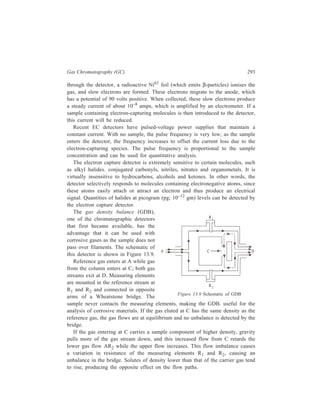
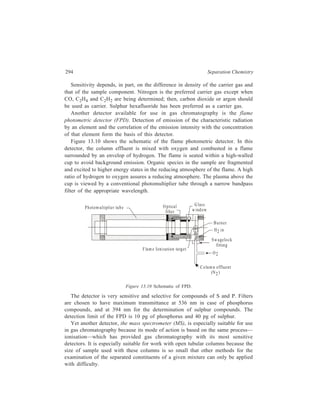
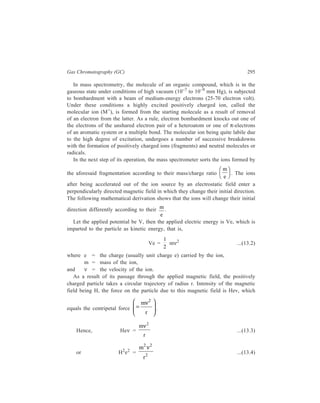
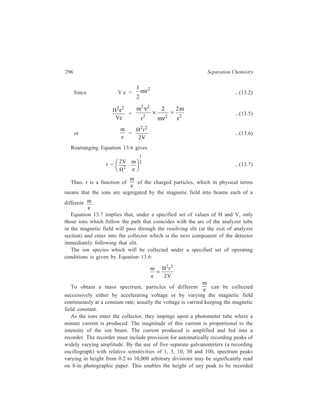
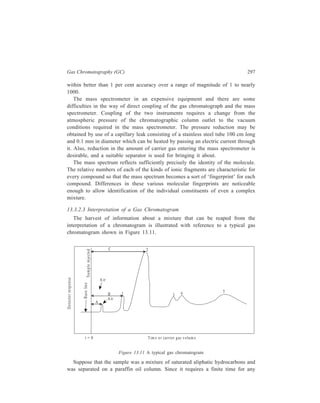
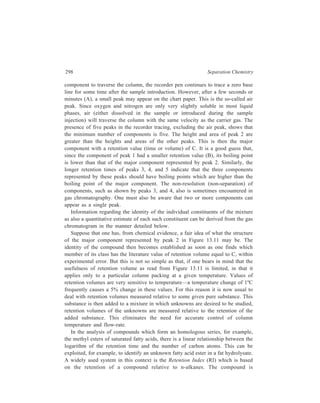
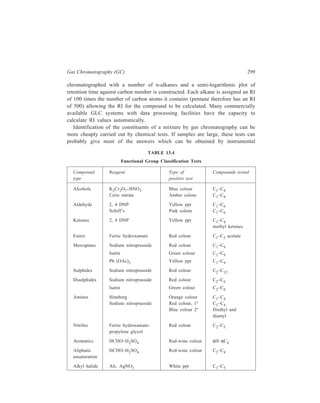
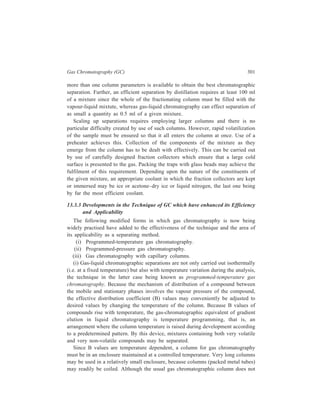
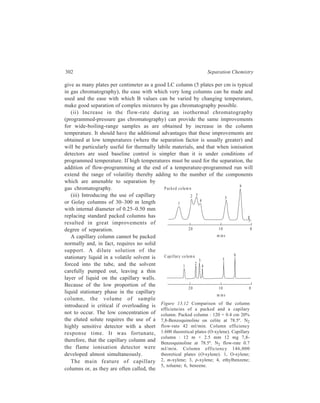
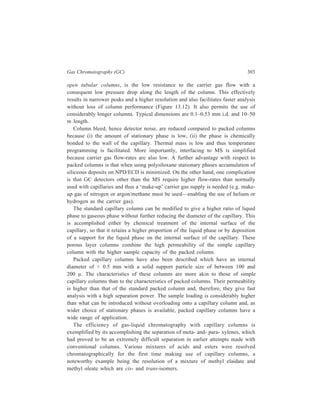
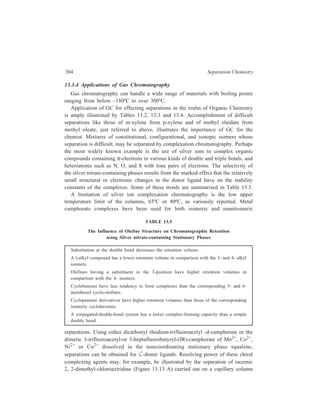
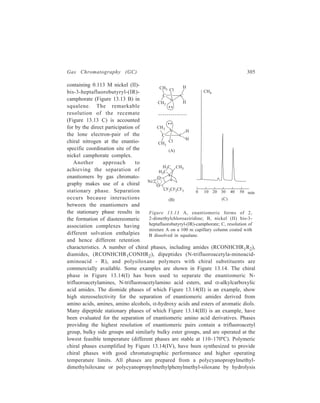
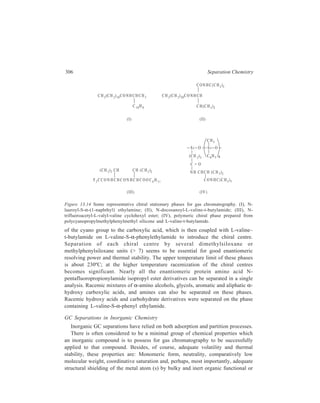
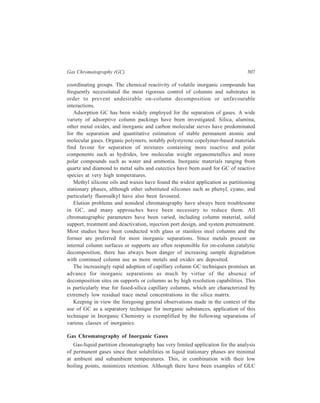
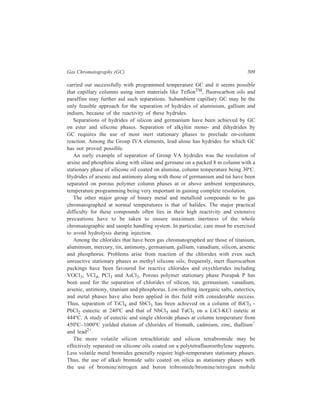
![Gas Chromatography (GC) 311
adduction by solvent or other ligand species. Stable complexes are formed with
ions such as Be2+, Al3+ and Cr3+, which conform to the above rule. Other ions
such as Ni2+, Co2+, Fe2+, and La3+, which readily adduct additional neutral
ligands and assume a coordination state greater than twice their oxidation state, are
difficult to gas chromatograph. Formation of hydrates lowers the volatility and
increases the polarity of the derivative and this results in undesirable column
behaviour. Acetylacetonates of metals such as Cu2+, Ni2+, Co2+, Fe2+ and La3+
which are not coordinatively saturated, however, tend to solvate, polymerise, or
may undergo on-column reaction with active sites thereby giving excessive peak
broadening or even irreversible adsorption on column or in the GC system. In fact,
the non-fluorinated beta-diketonates are generally of marginal thermal and
chromatographic stability; they usually require column temperatures that are too
high for thermal degradation to be completely absent.
The major breakthrough that transformed metal chelate GC into a useful
analytical technique was the introduction of fluorinated beta-diketone ligands,
which formed complexes of greater volatility and thermal stability.
Trifluoroacetylacetone (1,1,1-trifluoro-2,4-pentanedione—HTFA) and hexafluoro-acetylacetone
(1,1,1,5,5,5-hexafluoro-2,4,-pentanedione—HHFA) are the
fluorinated ligands most frequently employed. HTFA extended the range of metals
that may be gas chromatographed with little or no evidence of decomposition to
include Ga3+, In3+, Sc3+, Rh3+ and V4+. An example of a recent application is the
analysis for beryllium in ambient air particulates. After filter sampling and
extraction/chelation, packed column GC with electron capture detection allowed
ppm level beryllium quantitation in collected particulates which corresponded to
levels of 2-20 × 10–5 μg/m3 in the sampled air.
The great electron-capturing ability of HHFA complexes e.g. Cr (HFA)3, has
permitted extremely low detection limits for these complexes.
Since modifications of the basic beta-diketone structure may be made readily,
various modified chelating ligands have been evaluated for GC applications. The
widest development in ligand modification has been in the case of diketones
containing a tert-butyl group and a long-chain fluoroalkyl moiety. Thus,
1,1,1,2,2,3,3,-haptafluoro-7,7-dimethyl-4,6-octanedione [heptafluoropropanoyl-pivalylmethane
(HFOD or HHPM)] has been used for lanthanide separations. This
and other similar ligands with different fluoroalkyl substituents have been used for
a range of analytical procedures and preparative separations.
Other ligands studied were those in which donor oxygen atoms of the beta-diketones
were substituted by sulphur or nitrogen atoms. Example of such ligands
are:](https://image.slidesharecdn.com/18252632-separation-chemistry-141124090028-conversion-gate01/85/separation-chemistry-321-320.jpg)
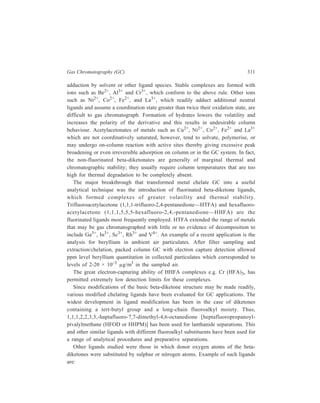
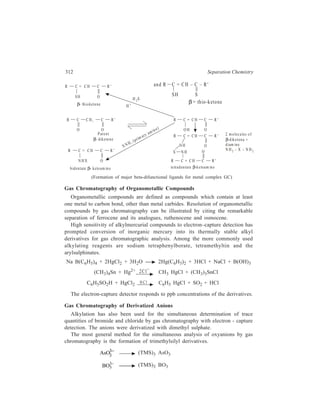
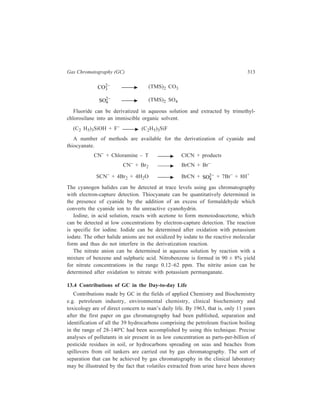
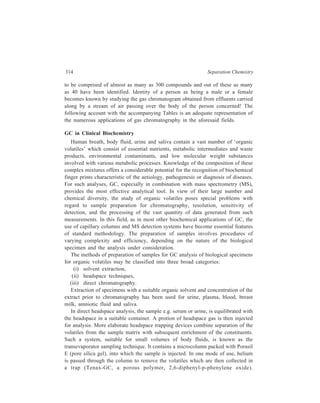
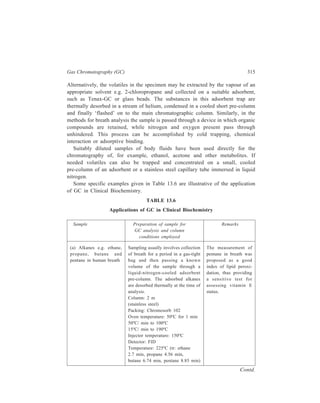
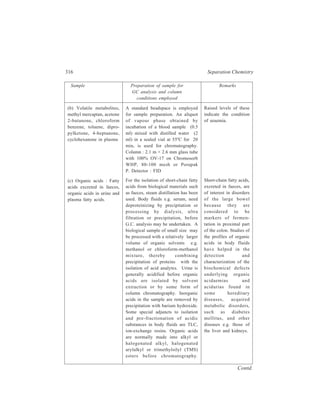
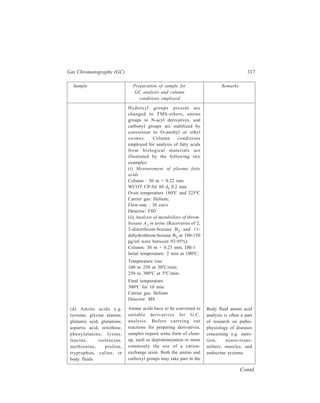
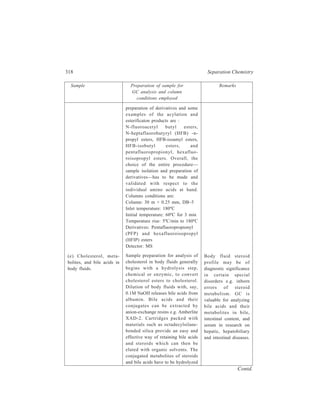
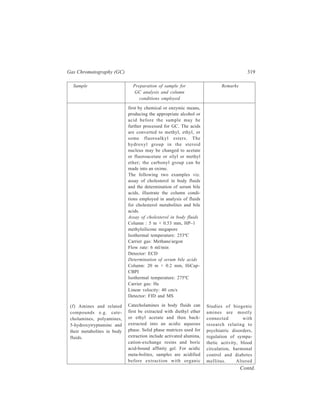
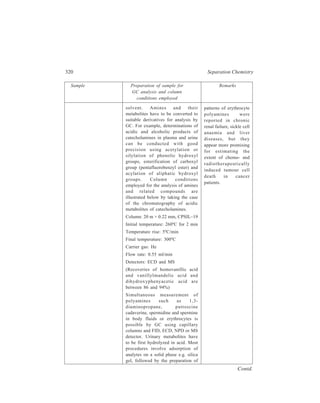
![322 Separation Chemistry
As is the case with GC in Analytical Biochemistry, there is need for some form
of sample pretreatment for GC in Analytical Toxicology, and the sample
preparation procedures already discussed under ‘GC in Analytical Biochemistry’
are used to meet the aforesaid need as well.
In drug-screening, low-polarity phases such as SE-30/OV-1/OV 101 are used.
These are dimethylpolysiloxane stationary phases which are regarded as broadly
equivalent. Polar interactions are minimal with these phases and thus separations
occur largely on the basis of molecular weight. However, a disadvantage is that
peak tailing may occur with polar compounds. In general, peak tailing is reduced
on more polar phases; SE–54, OV-7, OV-17, and OV-225 are amongst the more
polar polysiloxane-based phases available. Carbowax 20 M (polyethylene glycol
of average formula weight 20,000) is a high-polarity phase but has a relatively low
maximum operating temperature. However, precoating the support with KOH
effectively minimizes peak-tailing of strong bases and the maximum operating
temperature is unaffected. Polyester phases such as cyclohexanedimethanol-succinate
(CHDMS) and also polyamides such as poly A103 have been advocated
for specific separations of polar compounds such as barbiturates. Mixtures of
stationary phases have also been advocated for specific problems. For example, a
commercially available mixture of SP-2110 and SP–2510-DA (Supelco) has been
widely used in the analysis of common anticonvulsants.
Use of low polarity phases such as SE-30/OV-1/OV-101 have the advantage
that retention data for a large number of drugs and other compounds of interest
generated on packed columns are available—such data are generally directly
transferable to capillary columns. However, use of a 25 m × 0.32 mm i.d. fused
silica capillary coated with cross-linked HP-5 (0.52 μ film) is advantageous when
screening for basic drugs (HP-5 is a 5% phenyl, 95% methysilicone phase).
Examples of screening of some classes of drugs are listed in Table 13.7.
TABLE 13.7
Applications of GC in Analytical Toxicology
Sample Column employed Remarks
(i) Amphetamines Capillary GC-NPD.
and related com-pounds.
Dexamphetamine [(S)-α-methyl-phenylethylamine]
and methyl-amphetamine
[(S)-N, α-dimethyl-phenylethylamine]
are commonly-abused
central nervous system
(CNS) stimulants. Other drugs such
as chlorphentermine, diethylpropion,
ephedrine, fenfluramine, phenter-mine,
and phenylpro-panolamine
(nor-ephedrine) may be encountered.
Contd.](https://image.slidesharecdn.com/18252632-separation-chemistry-141124090028-conversion-gate01/85/separation-chemistry-332-320.jpg)
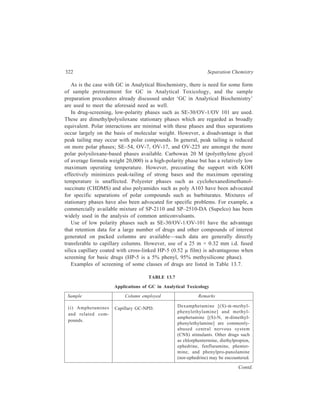
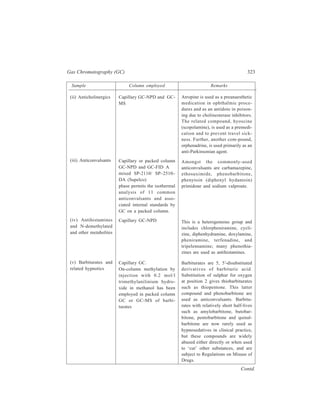
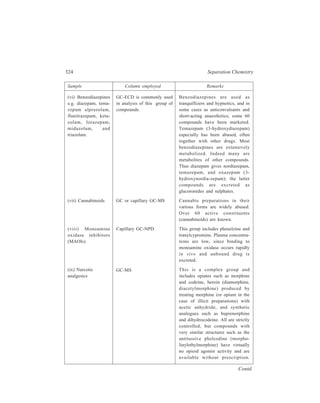
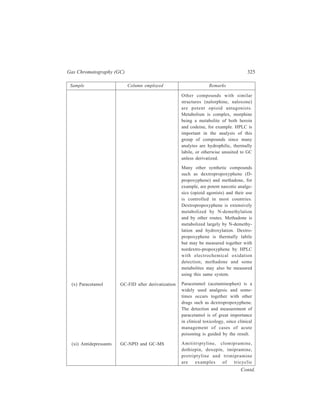
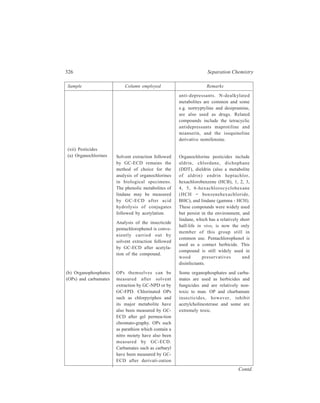
![328 Separation Chemistry
Sample Column employed Remarks
accidents remains an important
analysis. In addition, ethanol from
alcoholic drinks is very frequently
encountered in hospital admissions
due to acute poisoning. However,
poisoning with industrial alcohol
(methylated spirit) containing
various denaturants, notably
methanol, still occurs. Ethanol may
also be given to treat poisoning
with methanol or with ethylene
glycol. Methanol itself is used as a
general and laboratory solvent, in
car radiator antifreeze, and in wind-screen
washer additives. Serious
outbreaks of acute methanol
poisoning have occurred in several
countries in recent years due to the
sale of illcit ‘alcoholic’ drinks based
on methanol. Isopropanol used in
lotions for topical administration,
window and windscreen washers,
and as a solvent for toiletries, is
metabolized to acetone and is much
less toxic than methanol.
Ethylene glycol is used mainly in
car radiator antifreeze as a
concentrated (20-50%, ν/ν) aqueous
solution, sometimes together with
methanol. Propylene glycol is used
as a solvent in pharmaceutical and
food industries and is relatively
non-toxic.
Today, if anaesthesia is excluded,
acute poisoning with solvents and
other volatile substances usually
follows deliberate inhalation of
vapour in order to become
intoxicated [volatile substance
abuse (VSA)]. Patients who ingest
solvents or solvent-containing
products either by accident or
isopropanol and acetone) are
to be measured. (Direct
injection or headspace
methods have been
employed for ethanol and
are often applicable to the
other compounds).
A column packed with a
porous polymer such as
Chromosorb 101 or, after
derivatization of the glycols
as the corresponding phenyl
boronates, on a OV-101
packed column.
Separation of many volatiles
in blood or in tissue digests
is often conveniently carried
out with headspace GC
using a packed column [e.g.
a 2 m × 2 mm i.d. 0.3% (w/
w) Carbowax 20 M on
Carbopack C column]
programmed from 35ºC to
(d) Glycols
(e) Solvents and
volatiles
Contd.](https://image.slidesharecdn.com/18252632-separation-chemistry-141124090028-conversion-gate01/85/separation-chemistry-338-320.jpg)
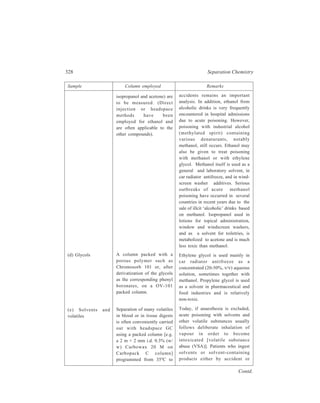
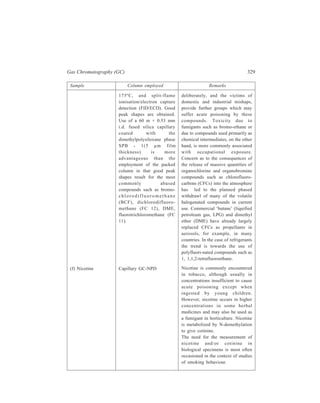
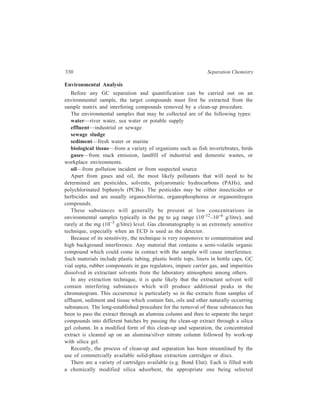
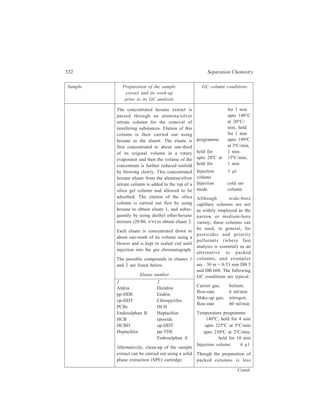
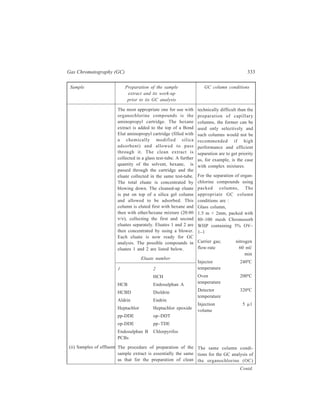
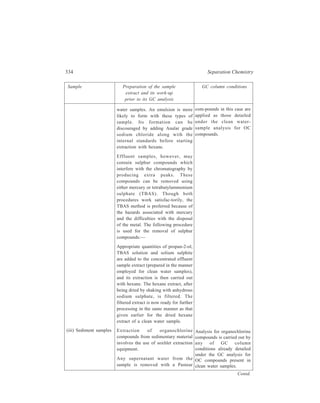
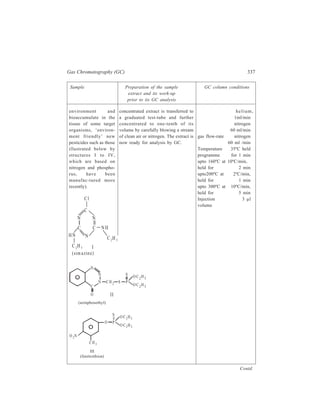
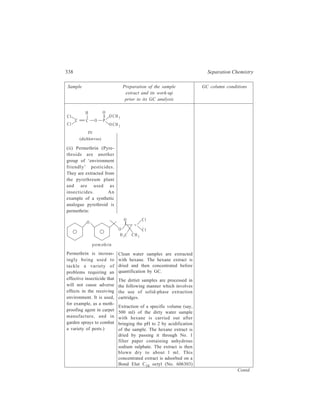
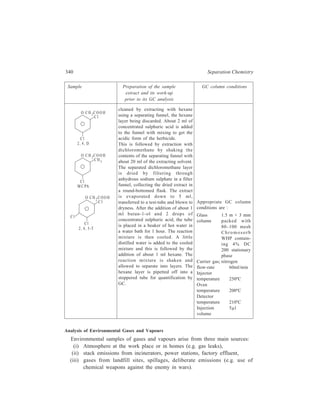
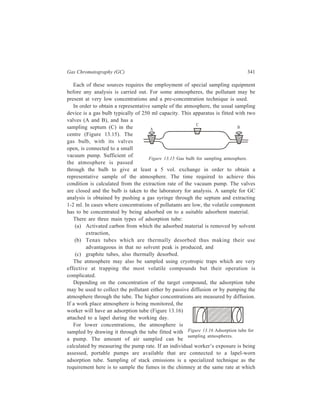
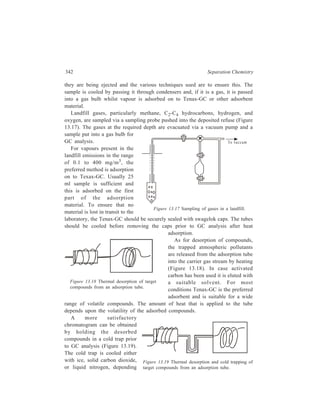
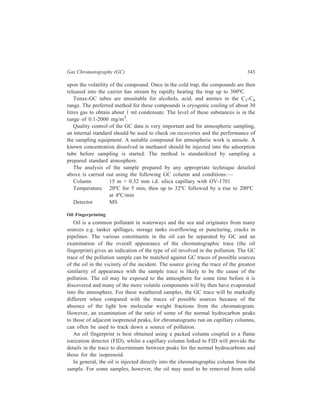
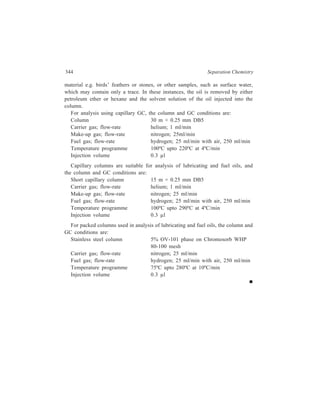
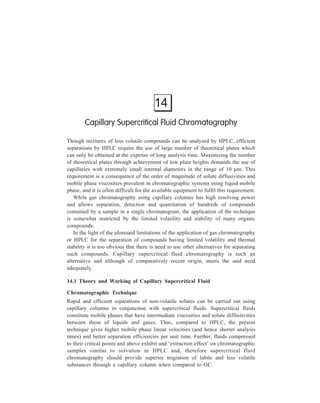
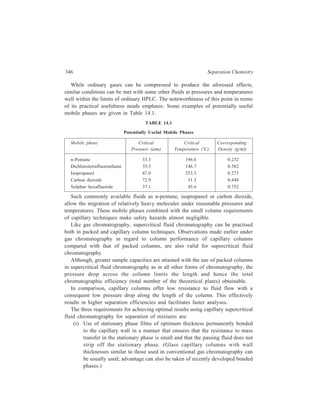
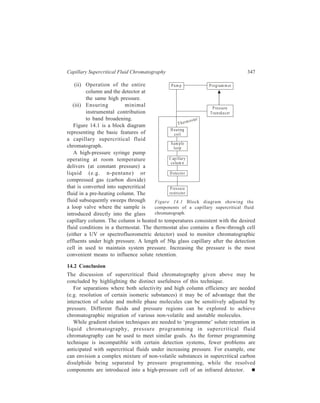
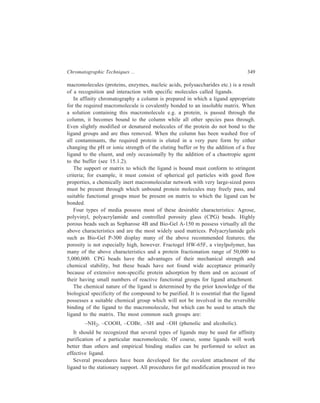
![Chromatographic Techniques ... 351
Many different spacer arms are used. The optimum length of this spacer arm is
six to ten carbon atoms or their equivalent. Spacers must possess a second
functional group to which the ligand may be attached by conventional organo-synthetic
procedures. A number of supports of the agrose, dexran and
polyacrylamide type are commercially available with a variety of spacer arms pre-attached.
D ire c t
a ttachmen t
o f lig and
Ligand
b ind in g s ite
Ligand
M atrix
Ligand
b ind ing
H yd rophobic
Spacer
a rm
M atrix b on d s
Figure 15.1 Ligand-protein interaction in affinity chromatography. A
diagrammatic representation of the interaction between matrix-bound ligand and
protein showing the necessity of a ‘spacer arm’ joining the ligand to the matrix.
Attachment of the ligand to the cyanogen bromide-activated agrose has been
outlined earlier. The following reactions illustrate ligand attachment to some of the
most widely used activated gels, which are commercially available and have pre-attached
spacer arms:—
O
(1) g el – N H – (CH2 )5C OO H + liga n d – N H 2 g el – N H – (C H2 )5 – C – N H lig an d
CH – A garose
[6-Aminohexanoic Acid (CH) – Agarose]
O
(2) g el – N H – (C H2 )6 – N H 2 + liga n d – CO O H g el – N H – (C H 2 )6 – N H – C – lig a nd
AH – A garose
[1 , 6 – D iaminohexane (AH) – A garose]
(3) g el – O – C H 2 – C H – CH 2 + lig a n d – O H g el – O – C H2 – C H – C H 2
O OH
O – lig a n d
Epoxy-a c tiva ted A ga rose
[prov ides for the a ttachment o f
ligands co n tain ing hyd roxyl,
th iol o r am in o g roups]](https://image.slidesharecdn.com/18252632-separation-chemistry-141124090028-conversion-gate01/85/separation-chemistry-361-320.jpg)
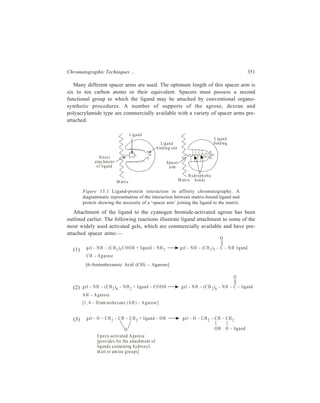
![354 Separation Chemistry
on the affinity gel. The most useful agents are urea, guanidine. HCl, CNS–,
C1O4
–, and CCl3 COO–. These substances should be used with care, because they
may cause irreversible structural changes in the isolated macromolecule.
Elution carried out by any of the above procedures eventually yields the
purified material in a buffer solution which may be contaminated with specific
eluting agents or high concentration of salts and these must finally be removed
before the isolation is complete.
Figure 15.2 is a diagramatic representation of purification of an enzyme by
affinity chromatography.
15.2 Dye-ligand Chromatography
In dye-ligand chromatography, a dye is immobilised and used as a ligand. The
dyes used contain ionic groups and a conjugated ring system which have the
ability to bind to the catalytic or effector site of some proteins. Thus, Cibacron-
Blue, which is one of a number of triazine dyes which can be immobilised,
illustrates the use of a dye as a ligand to purify proteins. In this technique, the
interaction between the macromolecule and ligand is not genuinely specific, so that
this technique is preferably termed as dye-ligand chromatography. Examples of
proteins purified by this procedure are provided by interferon and plasminogen.
15.3 Covalent Chromatography
It differs from affinity chromatography in that it involves covalent bond formation
between the bound ligand and the compound to be separated (most commonly
proteins). The most common form involves the formation of a disulphide-bond
between thiol groups in the compound and ligand. Commercially available ligands
include thiopropyl—Sepharose and thiol—Sepharose. Elution is carried out with
dithiothreitol or cysteine, the success of the technique depending on the number of
thiol groups in the protein and the case with which the disulphide bonds are broken
by the eluent. Papain and urease which have many thiol groups are both readily
purified by the technique and newly synthesized m-RNA can be separated from
other RNA and DNA by a similar procedure.
15.4 Hydroxylapatite Chromatography
Cystalline hydroxylapatite [Ca10 (PO4)6 (OH)2] is an adsorbent used to separate
mixtures of proteins or nucleic acids. The mechanism of adsorption is not fully
understood but is thought to involve both the calcium ions and phosphate ions on
the surface and to involve dipole-dipole interactions and possibly electrostatic
attractions. One of the most important applications of hydroxylapatite
chromatography is the separation of single-stranded from double-stranded DNA.
Both forms of DNA bind at low phosphate buffer concentrations but as the buffer
concentration is increased further, double-stranded DNA is released. The affinity](https://image.slidesharecdn.com/18252632-separation-chemistry-141124090028-conversion-gate01/85/separation-chemistry-364-320.jpg)
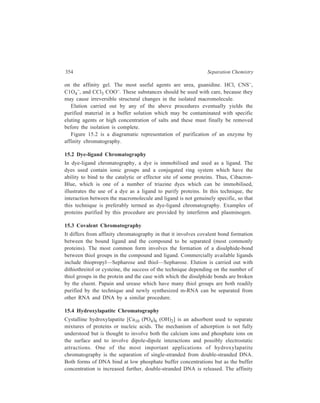
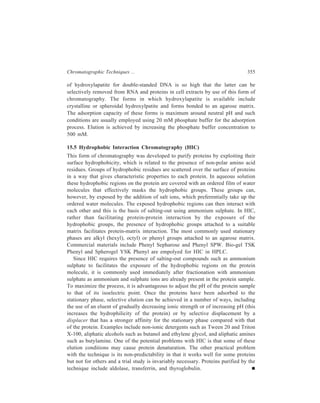

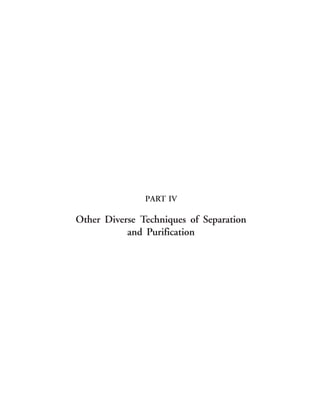
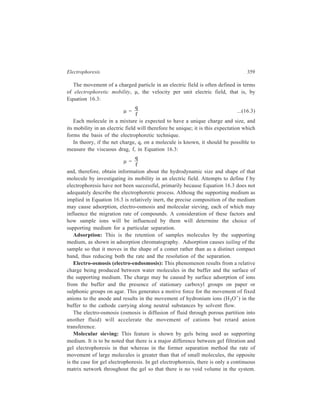
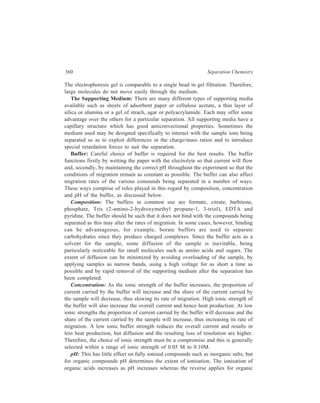
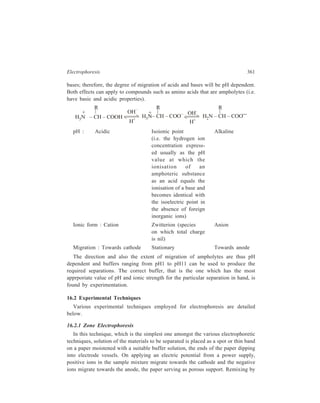
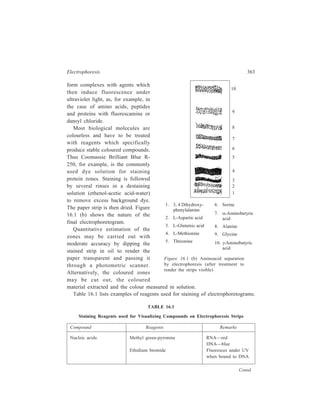
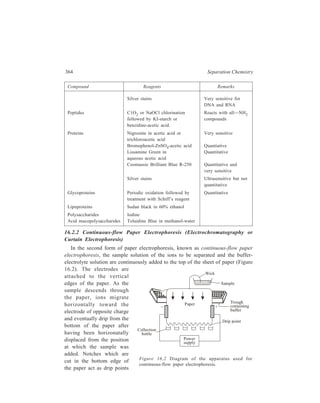
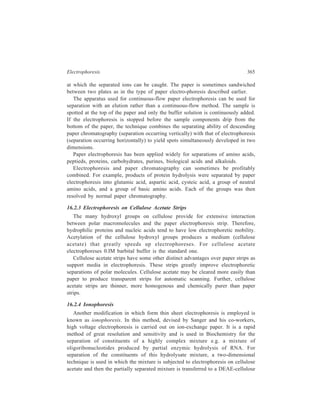
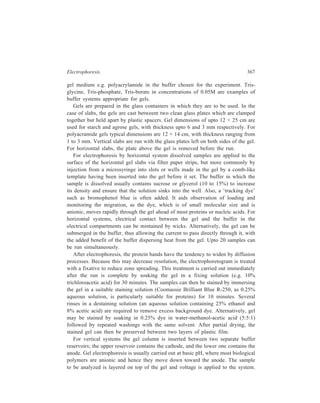
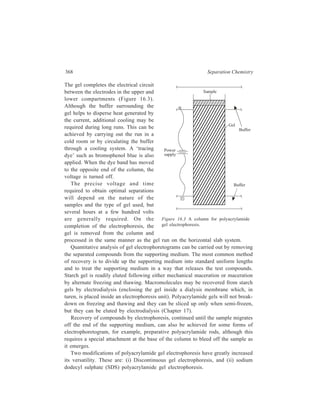

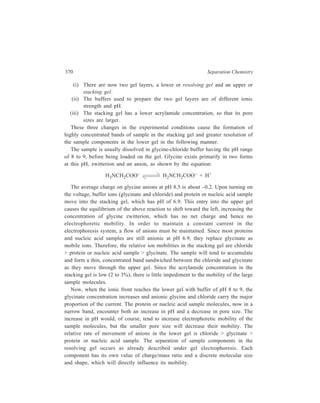
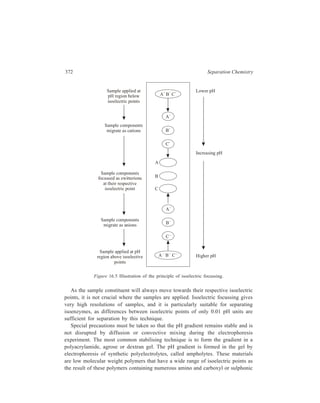
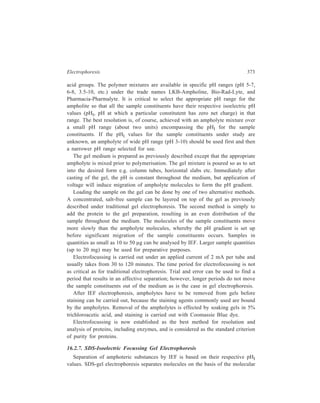
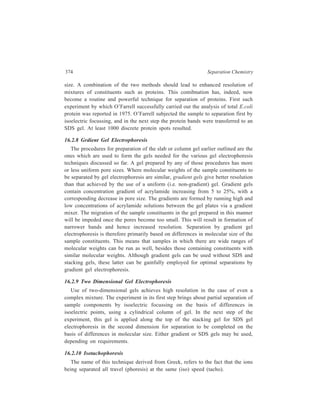
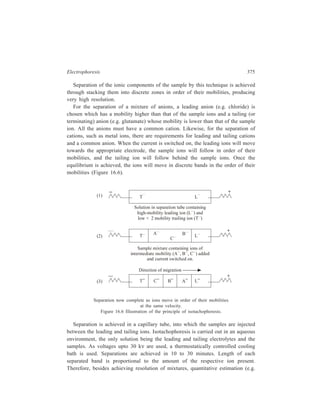
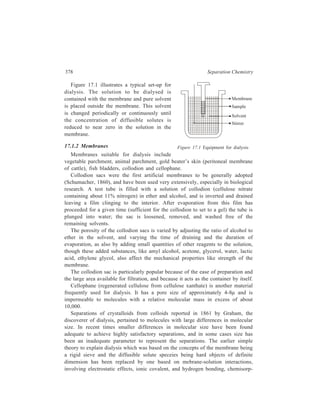
![Membrane-based Methods 381
(1) (2)
a + x Na+ Na+ b – x
a R–
x Cl– Cl– b – x
In order that Na+ and Cl– ions may pass through the membrane together, they must
arrive simultaneously at a given point on the membrane. The probability that they
will do this is directly proportional to the product of the ion concentraions. The
rate of diffusion of Na Cl from (2) to (1) is thus proportional to the product of the
concentrations of Na+ and Cl– in (2) that is, (b – x)2. The rate of diffusion of NaCl
from (1) to (2) is proportional to the product of the concentrations of Na+ and Cl–
in (1), that is, (a + x)x. Since the rates of diffusion are equal at equilibrium, we
have
(b – x)2 = (a + x)x ...(17.5)
This is the fundamental Donnan equation and may be written for the above
example in the form:
[Na+]2 [Cl–]2 = [Na+]1 [Cl–]1 ...(17.6)
It states that at equilibrium the product of the concentrations of Na+ and Cl–
ions in compartment (2) equals the product of concentrations of Na+ and Cl– ions
in compartment (1), which contains the nondiffusible ion.
As is evident,
[Na+]1 = [Cl–]1 + [R–]1 with reference to compartment (1), and
[Na+]2 = [Cl–]2 in compartment (2), so that Equation (17.6):
[Na+]2 [Cl–]2 = [Na+]1 [Cl–]1 can be rewritten as:
[Cl– ]
2 2
= [Cl–]1 ([Cl–]1 + [R–]1)
= [Cl– ]
2 + [Cl–]1 [R–]1 ...(17.7)
1
So
[Cl–]2 [Cl–]1
These ionic relations in the Donnan equilibrium may be summarised as:
(i) The concentration of a diffusible positive ion is greater on the side of the
membrane containing a nondiffusible negative ion, [Na+]1 [Na+]2.
(ii) The concentration of a diffusible negative ion is greater on the side of the
membrane not containing the nondiffusible negative ion,
[Cl–]2 [Cl–]1.](https://image.slidesharecdn.com/18252632-separation-chemistry-141124090028-conversion-gate01/85/separation-chemistry-391-320.jpg)
![382 Separation Chemistry
(iii) An examination of the equation:
[Cl– ] [Cl– ] ([Cl– ] [R– ] )
2 2
1 1 1 = + ,
shows that by keeping the concentration of the nondiffusible ion high
in compartment (1), we can prevent the diffusion of the diffusible species from
(2) to (1).
The above distributions are reversed when the nondiffusable ion is positive, as
in the case of protein chloride.
17.1.4 Applications
The two prerequisites that render dialysis an attractive choice as a method of
separation are: (i) The existence of a large concentration difference of the
substance to be diffused between the two process streams on the two sides of the
membrane, and (ii) a large molecular weight (and hence permeability) difference
between the species to be separated.
Amongst the applications of dialysis in industry the most outstanding one over
a long period of time has been the recovery of caustic soda in the pulp industry.
This recovery amounts to a great saving in caustic soda and it greatly reduces the
disposal problem of the waste liquor. This industrial application is an example
wherein the two prerequisites listed above are eminently met to make dialysis the
chosen method for attaining the purposeful recovery of caustic soda.
The importance of dialysis in the recovery and purification of materials in the
chemical, food, biological and pharmaceutical fields cannot be overemphasized. In
general, application of dialysis is needed when salts must be removed from
colloidal suspensions, or when low-molecular weight, but water-soluble, organic
compounds are to be separated from higher-molecular weight substances. In this
context, the role that dialysis is going to play in the foreseeable future in the
development of biotechnology can be easily visualized. In biotechnological
projects like ‘fuels from biomass’, ‘foods—nonconventional’, single-celled
organisms are cultured, suspended within large liquid masses, either to augment
natural photosynthesis or to convert its products into more useful forms e.g.
cellulose into sugars, organic acids or aldehydes and alcohols. The organisms are
often inhibited in activity by these products which must be continuously removed
with minimum trauma to the suspended organisms. Dialysis provides the gentleness
that is needed.
Examples of application of dialysis involving use of chemical-resistant
membrane are the recovery of copper and nickel sulphates from sulphuric acid, and
the recovery of iron sulphate from steel pickling liquor. In each case all
components will permeate the membrane; separations are effected because of the
differences in respective diffusion rates—for example, copper transfers at only
one-tenth the rate of sulphuric acid, and nickel is slightly slower.](https://image.slidesharecdn.com/18252632-separation-chemistry-141124090028-conversion-gate01/85/separation-chemistry-392-320.jpg)
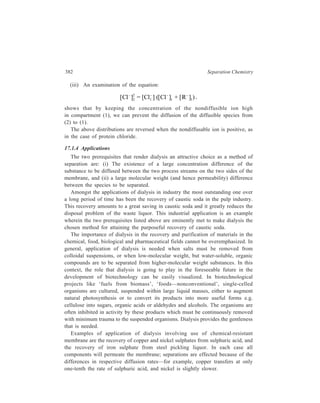
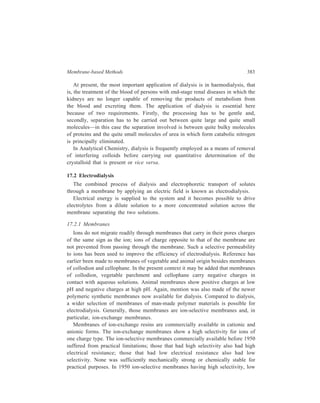
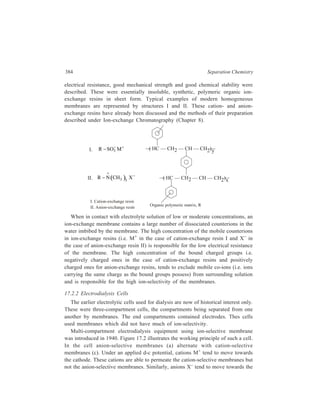
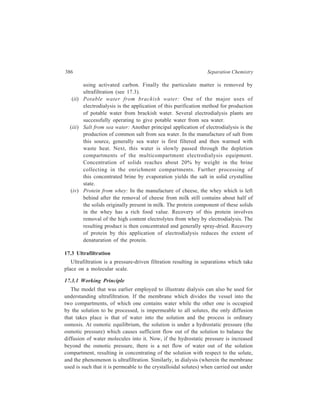
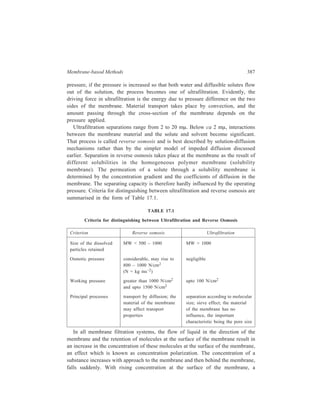
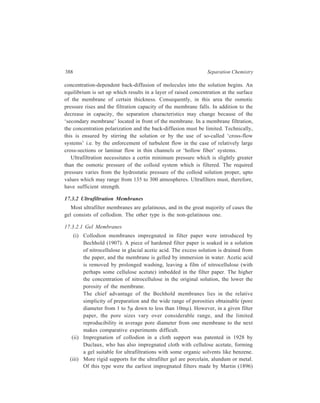
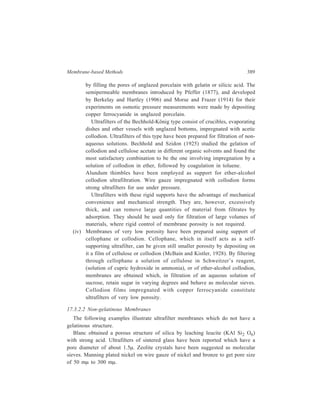
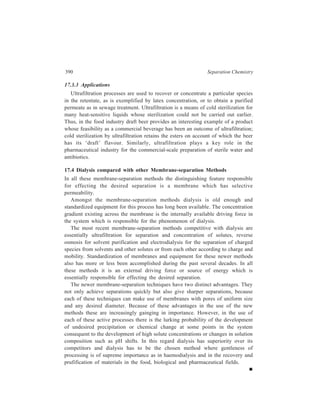
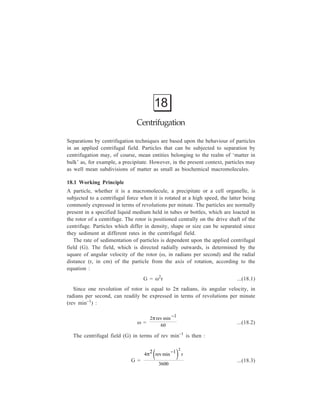
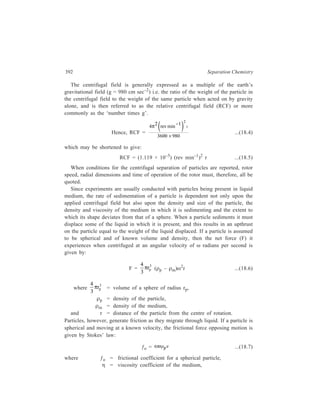
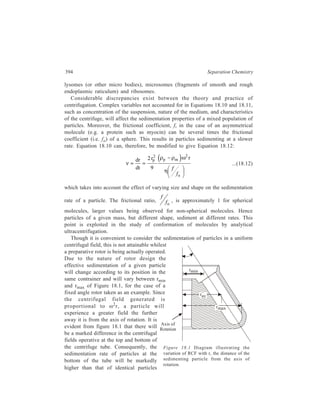
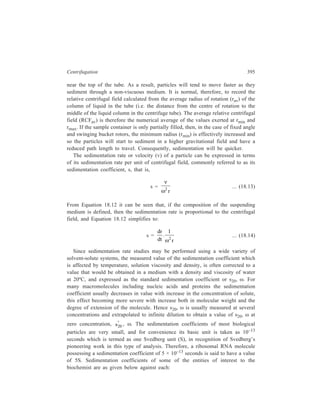
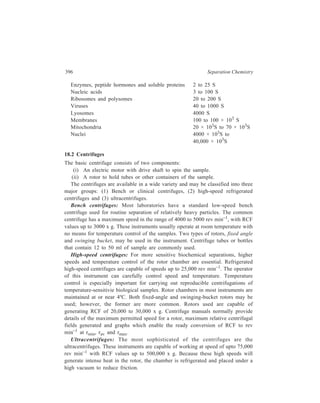
![398 Separation Chemistry
The separation achieved by differential centrifugation may be improved by
repeated (2 to 3 times) resuspension of the pellet in homogenisation medium and
recentrifugation under the same conditions as were used to get the pellet originally,
but each successive recentrifugation will inevitably reduce the yield obtained. To
appreciate why, however, the pellet is never absolutely pure (homogeneous), it is
necessary to consider the conditions prevailing in the centrifuge tube at the
beginning of each stage.
Initially all particles of the
homogenate are homogene-ously
distributed throughout
the centrifuge tube [Figure
18.2 (a)]. During centrifu-gation
particles move down
the tube at their respective
sedimentation rates [Figure
18.2 (b) to (d)], and start to
form a pellet at the bottom
of the tube. Ideally, centri-fugation
is continued long
Force field
(a) (b) (c) (d)
Centrifugation time
Solvent
Small sized particles
Medium sized particles
Large sized particles
Figure 18.2 Differential sedimentation of particulate
suspension in a centrifugal field. (a) Particles uniformly
distributed throughout the centrifuge tube; (b) to (d)
sedimentation of particles during centrifugation dependent
upon their size and shape.
enough to pellet all the
largest class of particles. However, since particles of varying sizes and densities
were distributed homogeneously throughout the centrifuge tube at the
commencement of centrifugation, it is evident that the pellet will not be
homogeneous on account of the fact that some of the lighter and medium sized
particles originally suspended near the bottom of the tube, will also have
sedimented during the time required for the complete sedimentation of heavier
particles. Pure preparations of the pellet of the heaviest particle cannot, therefore,
be obtained in one centrifugation step. It is only the most slowly sedimenting
component of the mixture that remains in the supernatant liquid, after all the larger
particles have been sedimented, which can be purified by a single centrifugal step
but its yield is often very low.
After each centri-fugation
run, the
supernatant is poured
600 × g
into another centrifuge
tube, which is then
rotated at the next
higher speed. Such
further centrifugations
of the supernatant in
successive gradually Figure 18.3 Differential centrifugation of a cell homogenate.
20,000
× g
100,000
× g
Mitochondria Microsomes Cytosol
Peroxisomes
Lysosomes
Nuclei,
Cell debris
Cell
homogenate](https://image.slidesharecdn.com/18252632-separation-chemistry-141124090028-conversion-gate01/85/separation-chemistry-408-320.jpg)
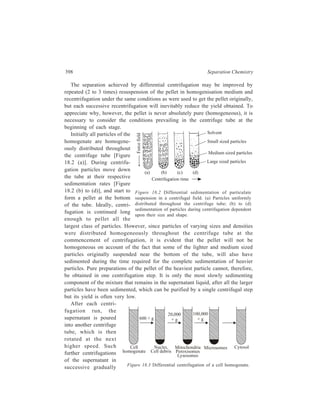
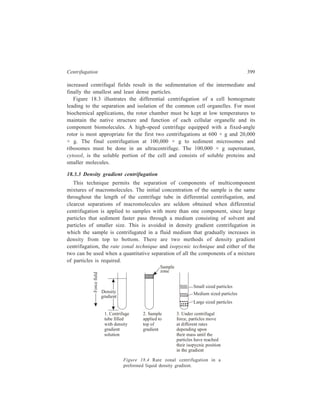
![Centrifugation 401
isopycnic (equal density) positions.
Such a technique involes a
combination of both the rate zonal
and isopycnic approaches.
As an alternative to the use of a
preformed density gradient, the
density gradient may be created
during the centrifugation. In this
method (referred to as the
equilibrium isodensity method) use
is generally made of the salts of
heavey metals (e.g. caesium or
rubidium), sucrose, colloidal silica
or Metrizamide. The sample (e.g.
DNA) is mixed homogeneously
with, for example, a concentrated
solution of caesium chloride [Figure 18.5 (a)]. Centrifugation of the concentrated
caesium chloride solution results in the sedimentation of the CsCl molecules to
form a concentration gradient and hence a density gradient. The sample molecules
(DNA), which are initially uniformly distributed throughout the tube now either
rise or sediment until they reach a region where the solution density is equal to
their own buoyant density i.e. their isopycnic position, where they will band to
form zones [Figure 18.5 (b)]. This technique suffers from the disadvantage that
often very long centrifugation times (e.g. 36 to 48 hours) are required to establish
equilibrium. However, it is commonly used in analytical centrifugation to
determine the buoyant density of a particle, the base composition of double
stranded DNA and to separate linear from circular forms of DNA. Many of the
separations can be improved by increasing the density differences between the
different forms of DNA by the incorporation of heavey isotopes (e.g. 15N) during
biosynthesis, a technique used by Meselson and Stahl to elucidate the mechanism
of DNA replication in Escherichia coli or by the binding of heavy metal ions or
dyes such as ethidum bromide. Isopycnic gradients have also been used to separate
and purify viruses and analyze human plasma lipoproteins.
Recovery and Monitoring of Gradients from Centrifuge Tubes
After particle separation has been achieved, it is necessary to remove the
gradient solution in order to isolate the bands of separated material. Removal of
gradients from centrifuge tubes can be achieved by a number of techniques. If the
bands can be visually detected, recovery can be achieved using a hypodermic
needle or syringe. A common method, however, is that of displacement. A dense
Force field
(a) Uniform
mixture of
sample and
gradient
Small sized particles
Medium sized particles
Large sized particles
(b) Under
centrifugal
force, gradient
redistributes
and sample
particles band
at their
isopycnic
positions
Figure 18.5 Isopycnic centrifugation; the
density gradient forms during centrifugation.](https://image.slidesharecdn.com/18252632-separation-chemistry-141124090028-conversion-gate01/85/separation-chemistry-411-320.jpg)
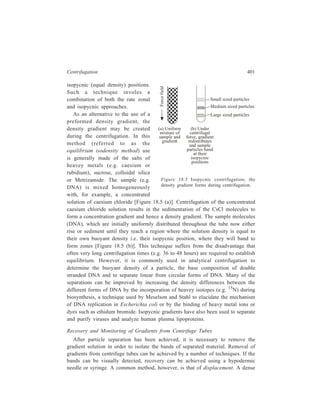
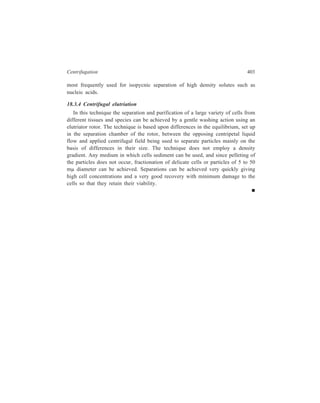
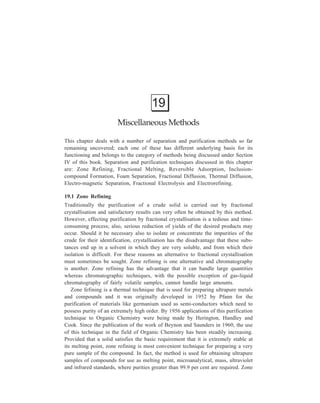
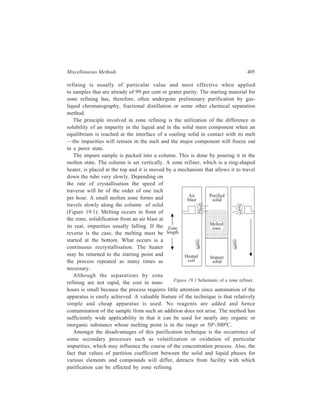
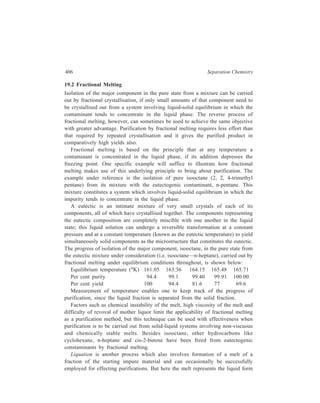
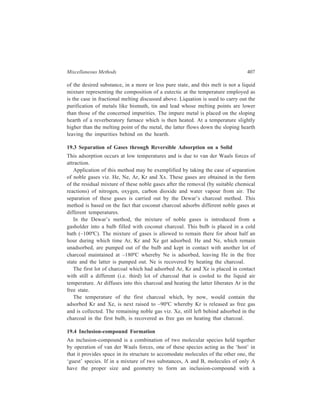
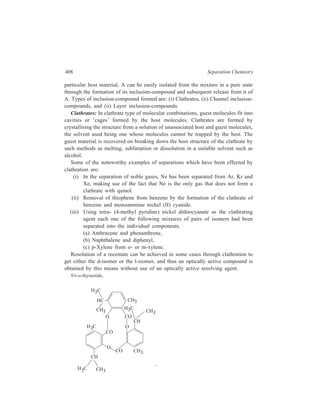
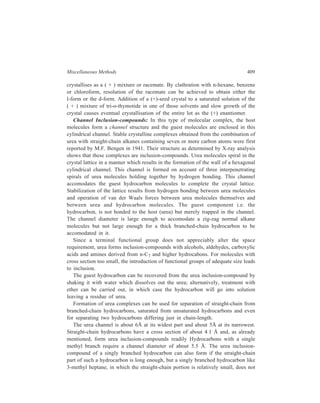
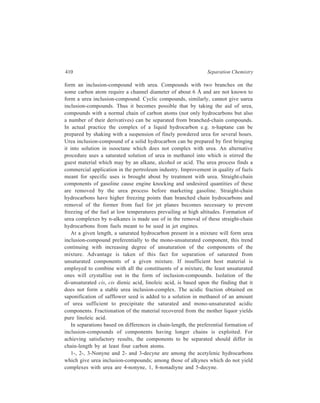
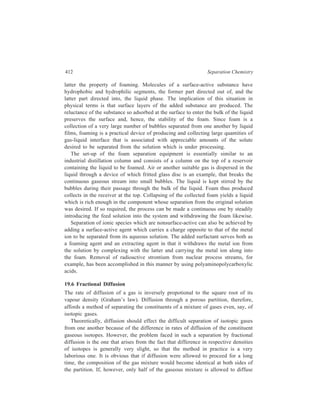
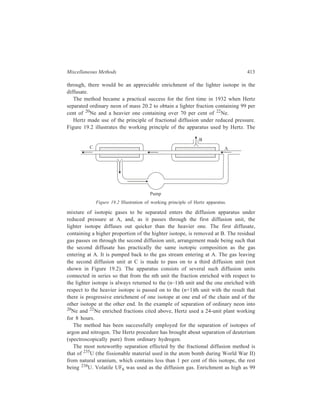
![Miscellaneous Methods 415
(analogous to the refluxing effected by a fractionating column in fractional
distillation), which multiplies the separation that would have been otherwise
achieved. As a consequence of this, the component which diffuses preferentially
toward the hot wall gets enriched at the top of the column, while the component
which diffuses preferentially toward the cold wall gets concentrated at the bottom.
Equipment used in thermogravitational separations actually comprises two verticle
concentric pipes, the inner one electrically heated and the outer one coold, thermal
diffusion being carried out in the annular space between the two pipes.
Figure 19.3 is a schematic showing distin-guishing features of working of a
single-stage thermal diffusion cell [Figure 19.3 (a)] and a thermogravitational
column [Figure 19.3 (b)].
Hot wall
Cold wall
Hot wall
Diffusion
currents
of the
different
components
(a) Single-stage cell (b) Thermogravitational column
Cold wall
Thermal
convection
current
Figure 19.3 Schematic illustrating working of thermal diffusion equipment.
With the development of specific equipment and processes by which thermal be
diffusion is now carried out, separation of substances from their mixtures can often
carried out more cheaply by this method, if applicable, than by other separation
techniques. Amongst the successful separations effected by thermal diffusion are
those of the isotopes of helium and the isotopes of chlorine gas. The method had
also been used to effect separation of the isotopes of uranium during the years of
World War II in the U.S.A. Constituent hydrocarbons can easily be separated from
their mixture by liquid-phase thermal diffusion, because interaction between
molecules of different hydrocarbons is practically non-existent and, consequently,
each hydrocarbon molecule of the mixture acts independently under the influence
of the applied temperature gradient. Another use of thermal diffusion of special
interest is its applicability to the separation of mixtures of liquids of close boiling
points and of mixtures of isomers, into their respective components.](https://image.slidesharecdn.com/18252632-separation-chemistry-141124090028-conversion-gate01/85/separation-chemistry-425-320.jpg)
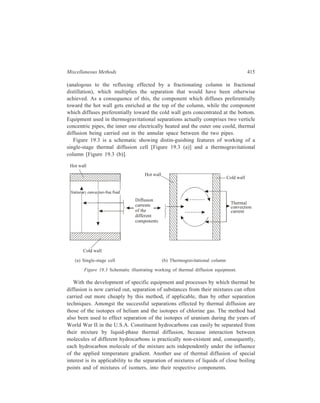
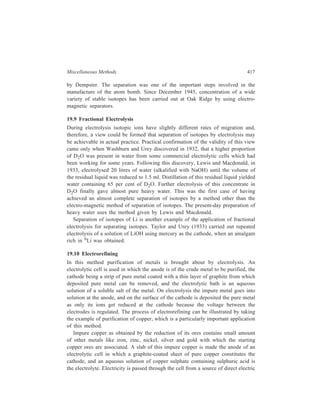
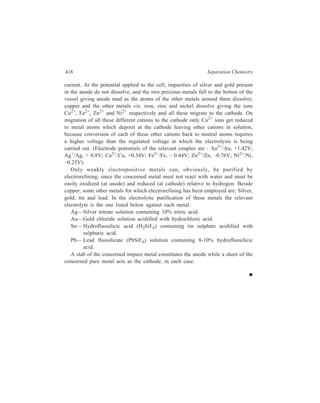
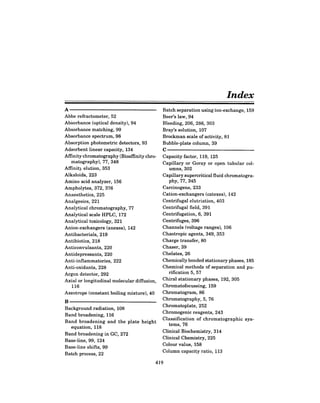
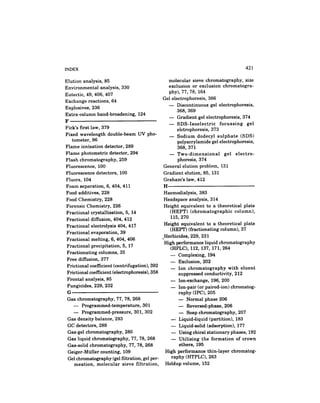
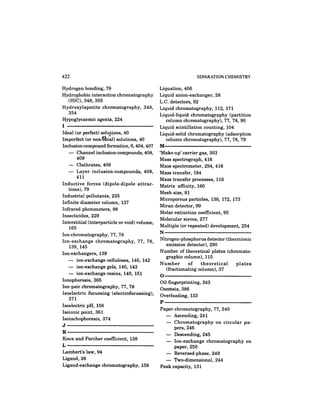
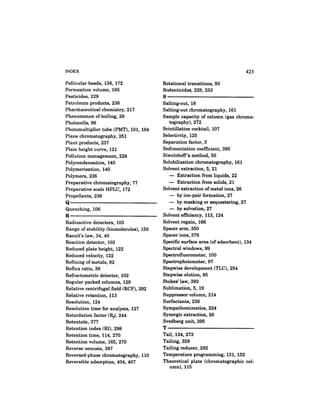

![Microchimica Acta Volume 75 issue 3-4 1981 [doi 10.1007_bf01196393] G. A. Mil...](https://cdn.slidesharecdn.com/ss_thumbnails/80630383-0717-4429-ab95-24e13a37d6a3-160302143523-thumbnail.jpg?width=640&height=640&fit=bounds)
![Microchimica Acta Volume 84 issue 5-6 1984 [doi 10.1007_bf01197162] G. A. Mil...](https://cdn.slidesharecdn.com/ss_thumbnails/34d92275-eff2-48d5-86c7-293e956dfcc9-160302143444-thumbnail.jpg?width=640&height=640&fit=bounds)


![Mannich Synthesis Under Ionic Liquid [Et3NH][HSO4] Catalysis](https://cdn.slidesharecdn.com/ss_thumbnails/d1001022023-170704092816-thumbnail.jpg?width=640&height=640&fit=bounds)


![Polymer [ बहुलक ] Chemistry Notes PDF - Irfanullah Mehar - JJ Sir Chemistry.pdf](https://cdn.slidesharecdn.com/ss_thumbnails/polymerchemistrynotespdf-irfanullahmehar-jjsirchemistry-260210172118-3f9b37f7-thumbnail.jpg?width=640&height=640&fit=bounds)


