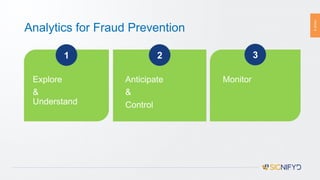
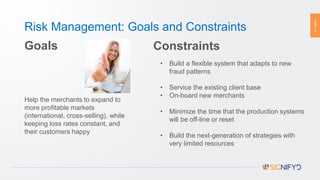
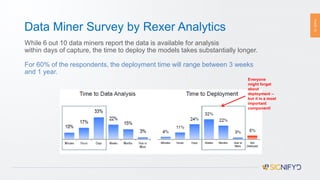
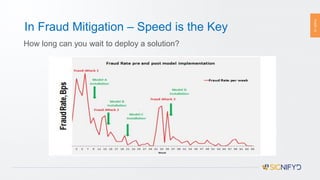
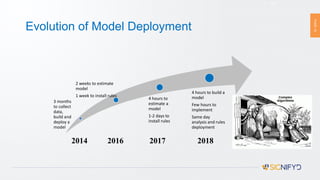
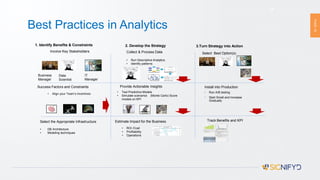
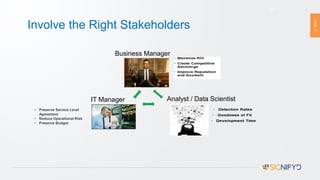
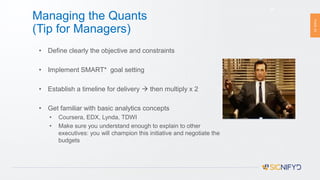
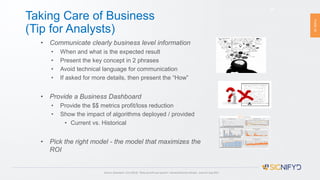
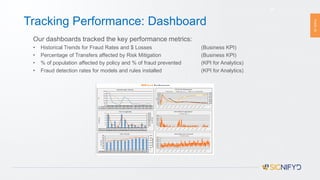
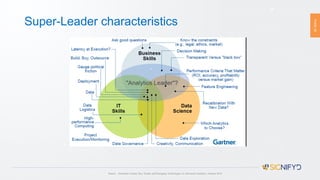
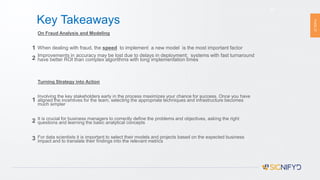
PAGE1
October 30, 2017
Julia Minkowski
Principal, Fraud Analytics, Signifyd
Real-Time Fraud Detection:
Strategies for Speed and Actionability
PAGE2
Agenda
Use Case:
Fraud Prevention in E-Commerce
What problem should your team be solving?
Best Practices:
Turning Data Mining Strategy into Action
PAGE3
PAGE4
What is special about Fraud Prevention?
1Fraud is performed by
organized criminal groups
using sophisticated
technologies and logistics
PAGE5
What is special about Fraud Prevention?
2Hard to detect: target has low
frequency (2 in 10,000)
PAGE6
What is special about Fraud Prevention?
3The cost of mistakes is very
high
60% increase
in customer
attrition if you
misclassify
(False Positives)
$ Losses if
you fail to
detect fraud
(False
Negatives)
PAGE7
What is special about Fraud Prevention?
4The environment changes
fast, so you need to adapt
quickly
PAGE8
What is special about Fraud Prevention?
5Fraud prevention is a great
field for the application of
predictive analytics
PAGE9
Analytics for Fraud Prevention
Explore
&
Understand
Anticipate
&
Control
Monitor
1 2 3
PAGE11
Risk Management: Goals and Constraints
Goals
Help the merchants to expand to
more profitable markets
(international, cross-selling), while
keeping loss rates constant, and
their customers happy
Constraints
• Build a flexible system that adapts to new
fraud patterns
• Service the existing client base
• On-board new merchants
• Minimize the time that the production systems
will be off-line or reset
• Build the next-generation of strategies with
very limited resources
PAGE12
Data Miner Survey by Rexer Analytics
While 6 out 10 data miners report the data is available for analysis
within days of capture, the time to deploy the models takes substantially longer.
For 60% of the respondents, the deployment time will range between 3 weeks
and 1 year.
Everyone
might forget
about
deployment –
but it is a most
important
component!
PAGE13
In Fraud Mitigation – Speed is the Key
How long can you wait to deploy a solution?
PAGE14
Evolution of Model Deployment
14
3 months
to collect
data,
build and
deploy a
model
2 weeks to estimate
model
1 week to install rules
4 hours to
estimate a
model
1-2 days to
install rules
4 hours to build a
model
Few hours to
implement
Same day
analysis and rules
deployment
2014 2016 2017 2018
PAGE15
Agenda
Use Case:
Fraud Prevention in E-Commerce
What problem should your team be solving?
Best Practices:
Turning Data Mining Strategy into Action
PAGE16
Best Practices in Analytics
16
Select Best Option(s)
Success Factors and Constraints
• ROI /Cost
• Profitability
• Operations
1. Identify Benefits & Constraints
Install into Production
• Run A/B testing
• Start Small and Increase
Gradually
Data
Scientist
3.Turn Strategy into Action
IT
Manager
Select the Appropriate Infrastructure
• DB Architecture
• Modeling techniques
2. Develop the Strategy
Provide Actionable Insights
Estimate Impact for the Business Track Benefits and KPI
• Test Predictive Models
• Simulate scenarios (Monte Carlo) Score
models on KPI
Collect & Process Data
• Run Descriptive Analytics
• Identify patterns
Business
Manager
• Align your Team’s Incentives
Involve Key Stakeholders
PAGE17
Involve the Right Stakeholders
17
Business Manager
Analyst / Data ScientistIT Manager
• Preserve Service Level
Agreement
• Reduce Operational Risk
• Preserve Budget
PAGE18
Conflict of Interests?
18
Cannot agree on success factors?
Wonder why?
PAGE19
IT Manager’s Strategy
19
• Preserve Service Level Agreements (SLA)
• Stable systems
• Ease of roll-back
• Minimize Operational risk
• Control Costs
19
PAGE20
Analyst / Data Scientist’s Mind
20
• Estimate the Best Model Possible
• Improve Detection Rates
• Better Algorithms, Faster Hardware
• Big(ger) Data!
• Explore New Algorithms
• Put some power behind it !!
PAGE21
Business Manager’s Mind
21
• Maximize Productivity: Build for specific
needs
– What is the cost?
– What is the impact on customer
experience?
– Why does it take so long?
– And: Don’t talk to me in Tech-Speak !
“First we ran a chi- square test, and then we converted the categorical data
to ordinal, next we ran a logistic regression, and then we lagged the
economic data by a year…”
Source: Davenport, Tom (2013), “Keep up with your quants", Harvard Business Review, Issue Jul-Aug 2013
PAGE22
Communication issue
Presenting a solution What the analyst sees What the audience sees
What the audience
remembers
What the presenter
remembers
Feedback on the
solution
Source: Eric Hixson, PhD, Cleveland Clinic, 2014
PAGE23
Managing the Quants
(Tip for Managers)
23
• Define clearly the objective and constraints
• Implement SMART* goal setting
• Establish a timeline for delivery  then multiply x 2
• Get familiar with basic analytics concepts
• Coursera, EDX, Lynda, TDWI
• Make sure you understand enough to explain to other
executives: you will champion this initiative and negotiate the
budgets
* SMART Goal setting involves establishing Specific, Measurable, Achievable, Realistic and Time-
targeted goals. Wikipedia, 2016
PAGE24
Taking Care of Business
(Tip for Analysts)
24
• Communicate clearly business level information
• When and what is the expected result
• Present the key concept in 2 phrases
• Avoid technical language for communication
• If asked for more details, then present the “How”
• Provide a Business Dashboard
• Provide the $$ metrics profit/loss reduction
• Show the impact of algorithms deployed / provided
• Current vs. Historical
• Pick the right model - the model that maximizes the
ROI
Source: Davenport, Tom (2013), “Keep up with your quants", Harvard Business Review, Issue Jul-Aug 2013
PAGE25
Tracking Performance: Dashboard
25
Our dashboards tracked the key performance metrics:
• Historical Trends for Fraud Rates and $ Losses (Business KPI)
• Percentage of Transfers affected by Risk Mitigation (Business KPI)
• % of population affected by policy and % of fraud prevented (KPI for Analytics)
• Fraud detection rates for models and rules installed (KPI for Analytics)
PAGE26
Super-Leader characteristics
26
Source: Alexander Linden, Key Trends and Emerging Technologies in Advanced Analytics, Gartner 2014
PAGE27
Key Takeaways
On Fraud Analysis and Modeling
When dealing with fraud, the speed to implement a new model is the most important factor
Improvements in accuracy may be lost due to delays in deployment; systems with fast turnaround
have better ROI than complex algorithms with long implementation times
Turning Strategy into Action
Involving the key stakeholders early in the process maximizes your chance for success. Once you have
aligned the incentives for the team, selecting the appropriate techniques and infrastructure becomes
much simpler
It is crucial for business managers to correctly define the problems and objectives, asking the right
questions and learning the basic analytical concepts
For data scientists it is important to select their models and projects based on the expected business
impact and to translate their findings into the relevant metrics
27
1
2
1
2
3
PAGE28
THANK YOU!
28

1340 keynote minkowski_using our laptop

  • 1.
    PAGE1 October 30, 2017 JuliaMinkowski Principal, Fraud Analytics, Signifyd Real-Time Fraud Detection: Strategies for Speed and Actionability
  • 2.
    PAGE2 Agenda Use Case: Fraud Preventionin E-Commerce What problem should your team be solving? Best Practices: Turning Data Mining Strategy into Action
  • 3.
  • 4.
    PAGE4 What is specialabout Fraud Prevention? 1Fraud is performed by organized criminal groups using sophisticated technologies and logistics
  • 5.
    PAGE5 What is specialabout Fraud Prevention? 2Hard to detect: target has low frequency (2 in 10,000)
  • 6.
    PAGE6 What is specialabout Fraud Prevention? 3The cost of mistakes is very high 60% increase in customer attrition if you misclassify (False Positives) $ Losses if you fail to detect fraud (False Negatives)
  • 7.
    PAGE7 What is specialabout Fraud Prevention? 4The environment changes fast, so you need to adapt quickly
  • 8.
    PAGE8 What is specialabout Fraud Prevention? 5Fraud prevention is a great field for the application of predictive analytics
  • 9.
    PAGE9 Analytics for FraudPrevention Explore & Understand Anticipate & Control Monitor 1 2 3
  • 10.
    PAGE11 Risk Management: Goalsand Constraints Goals Help the merchants to expand to more profitable markets (international, cross-selling), while keeping loss rates constant, and their customers happy Constraints • Build a flexible system that adapts to new fraud patterns • Service the existing client base • On-board new merchants • Minimize the time that the production systems will be off-line or reset • Build the next-generation of strategies with very limited resources
  • 11.
    PAGE12 Data Miner Surveyby Rexer Analytics While 6 out 10 data miners report the data is available for analysis within days of capture, the time to deploy the models takes substantially longer. For 60% of the respondents, the deployment time will range between 3 weeks and 1 year. Everyone might forget about deployment – but it is a most important component!
  • 12.
    PAGE13 In Fraud Mitigation– Speed is the Key How long can you wait to deploy a solution?
  • 13.
    PAGE14 Evolution of ModelDeployment 14 3 months to collect data, build and deploy a model 2 weeks to estimate model 1 week to install rules 4 hours to estimate a model 1-2 days to install rules 4 hours to build a model Few hours to implement Same day analysis and rules deployment 2014 2016 2017 2018
  • 14.
    PAGE15 Agenda Use Case: Fraud Preventionin E-Commerce What problem should your team be solving? Best Practices: Turning Data Mining Strategy into Action
  • 15.
    PAGE16 Best Practices inAnalytics 16 Select Best Option(s) Success Factors and Constraints • ROI /Cost • Profitability • Operations 1. Identify Benefits & Constraints Install into Production • Run A/B testing • Start Small and Increase Gradually Data Scientist 3.Turn Strategy into Action IT Manager Select the Appropriate Infrastructure • DB Architecture • Modeling techniques 2. Develop the Strategy Provide Actionable Insights Estimate Impact for the Business Track Benefits and KPI • Test Predictive Models • Simulate scenarios (Monte Carlo) Score models on KPI Collect & Process Data • Run Descriptive Analytics • Identify patterns Business Manager • Align your Team’s Incentives Involve Key Stakeholders
  • 16.
    PAGE17 Involve the RightStakeholders 17 Business Manager Analyst / Data ScientistIT Manager • Preserve Service Level Agreement • Reduce Operational Risk • Preserve Budget
  • 17.
    PAGE18 Conflict of Interests? 18 Cannotagree on success factors? Wonder why?
  • 18.
    PAGE19 IT Manager’s Strategy 19 •Preserve Service Level Agreements (SLA) • Stable systems • Ease of roll-back • Minimize Operational risk • Control Costs 19
  • 19.
    PAGE20 Analyst / DataScientist’s Mind 20 • Estimate the Best Model Possible • Improve Detection Rates • Better Algorithms, Faster Hardware • Big(ger) Data! • Explore New Algorithms • Put some power behind it !!
  • 20.
    PAGE21 Business Manager’s Mind 21 •Maximize Productivity: Build for specific needs – What is the cost? – What is the impact on customer experience? – Why does it take so long? – And: Don’t talk to me in Tech-Speak ! “First we ran a chi- square test, and then we converted the categorical data to ordinal, next we ran a logistic regression, and then we lagged the economic data by a year…” Source: Davenport, Tom (2013), “Keep up with your quants", Harvard Business Review, Issue Jul-Aug 2013
  • 21.
    PAGE22 Communication issue Presenting asolution What the analyst sees What the audience sees What the audience remembers What the presenter remembers Feedback on the solution Source: Eric Hixson, PhD, Cleveland Clinic, 2014
  • 22.
    PAGE23 Managing the Quants (Tipfor Managers) 23 • Define clearly the objective and constraints • Implement SMART* goal setting • Establish a timeline for delivery  then multiply x 2 • Get familiar with basic analytics concepts • Coursera, EDX, Lynda, TDWI • Make sure you understand enough to explain to other executives: you will champion this initiative and negotiate the budgets * SMART Goal setting involves establishing Specific, Measurable, Achievable, Realistic and Time- targeted goals. Wikipedia, 2016
  • 23.
    PAGE24 Taking Care ofBusiness (Tip for Analysts) 24 • Communicate clearly business level information • When and what is the expected result • Present the key concept in 2 phrases • Avoid technical language for communication • If asked for more details, then present the “How” • Provide a Business Dashboard • Provide the $$ metrics profit/loss reduction • Show the impact of algorithms deployed / provided • Current vs. Historical • Pick the right model - the model that maximizes the ROI Source: Davenport, Tom (2013), “Keep up with your quants", Harvard Business Review, Issue Jul-Aug 2013
  • 24.
    PAGE25 Tracking Performance: Dashboard 25 Ourdashboards tracked the key performance metrics: • Historical Trends for Fraud Rates and $ Losses (Business KPI) • Percentage of Transfers affected by Risk Mitigation (Business KPI) • % of population affected by policy and % of fraud prevented (KPI for Analytics) • Fraud detection rates for models and rules installed (KPI for Analytics)
  • 25.
    PAGE26 Super-Leader characteristics 26 Source: AlexanderLinden, Key Trends and Emerging Technologies in Advanced Analytics, Gartner 2014
  • 26.
    PAGE27 Key Takeaways On FraudAnalysis and Modeling When dealing with fraud, the speed to implement a new model is the most important factor Improvements in accuracy may be lost due to delays in deployment; systems with fast turnaround have better ROI than complex algorithms with long implementation times Turning Strategy into Action Involving the key stakeholders early in the process maximizes your chance for success. Once you have aligned the incentives for the team, selecting the appropriate techniques and infrastructure becomes much simpler It is crucial for business managers to correctly define the problems and objectives, asking the right questions and learning the basic analytical concepts For data scientists it is important to select their models and projects based on the expected business impact and to translate their findings into the relevant metrics 27 1 2 1 2 3
  • 27.