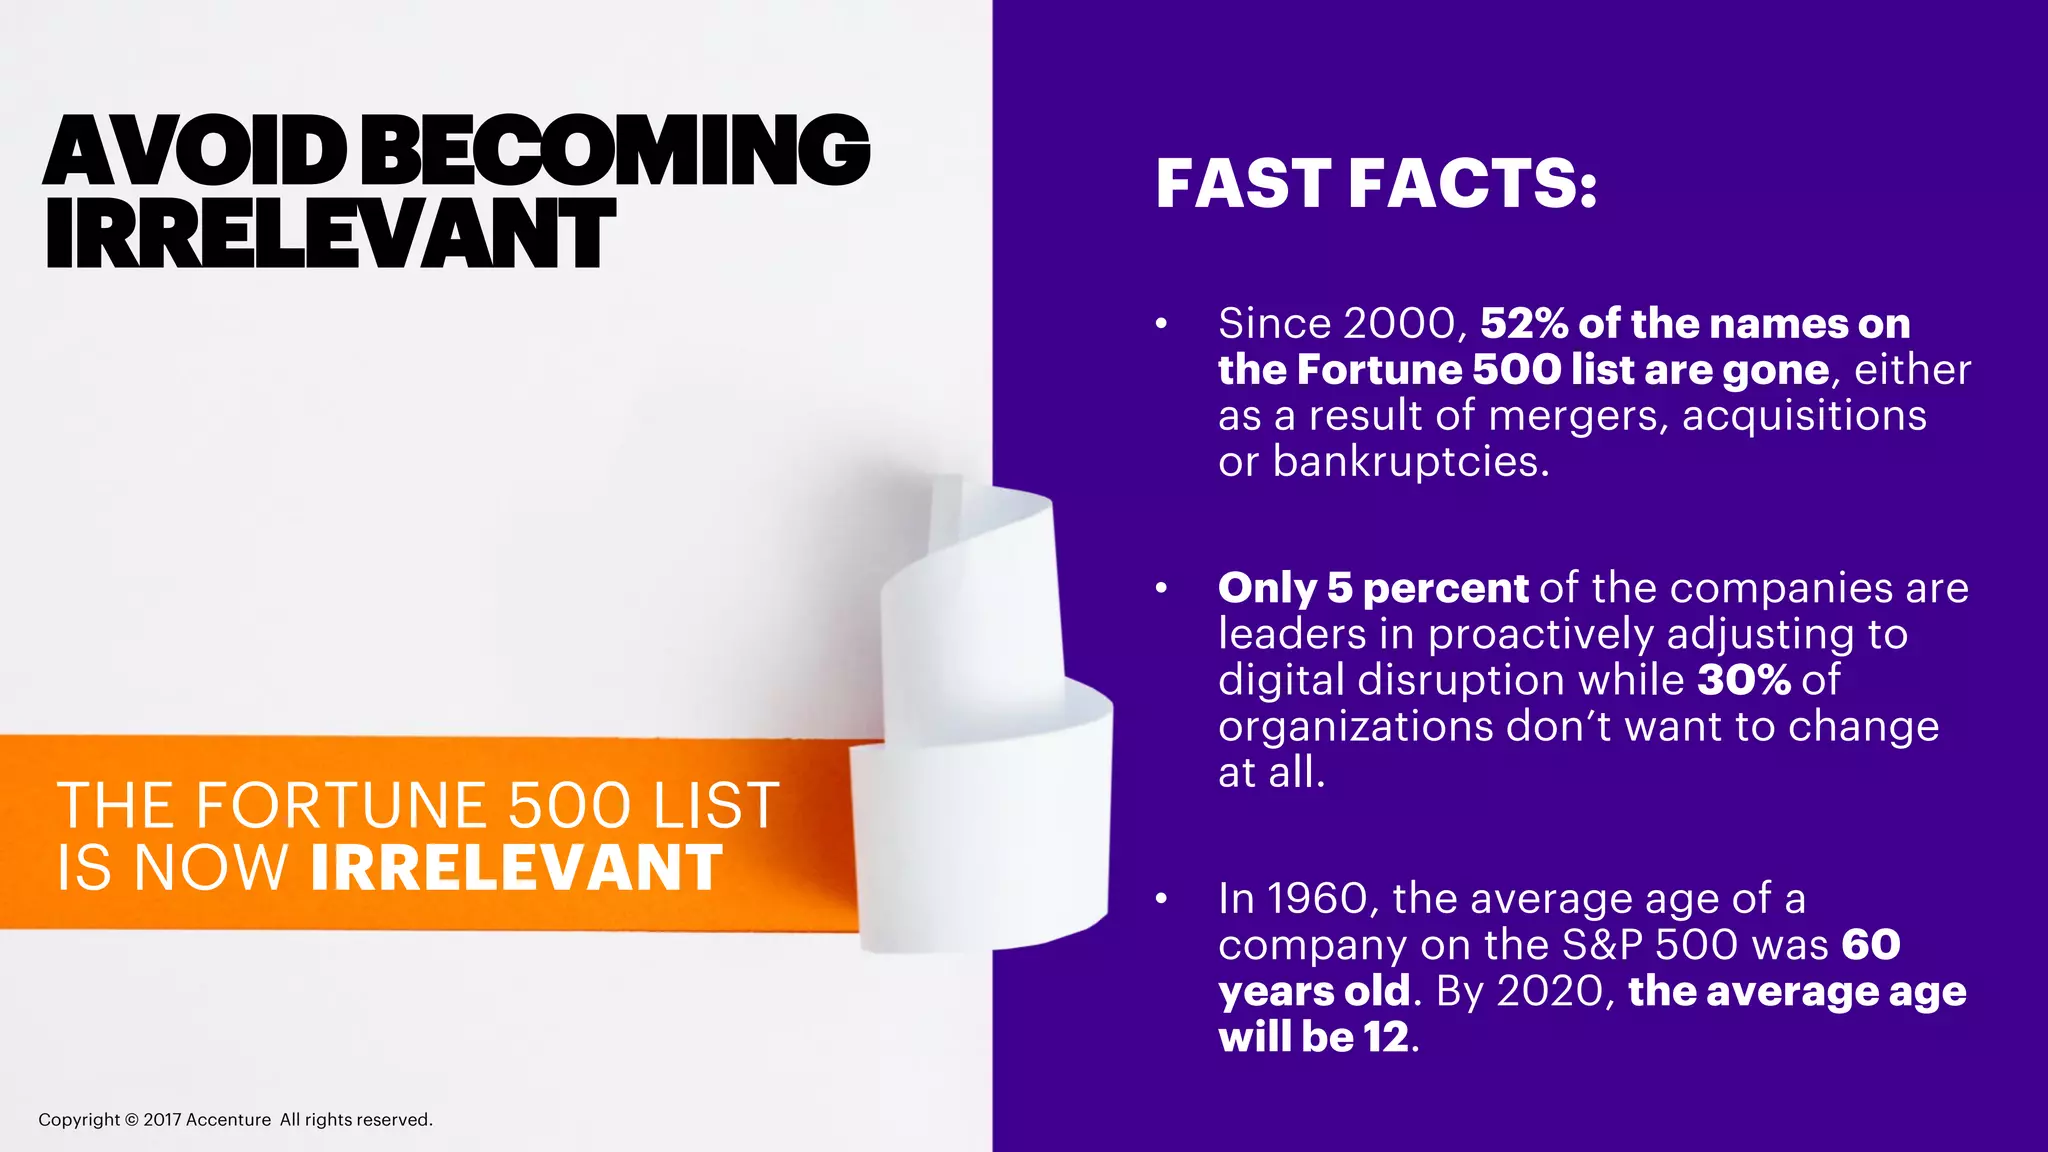
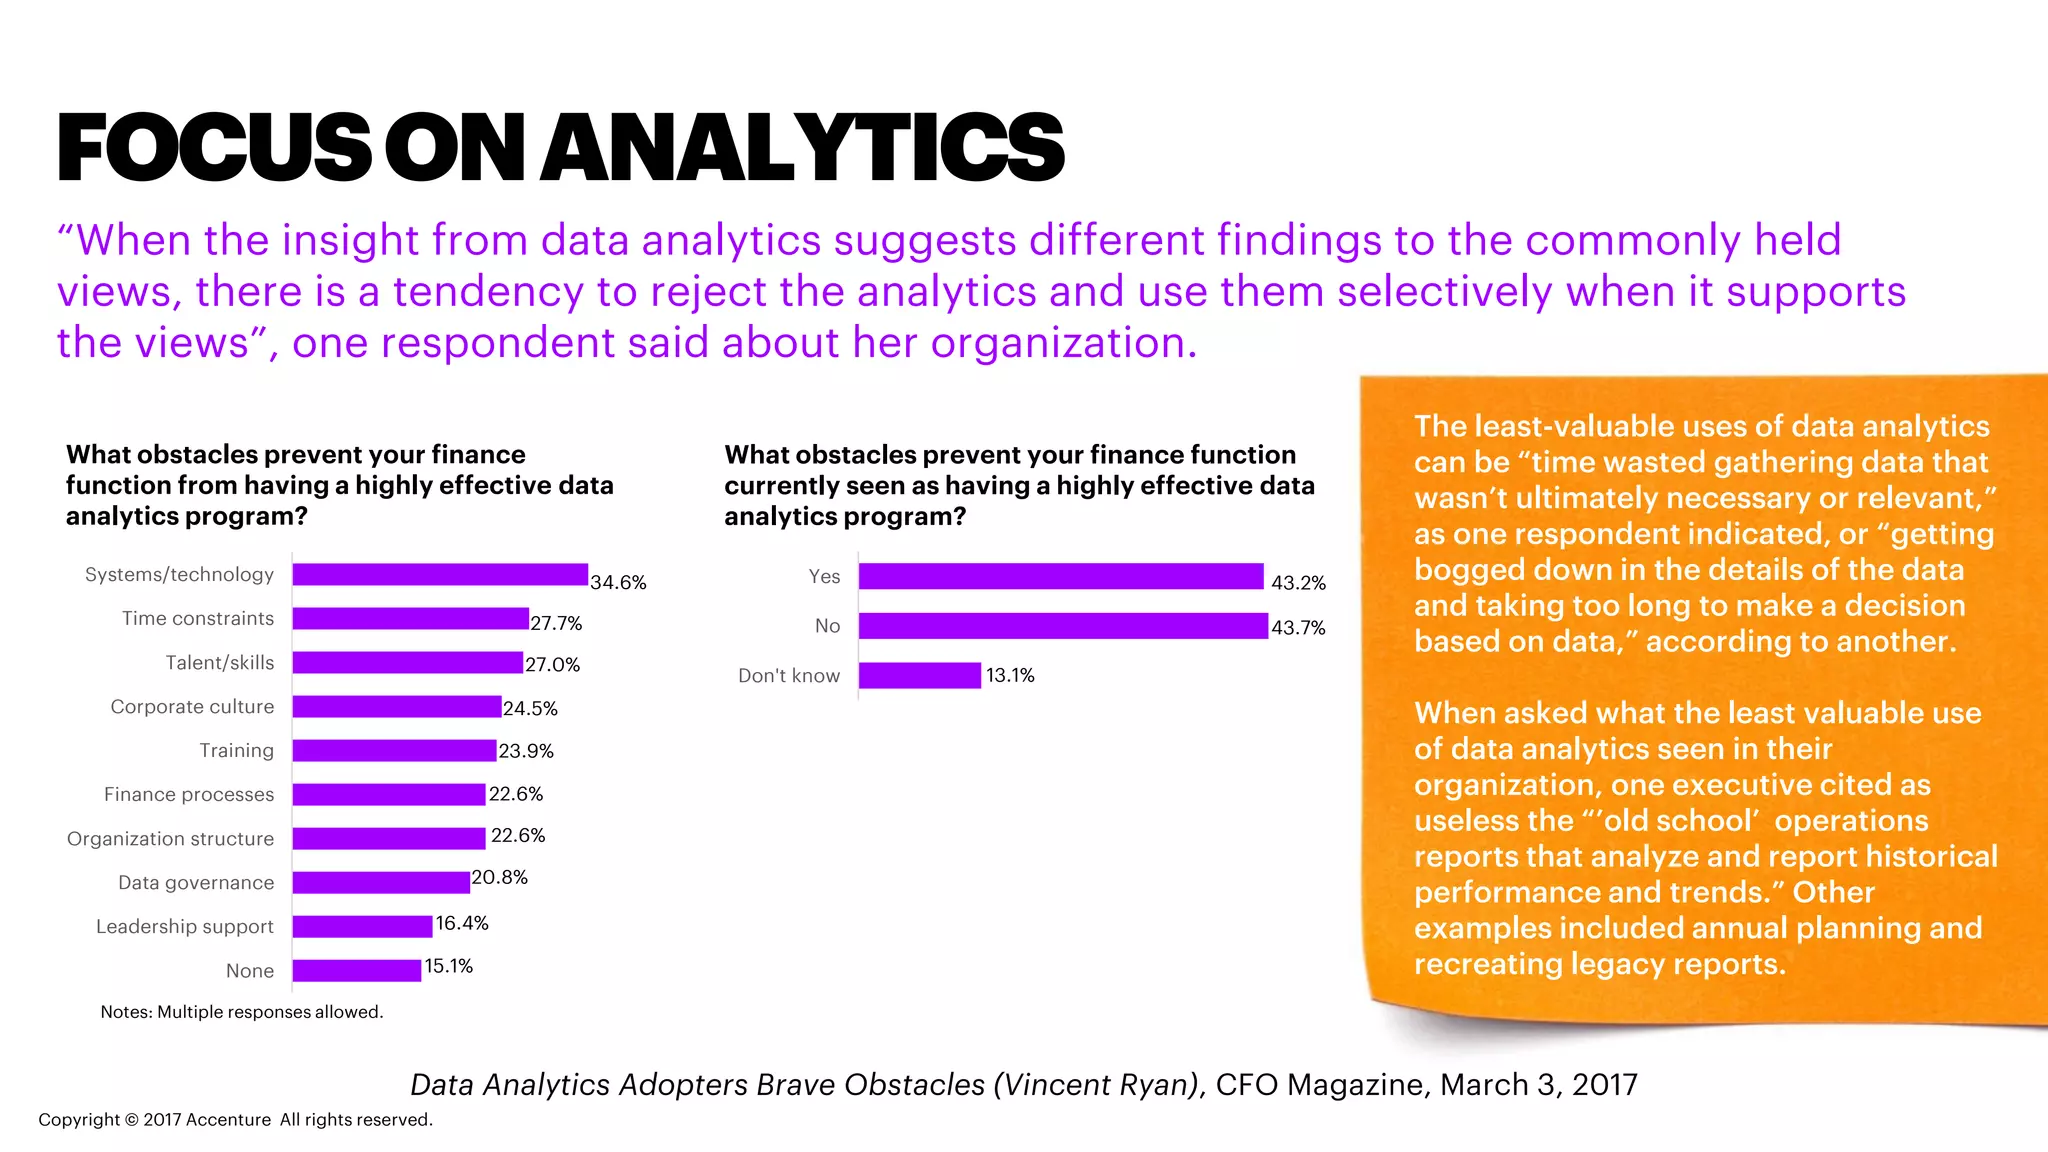
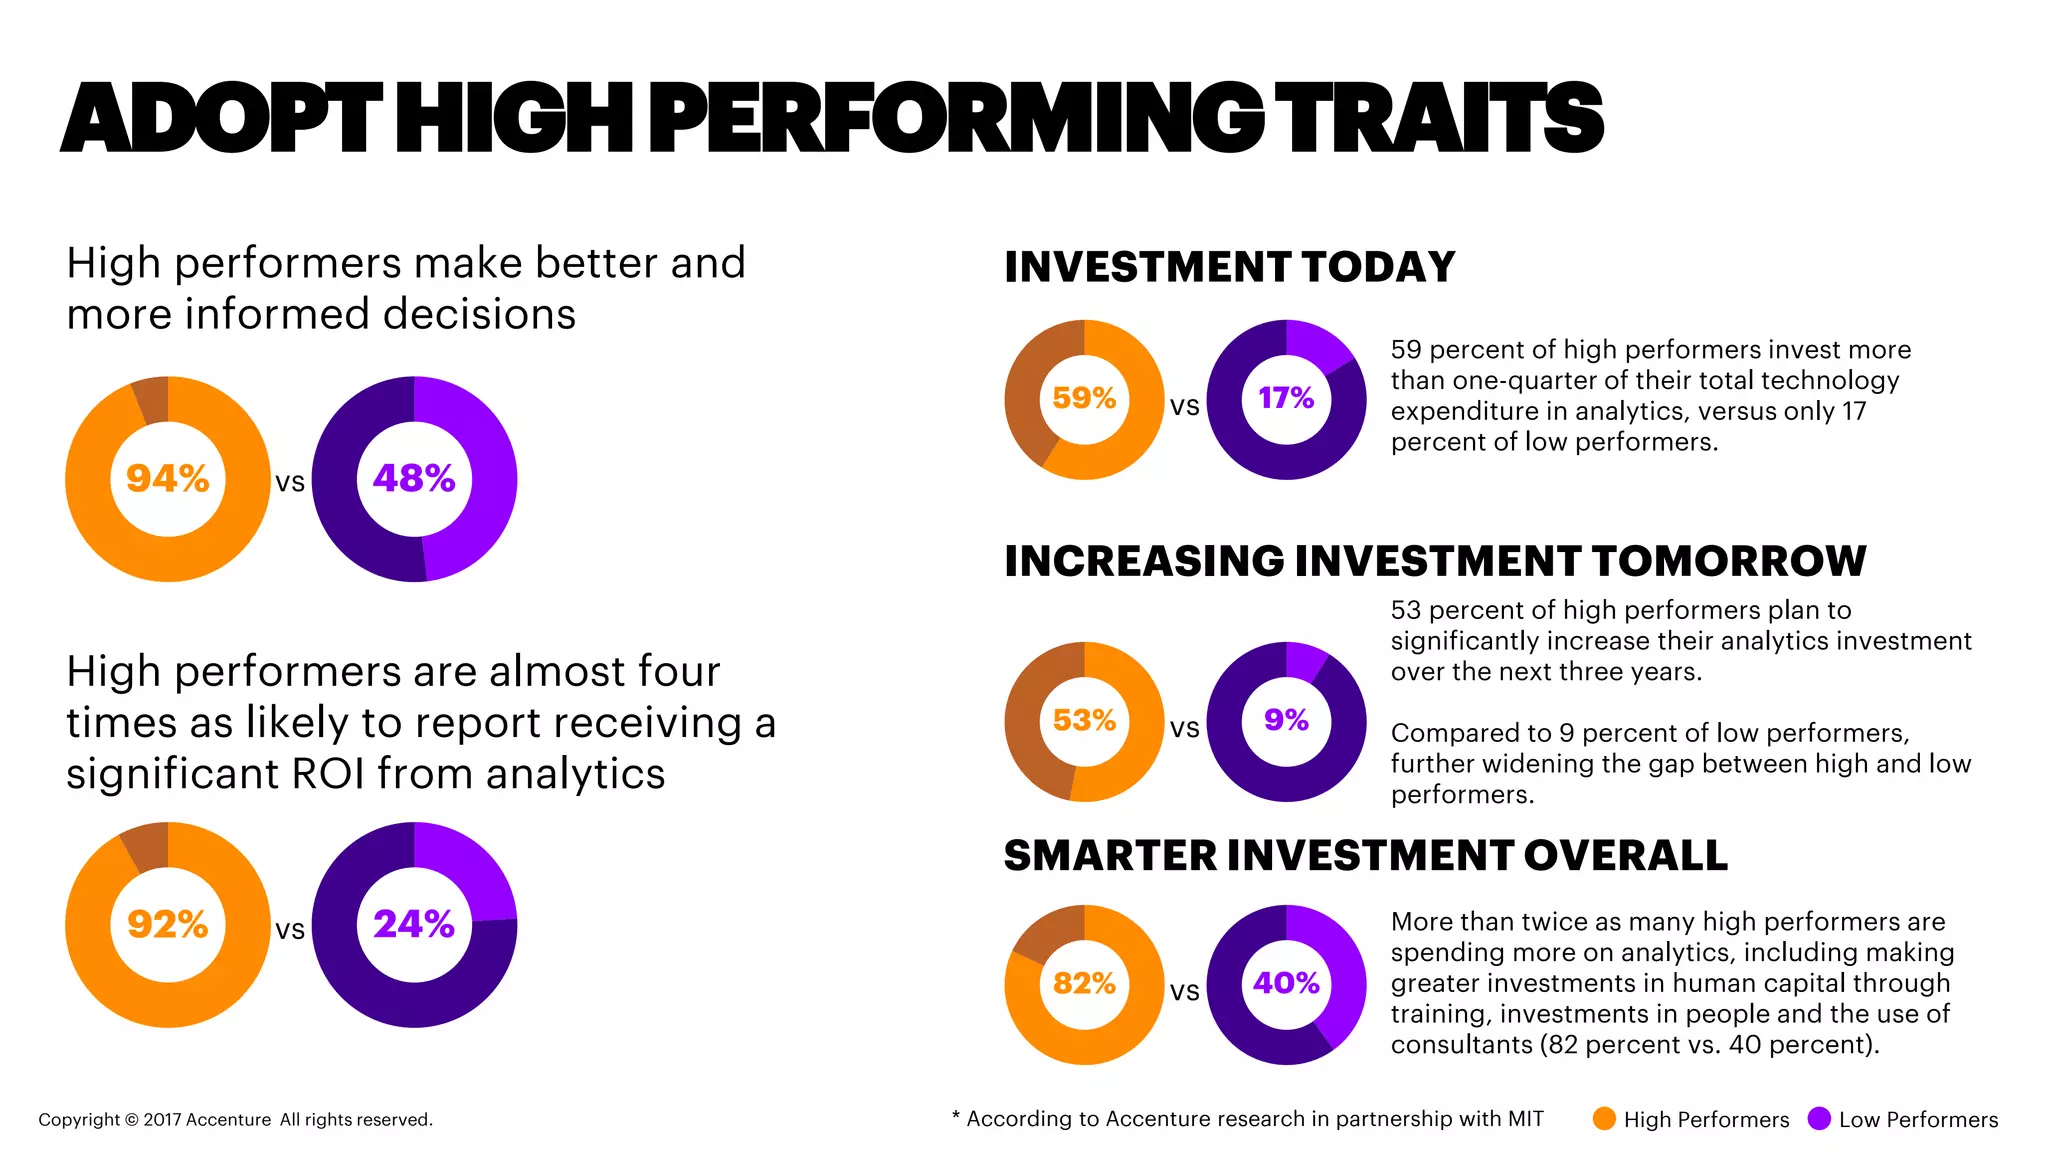
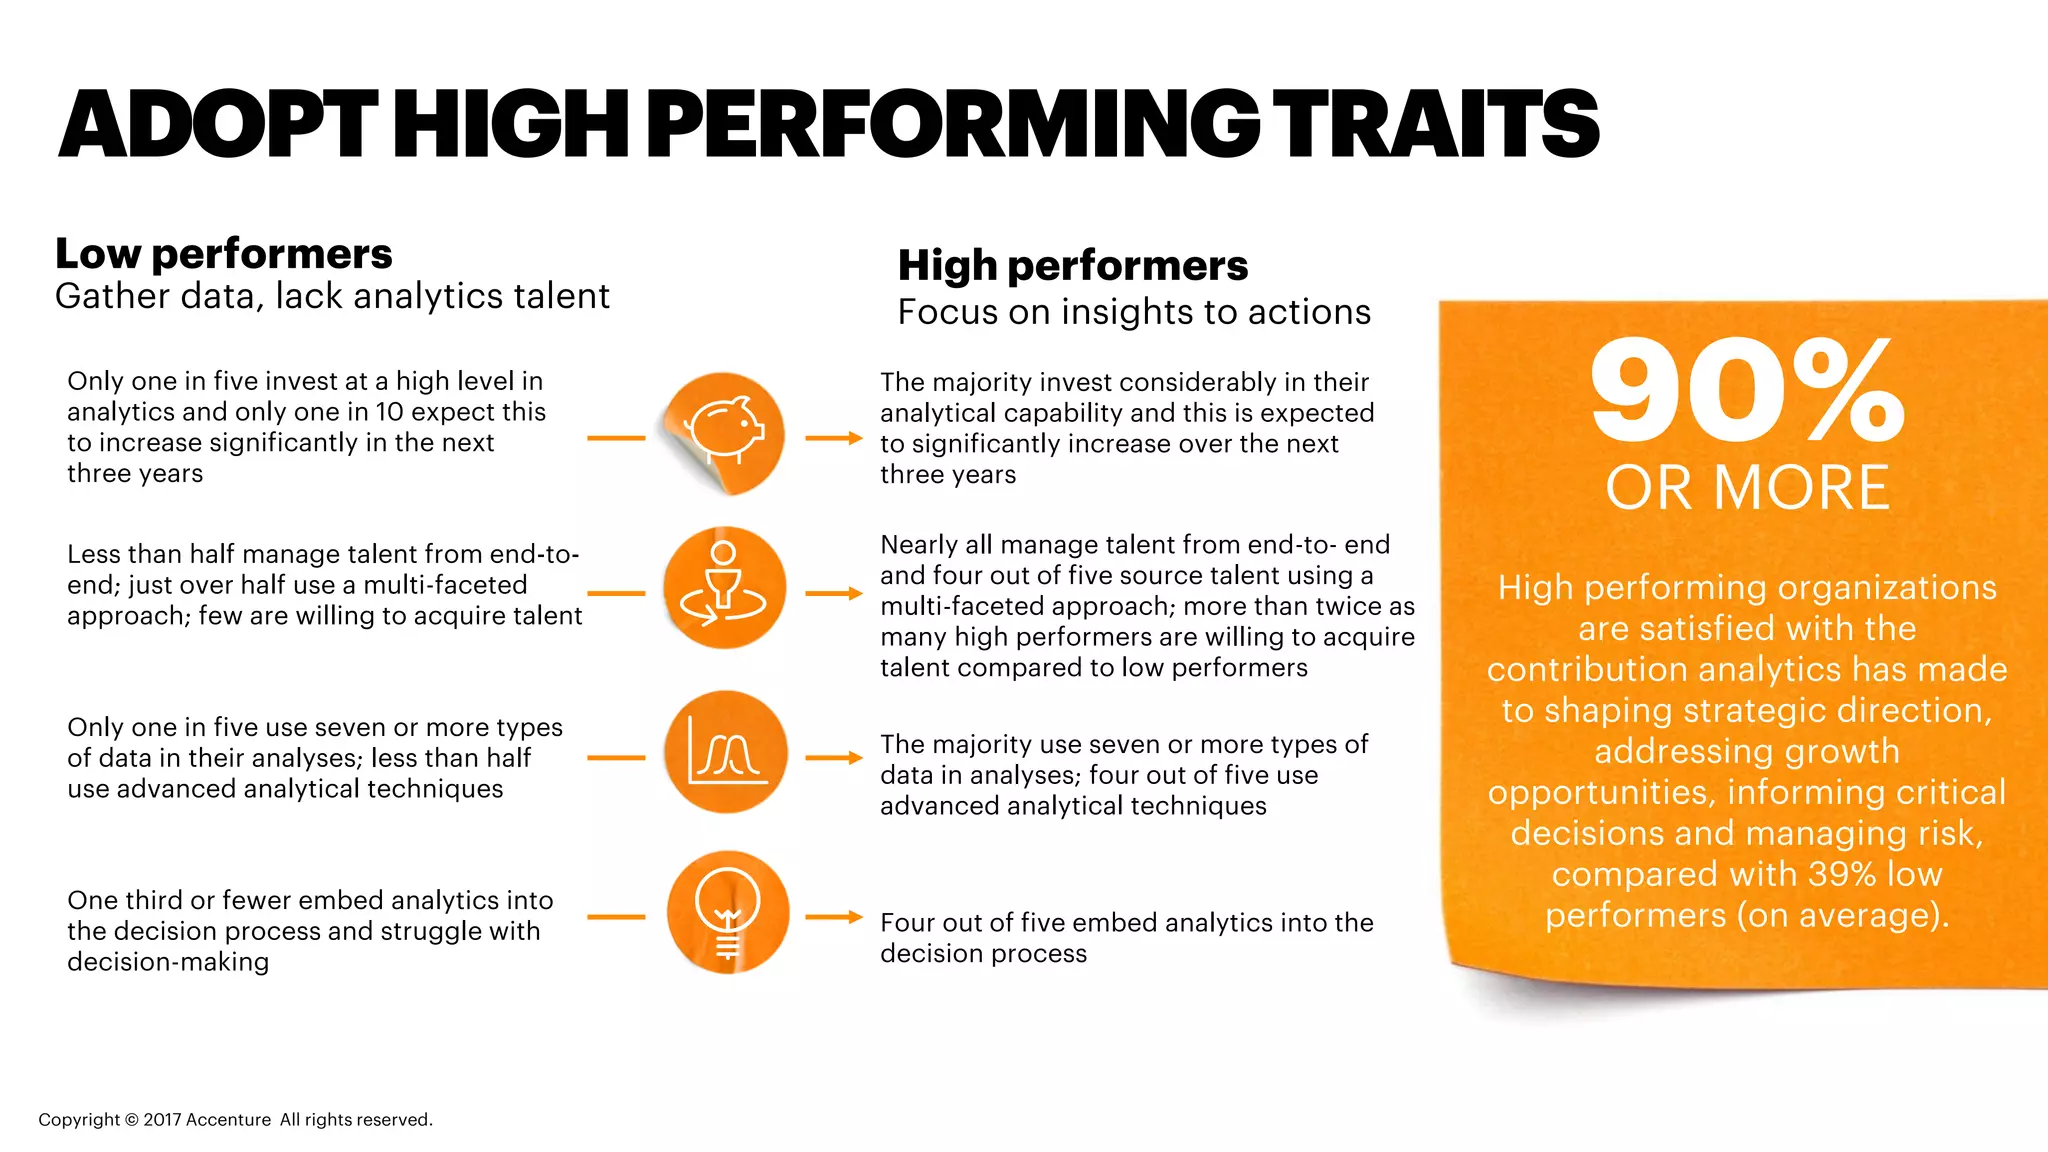
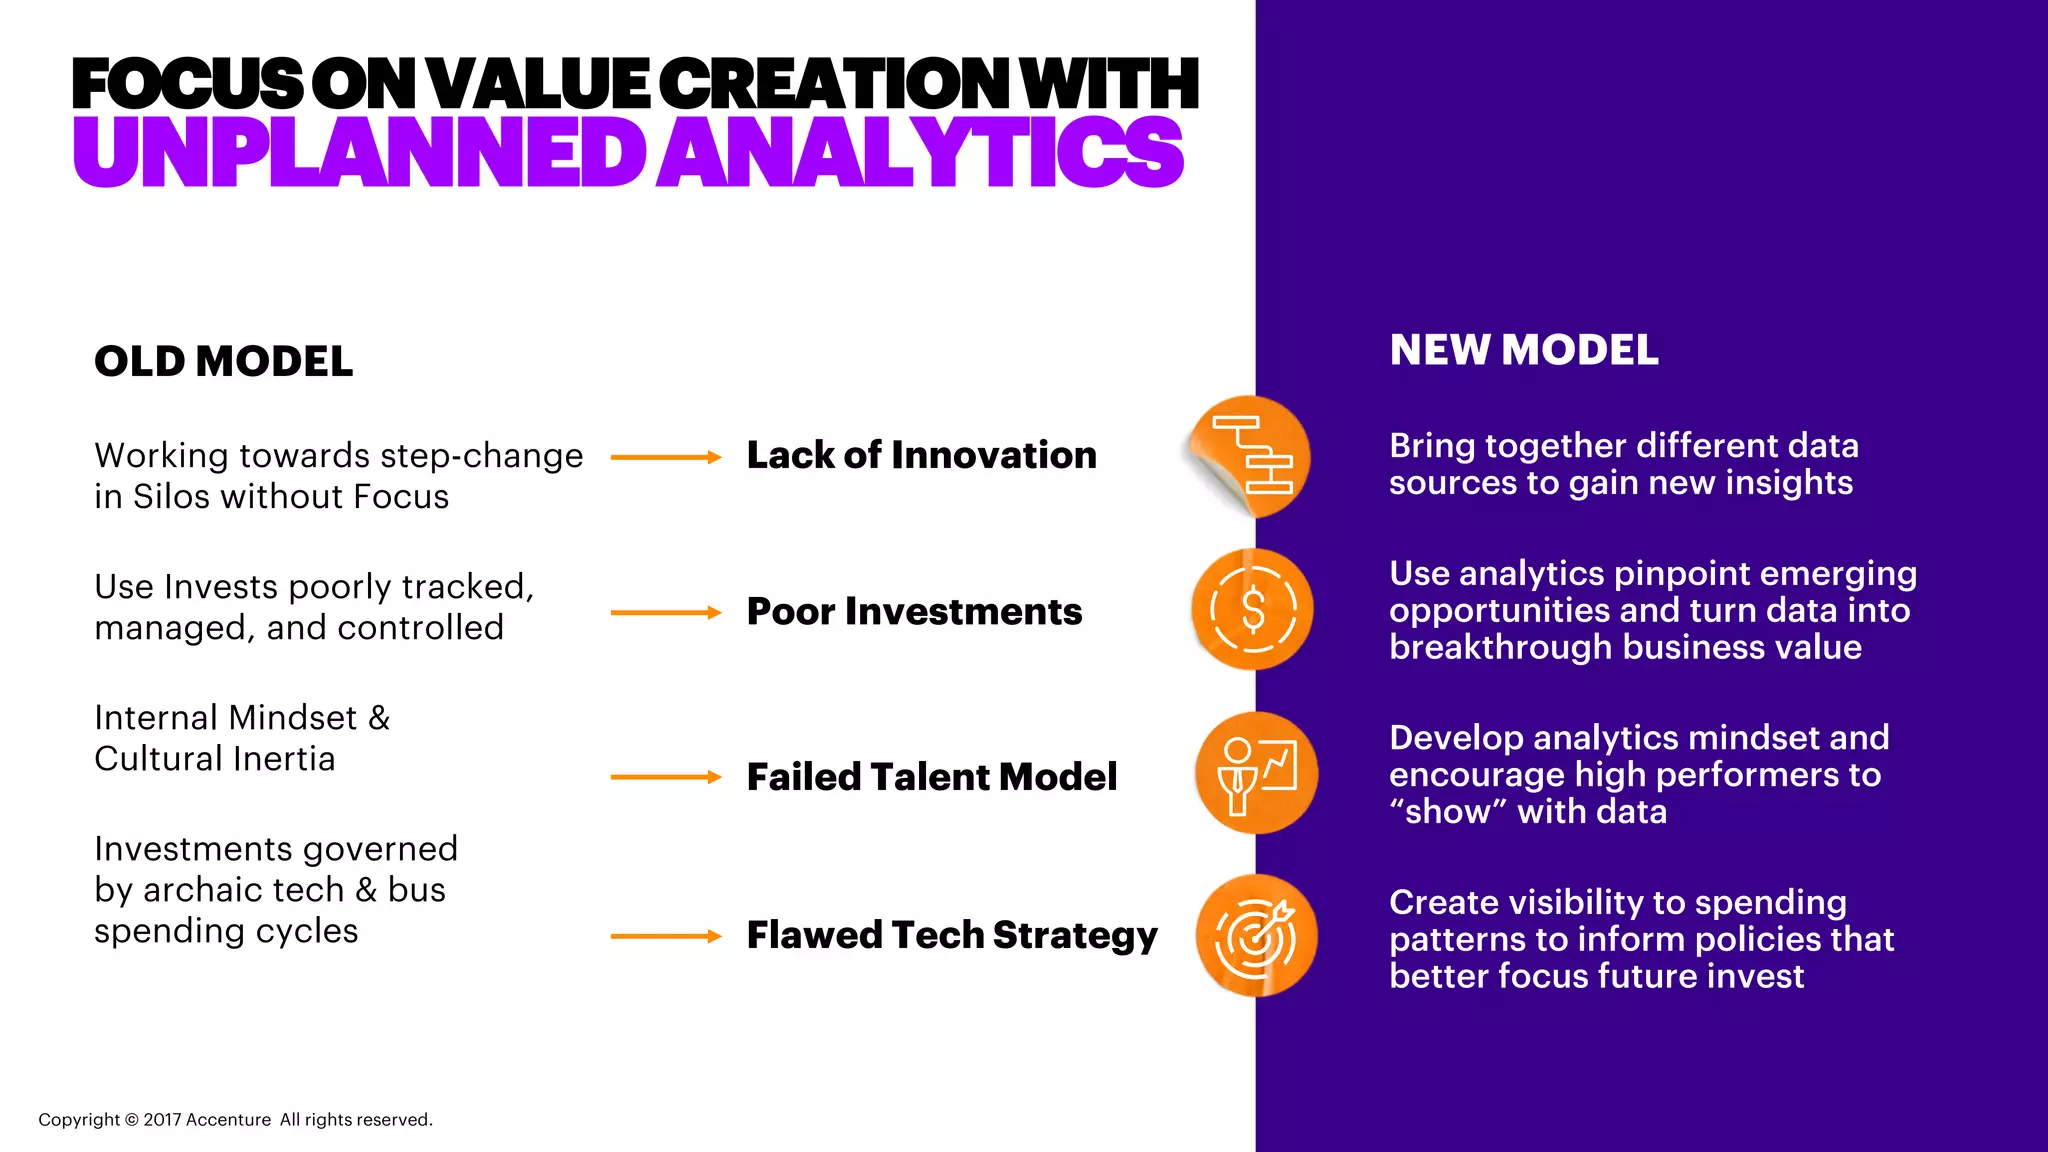
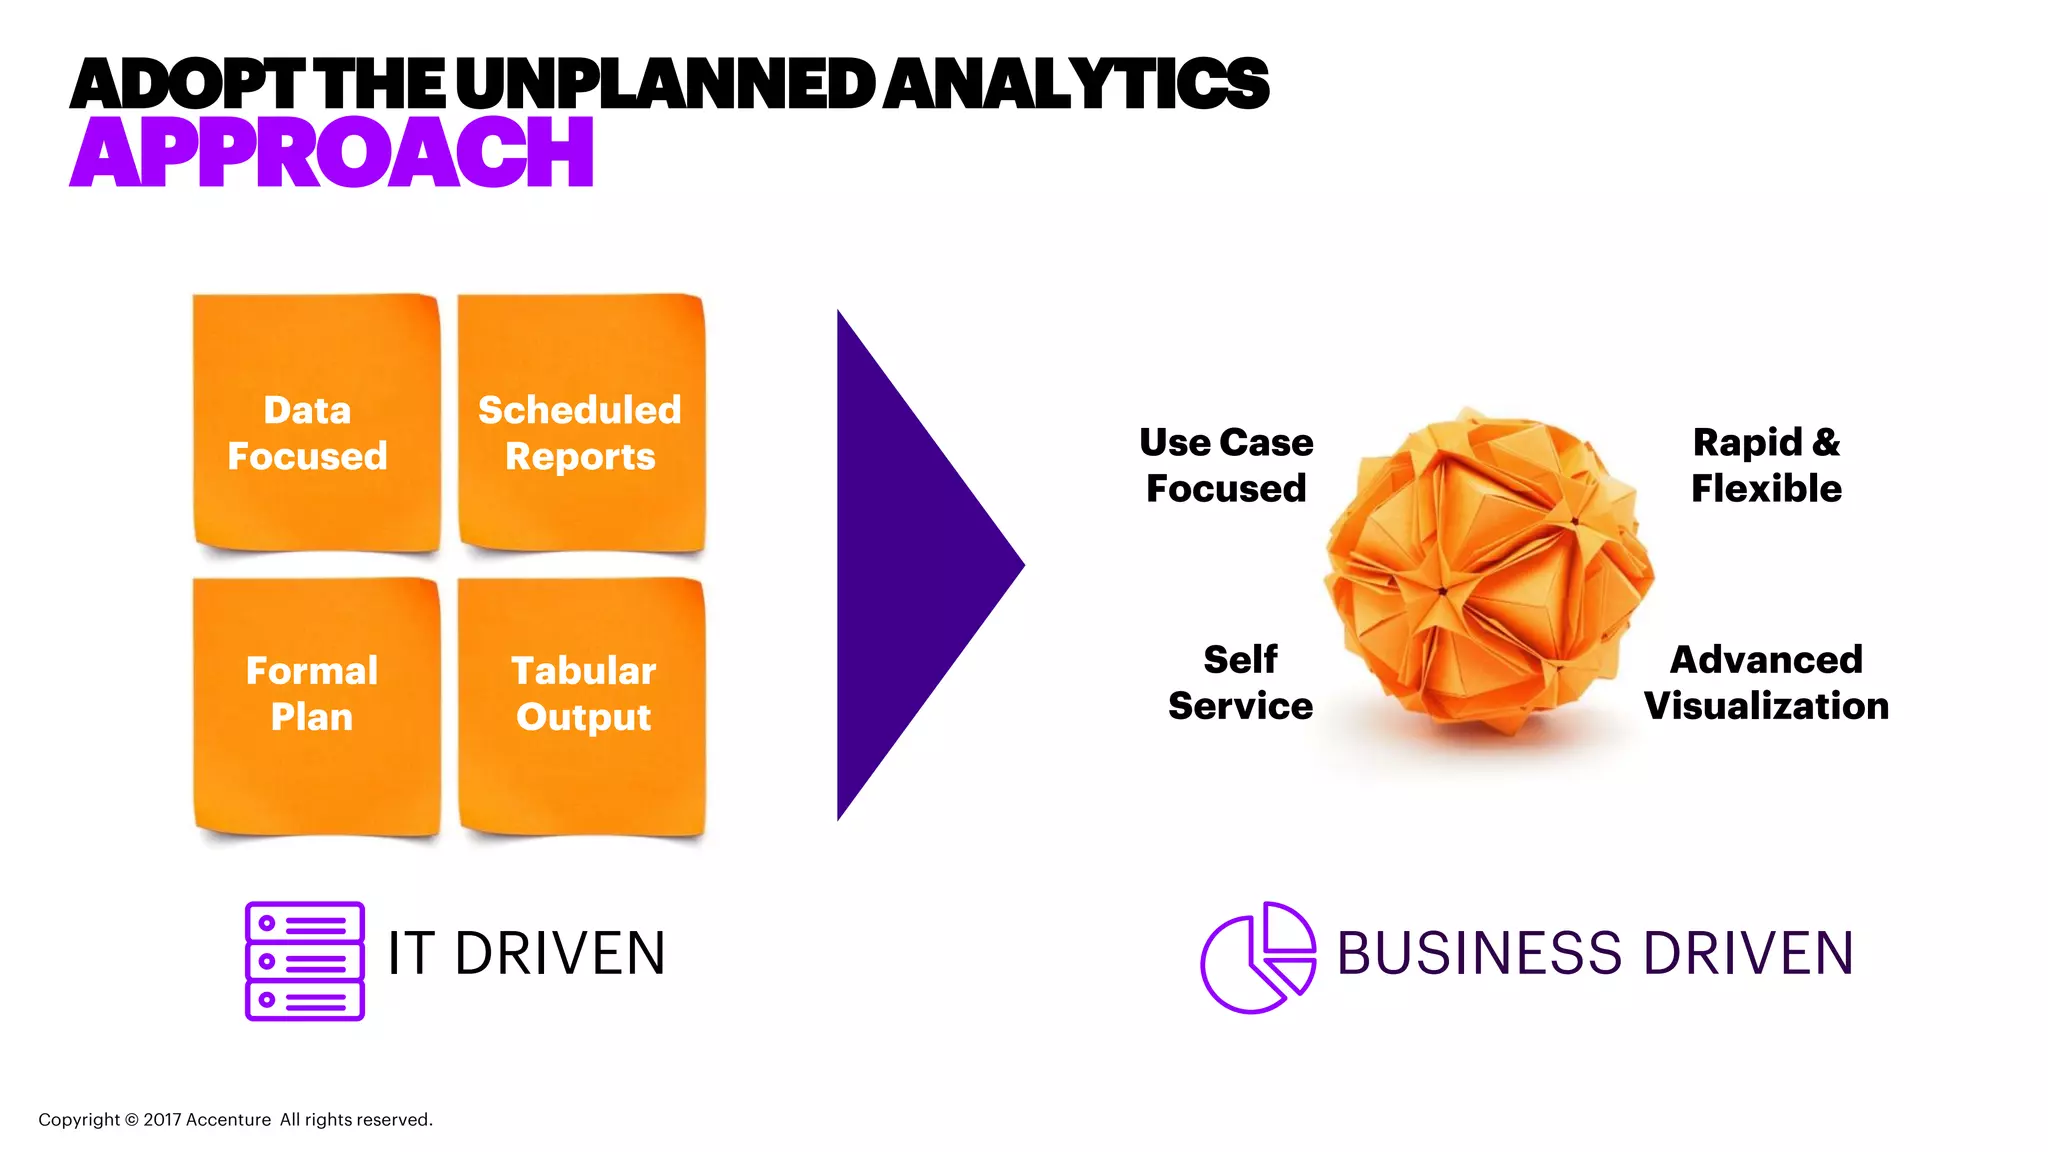
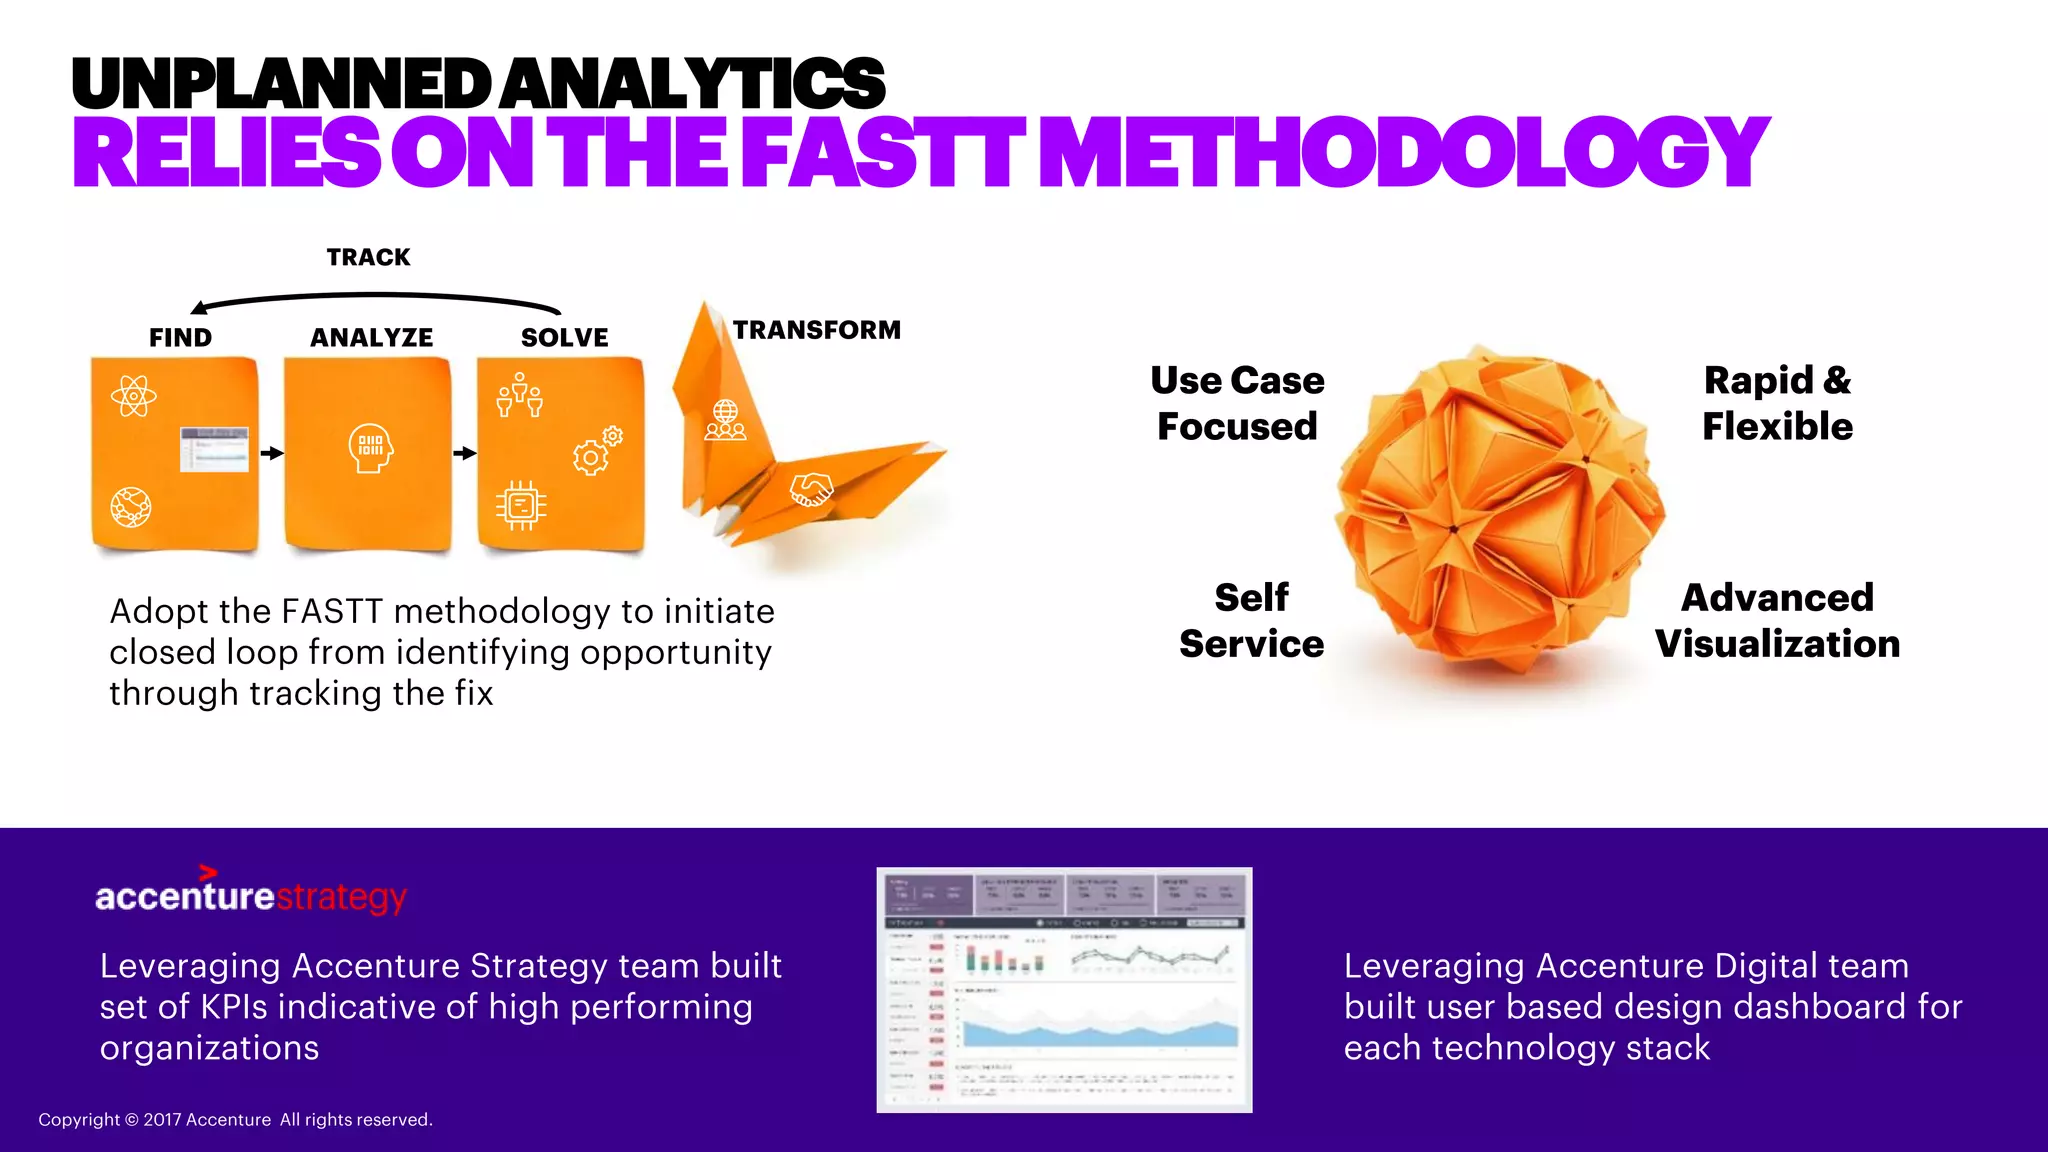
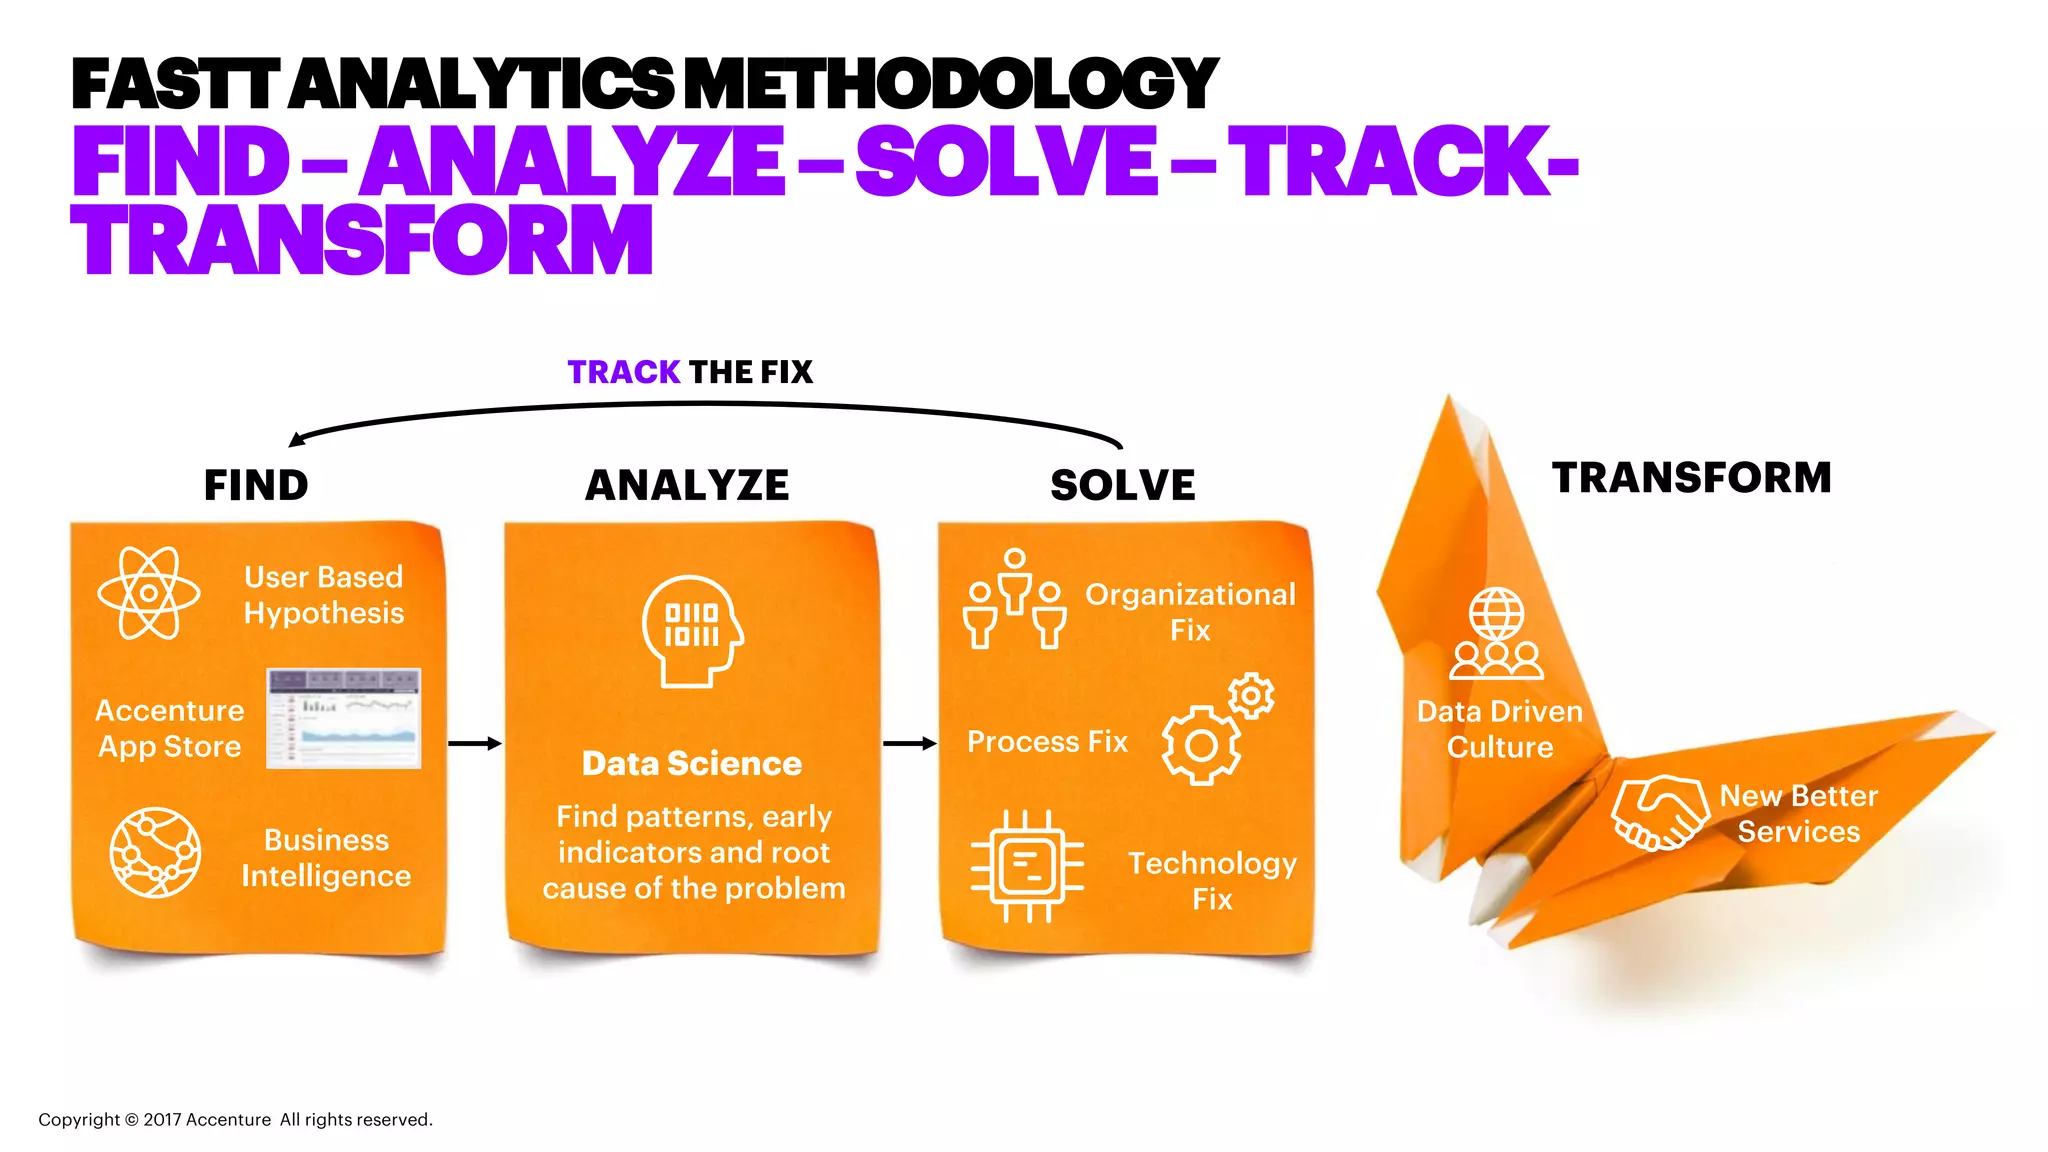
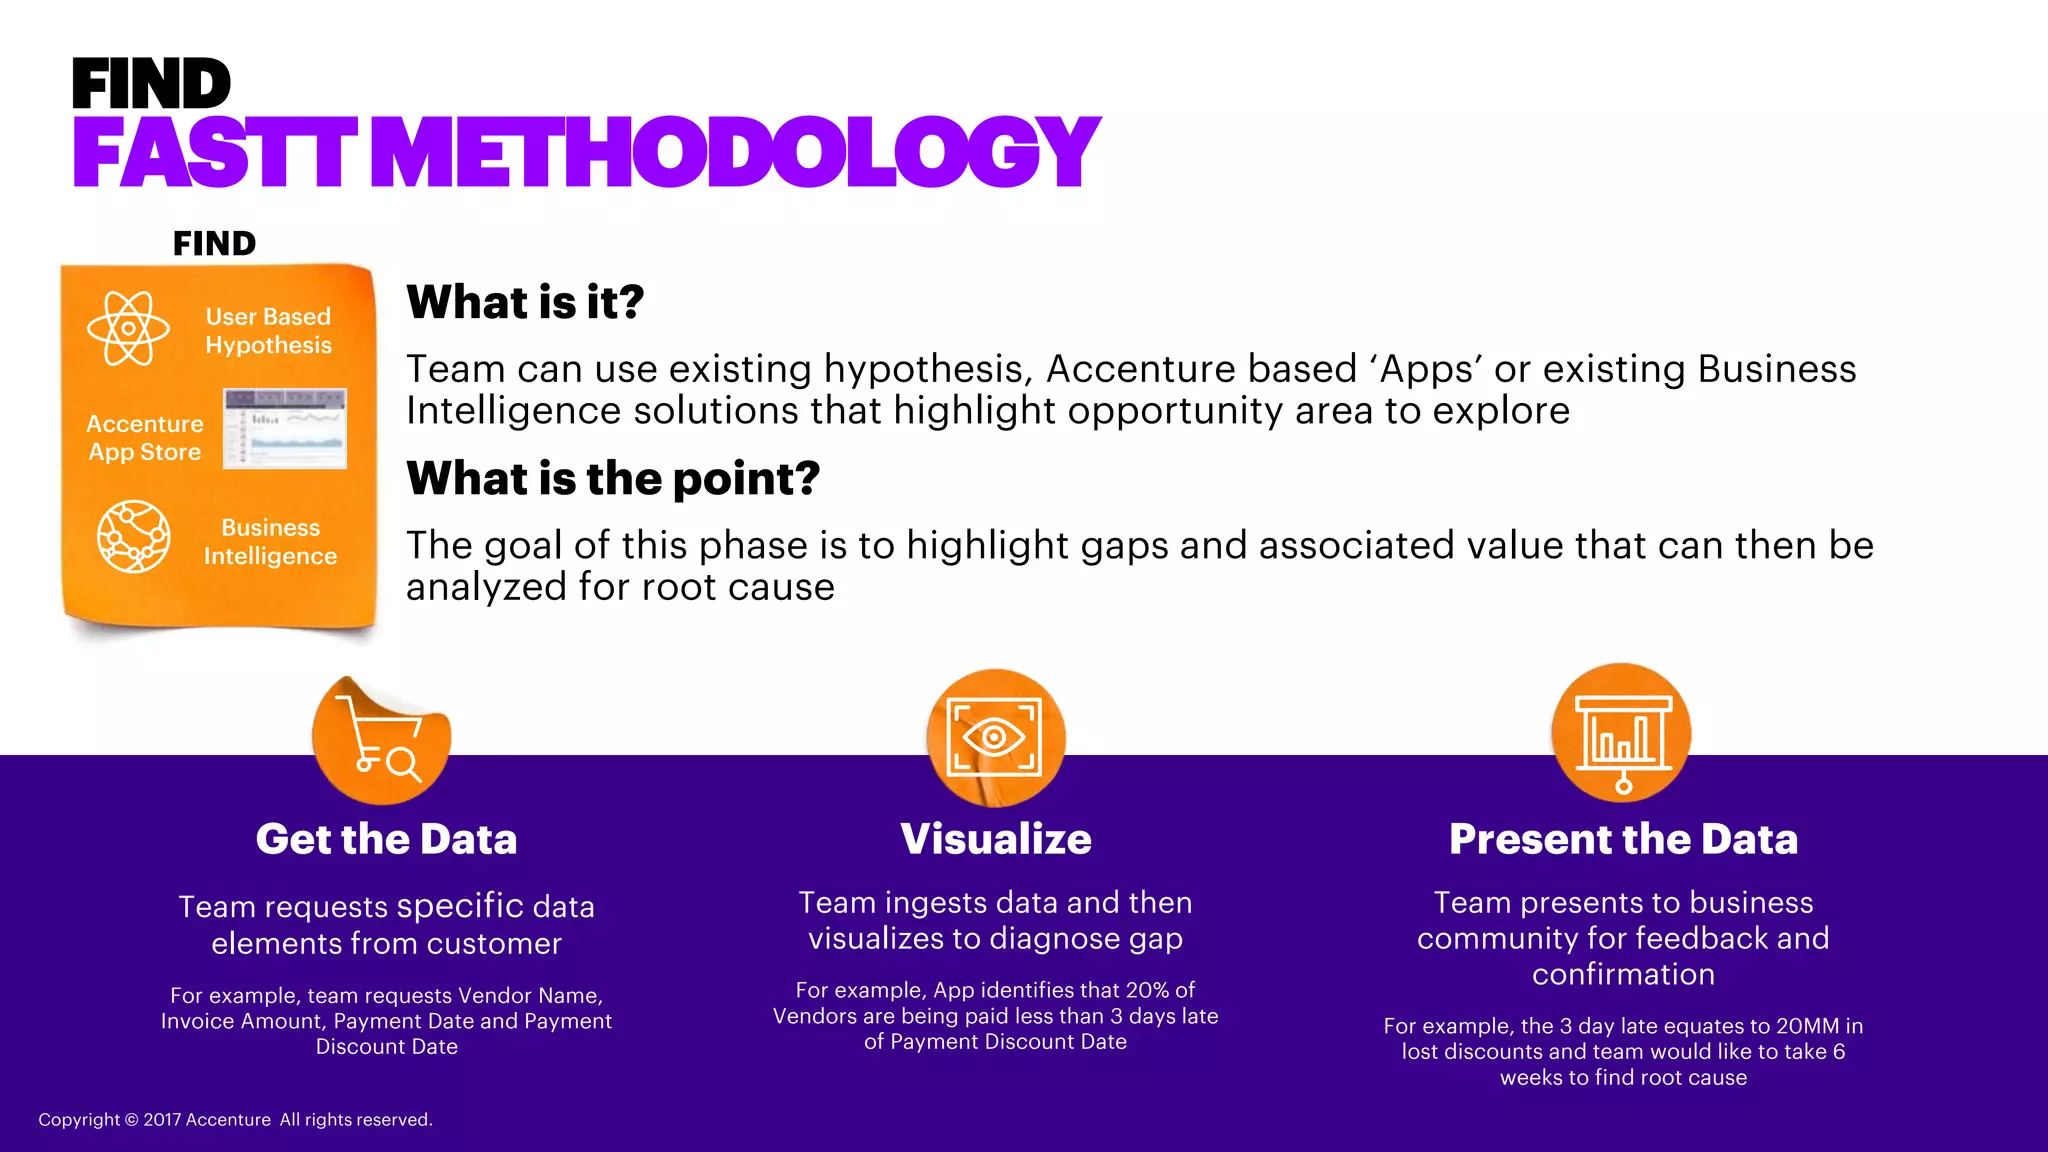
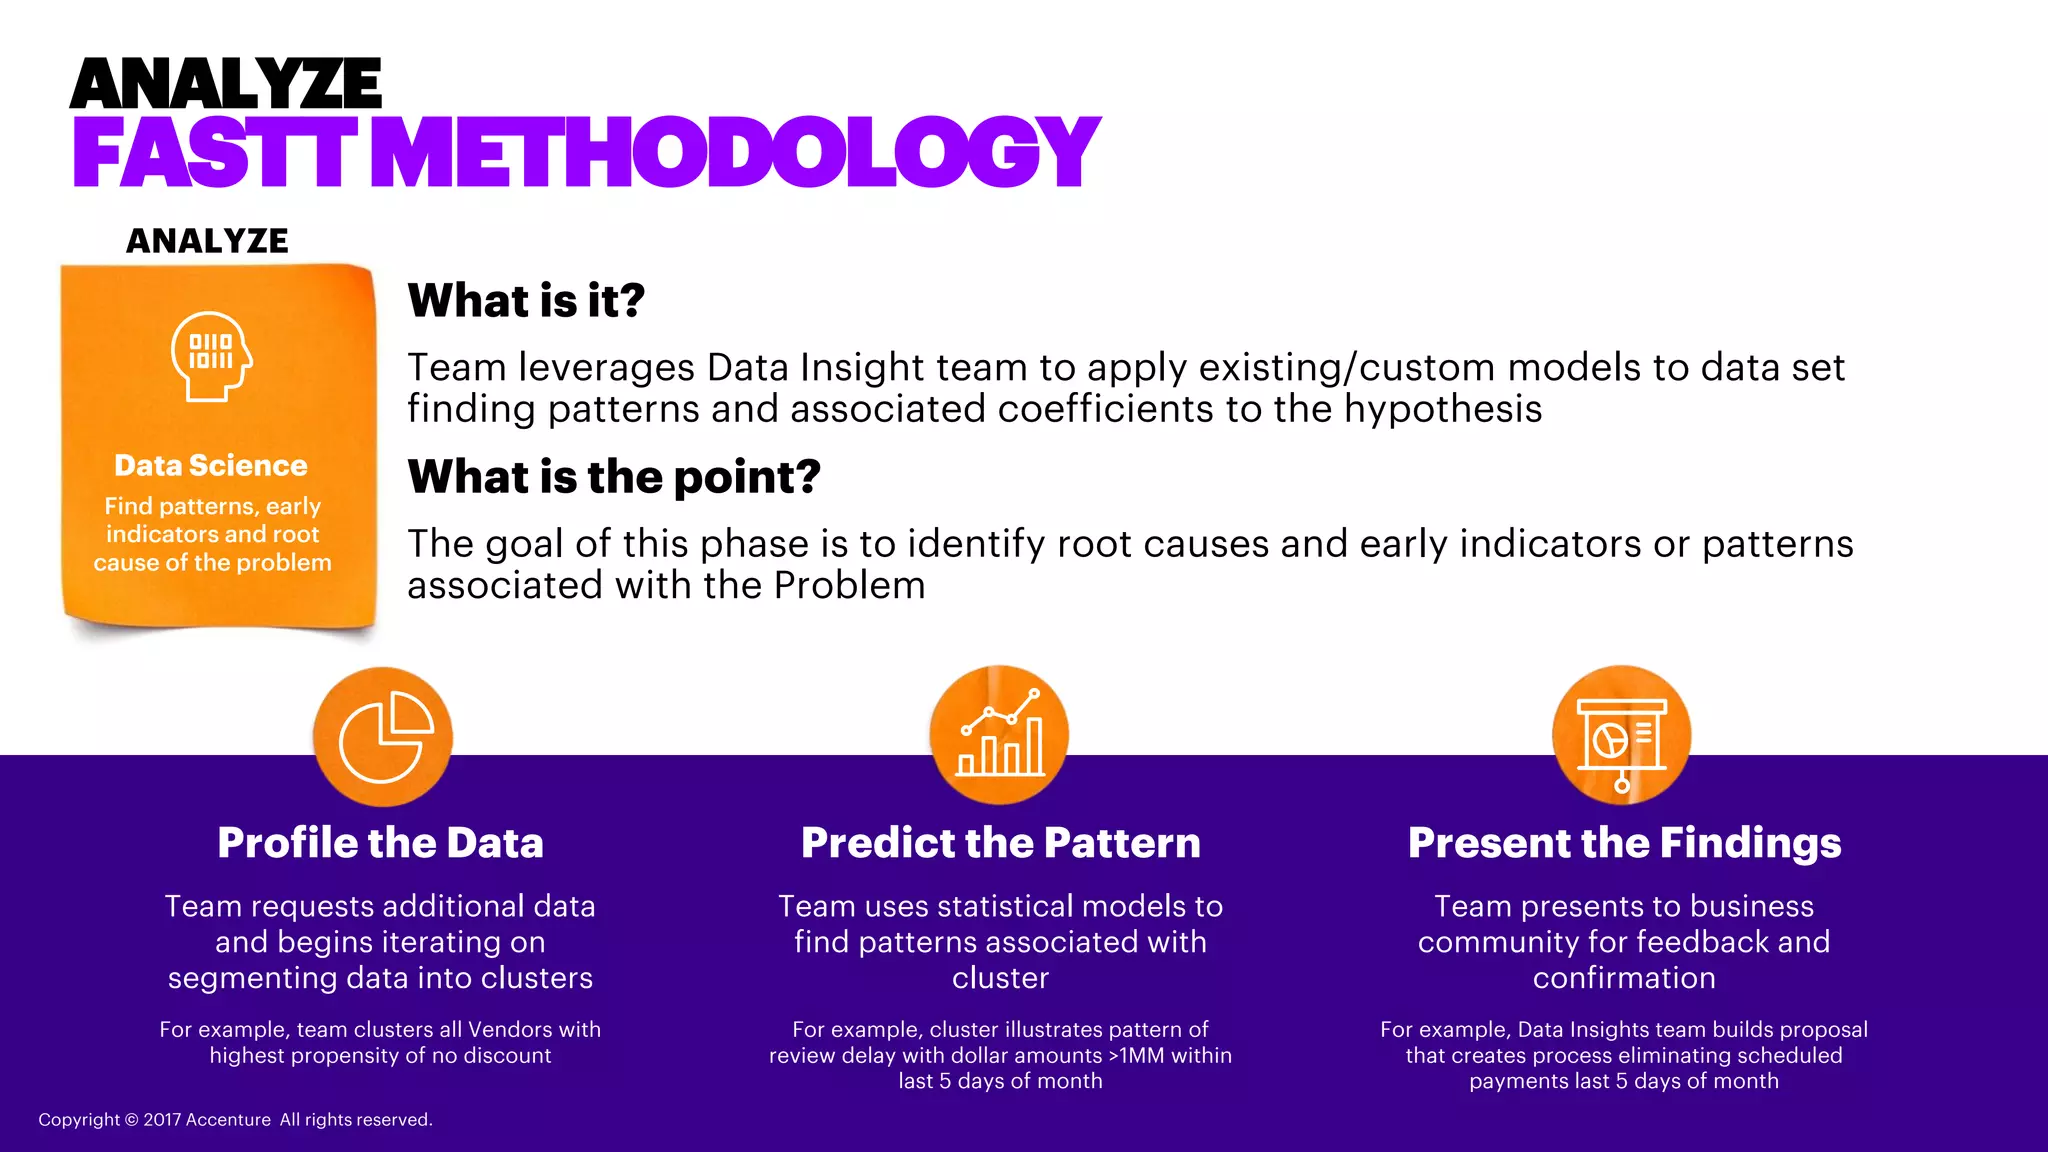
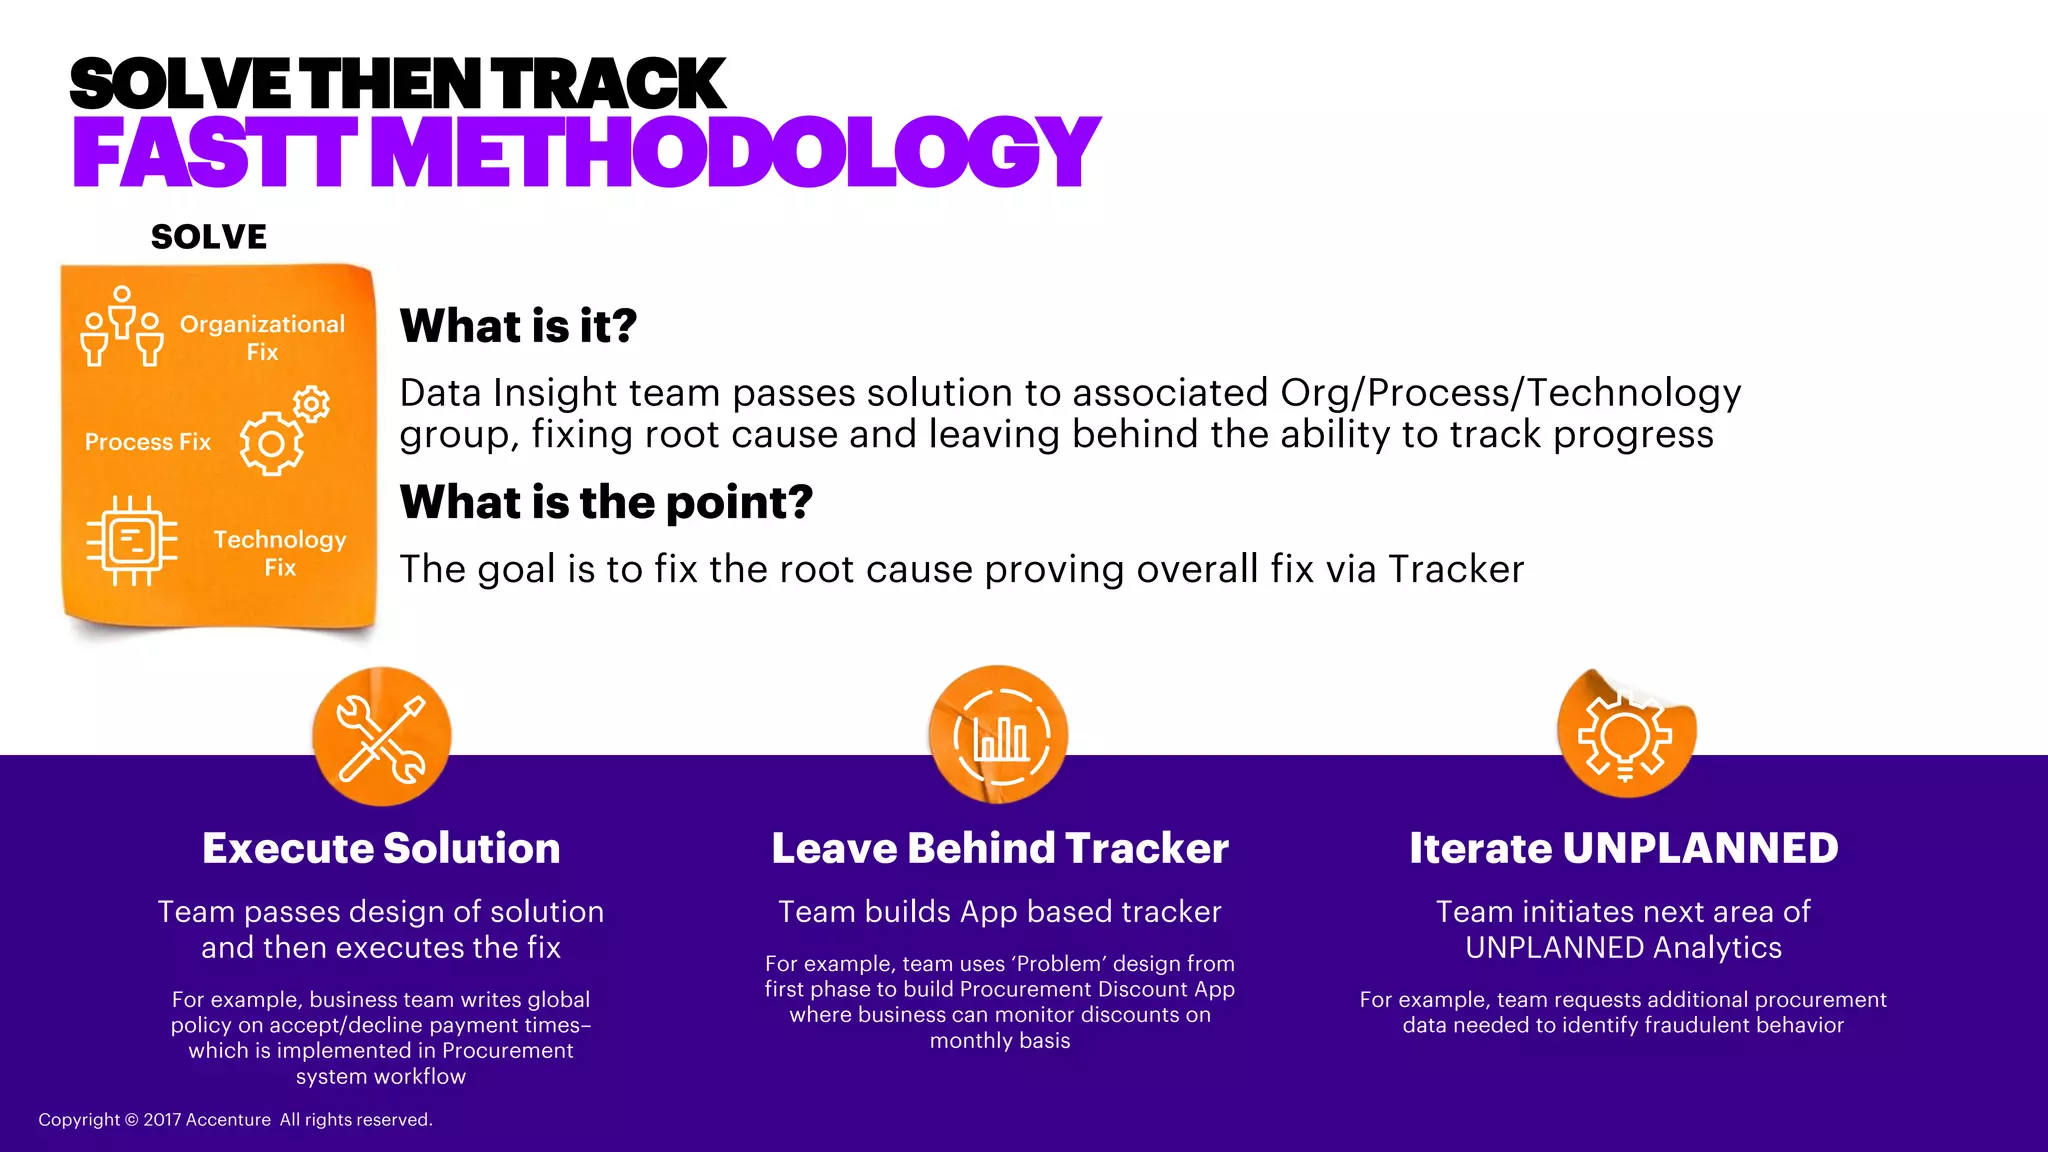
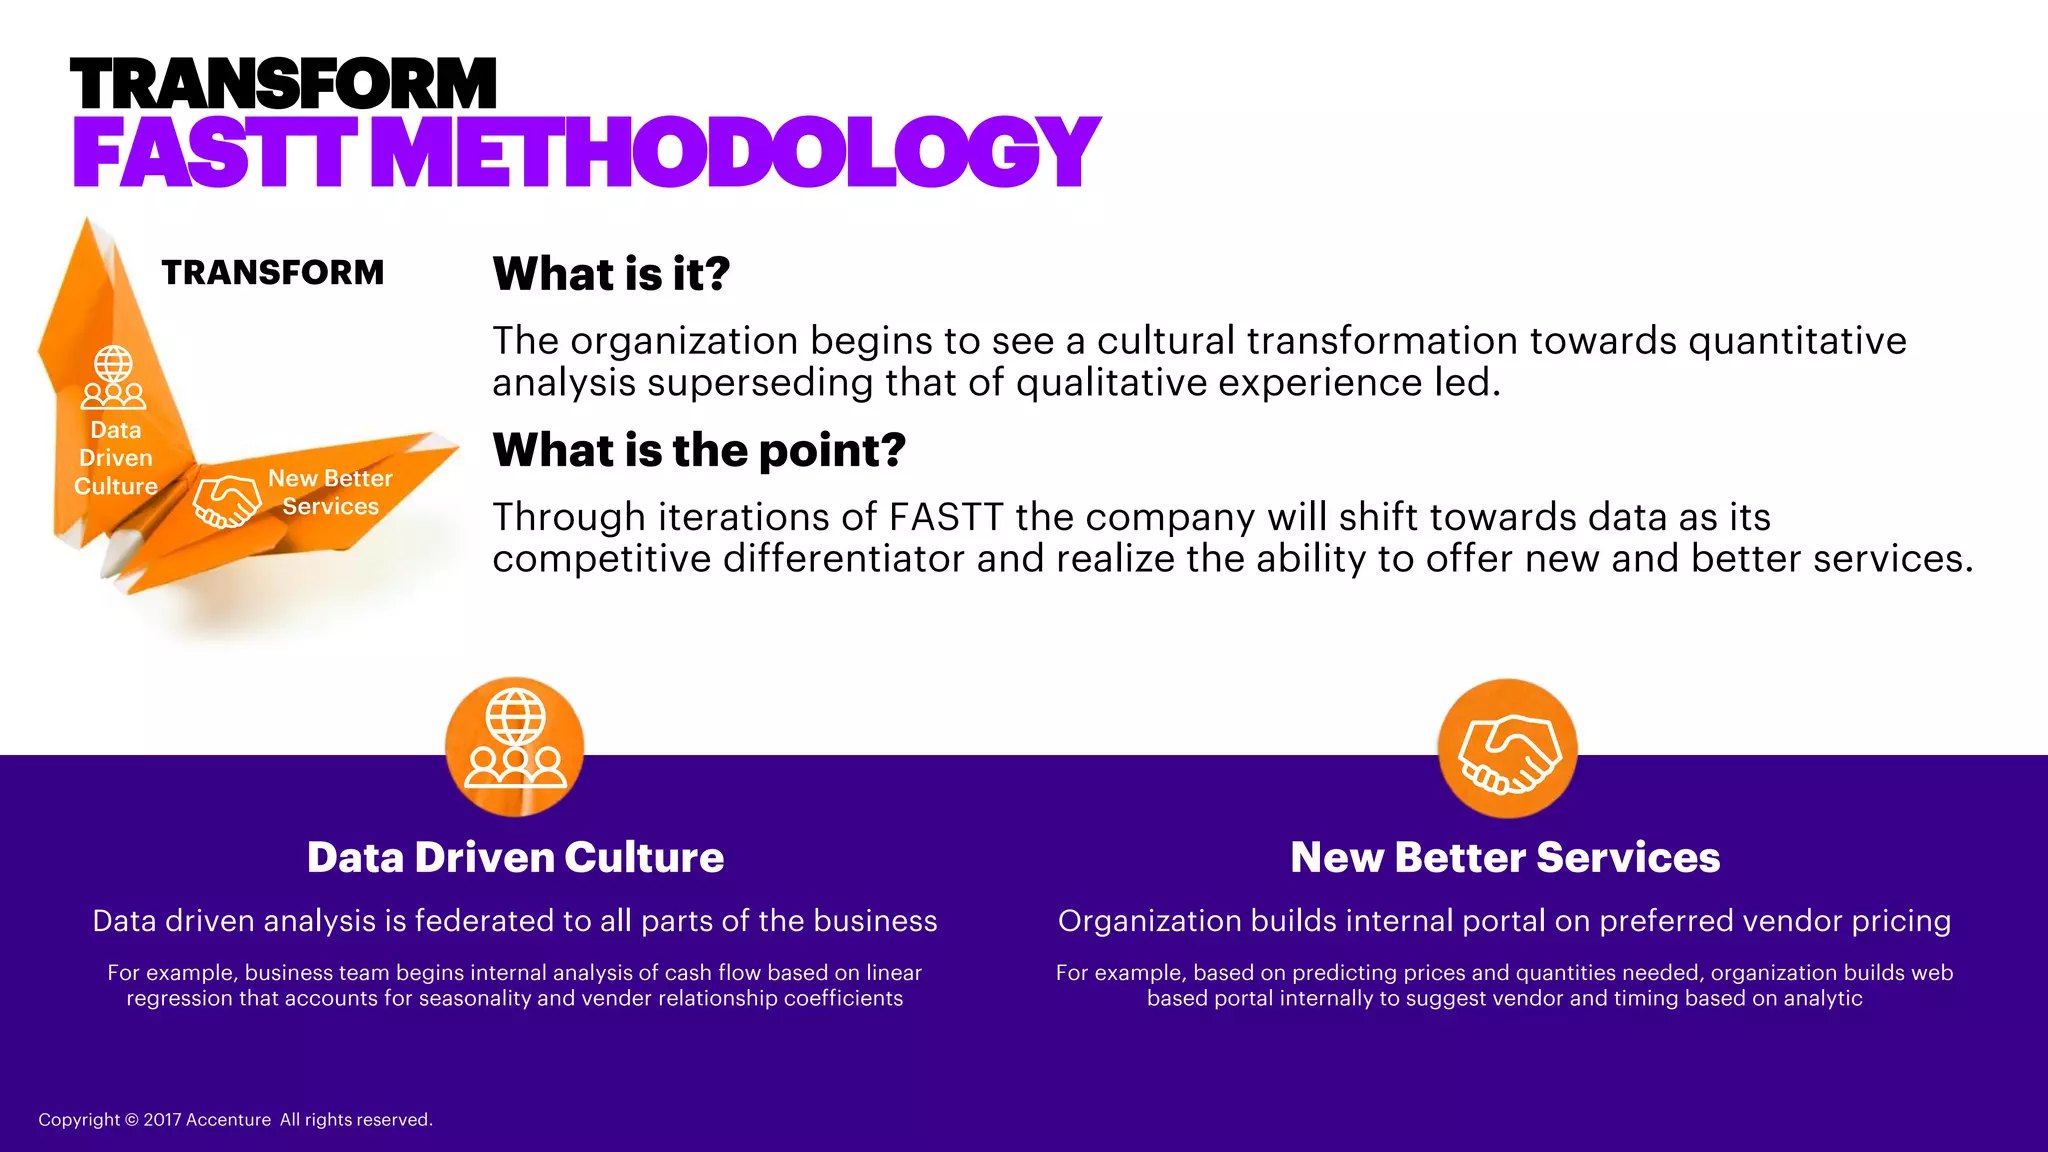
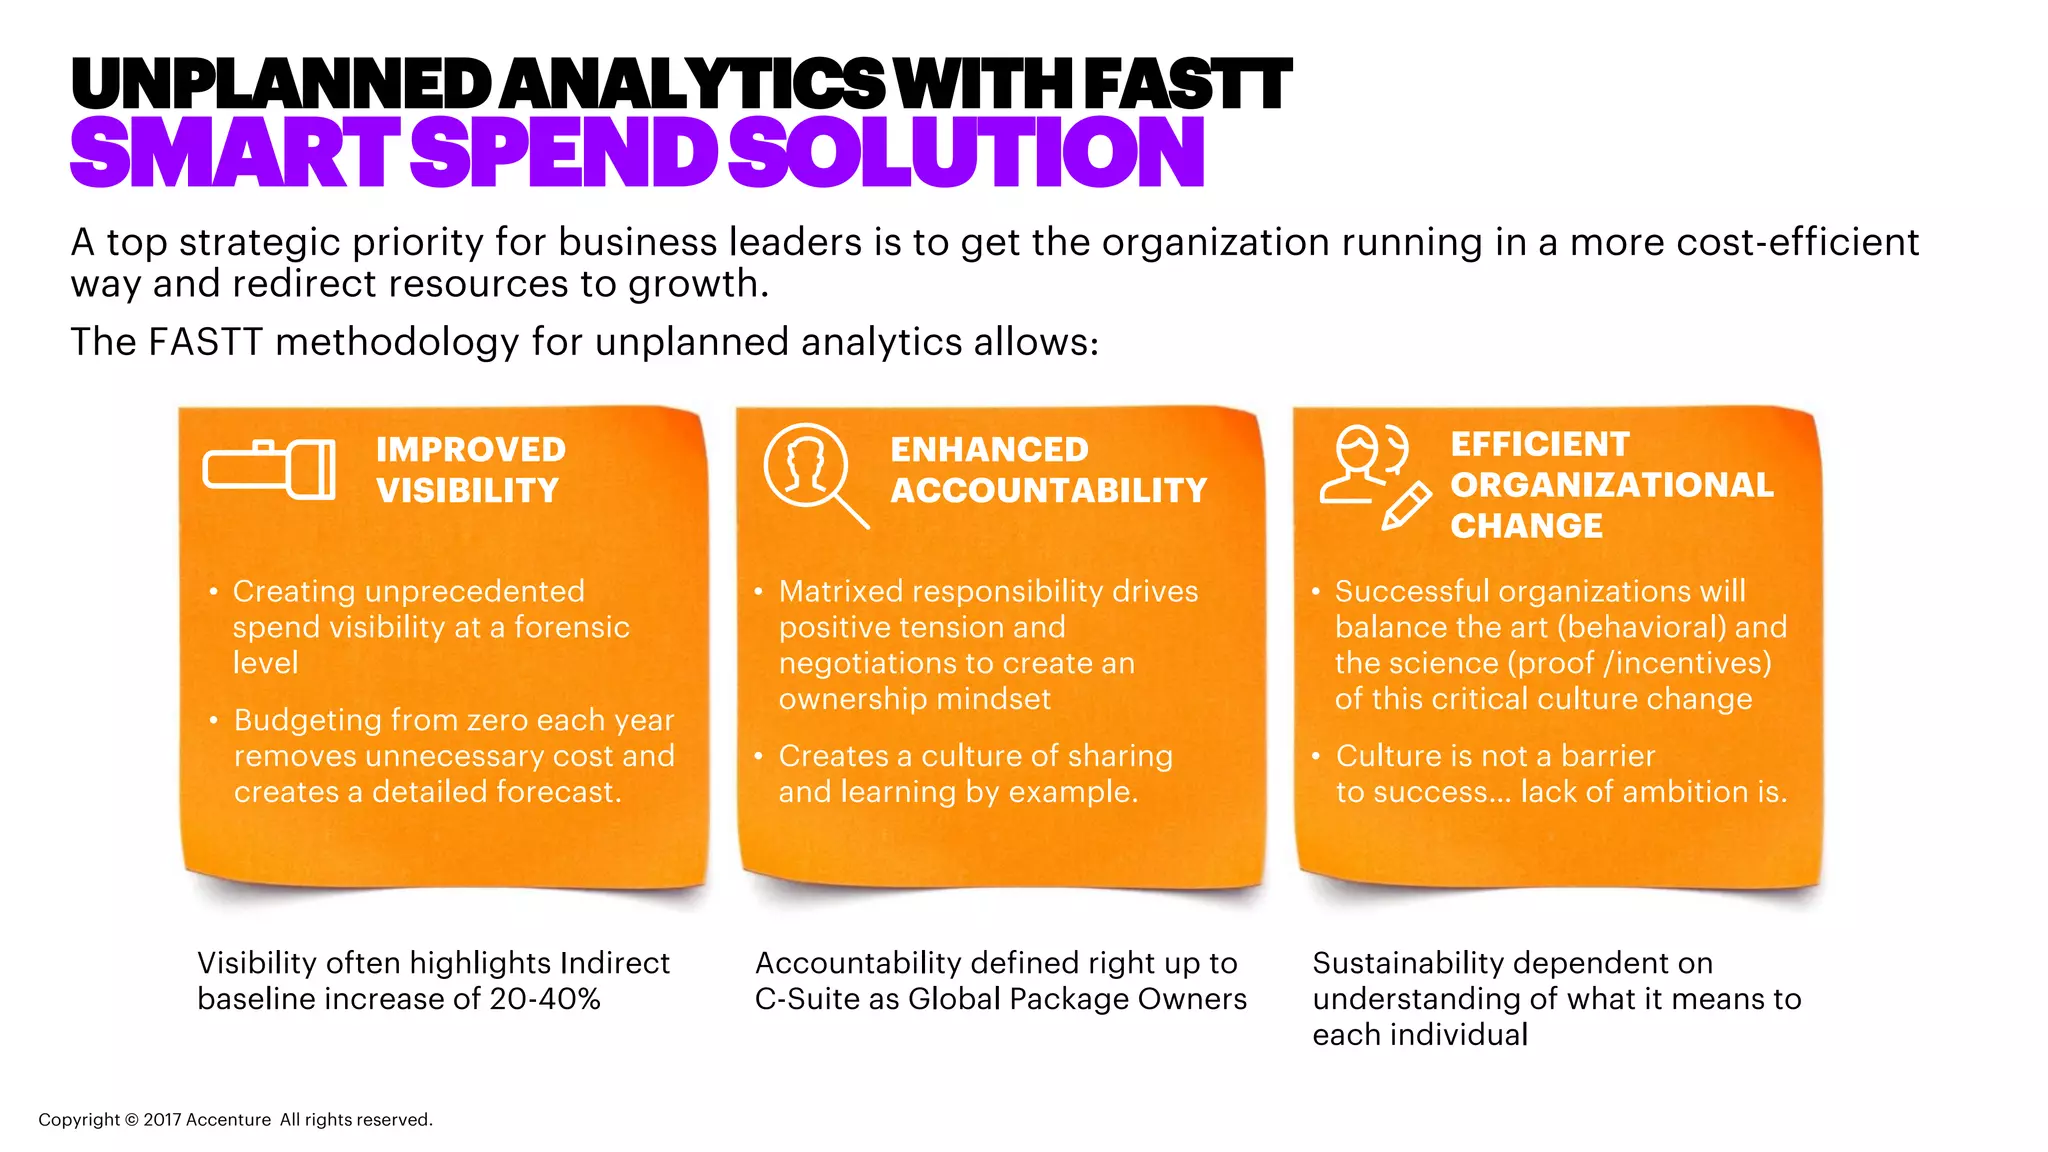
UNPLANNED
ANALYTICS-LED
TRANSFORMATION
AVOID BECOMING
IRRELEVANT
FAST FACTS:
• Since 2000, 52% of the names on the
Fortune 500 list are gone, either as a
result of mergers, acquisitions or
bankruptcies.
• Only 5 percent of the companies are
leaders in proactively adjusting to digital
disruption while 30% of organizations
don’t want to change at all.
• In 1960, the average age of a company
on the S&P 500 was 60 years old. By
2020, the average age will be 12.
THE FORTUNE 500 LIST
IS NOW IRRELEVANT
Copyright © 2017 Accenture All rights reserved.
FOCUS ONANALYTICS
Data Analytics Adopters Brave Obstacles (Vincent Ryan), CFO Magazine, March 3, 2017
“When the insight from data analytics suggests different findings to the commonly held views,
there is a tendency to reject the analytics and use them selectively when it supports the views”,
one respondent said about her organization.
Systems/technology
Time constraints
Talent/skills
Corporate culture
Training
Finance processes
Organization structure
Data governance
Leadership support
None
34.6%
27.7%
27.0%
24.5%
23.9%
22.6%
22.6%
20.8%
16.4%
15.1%
What obstacles prevent your finance function
from having a highly effective data analytics
program?
Notes: Multiple responses allowed.
Yes
No
Don't know
What obstacles prevent your finance function
currently seen as having a highly effective data
analytics program?
43.2%
43.7%
13.1%
The least-valuable uses of data analytics
can be “time wasted gathering data that
wasn’t ultimately necessary or relevant,” as
one respondent indicated, or “getting bogged
down in the details of the data and taking too
long to make a decision based on data,”
according to another.
When asked what the least valuable use of
data analytics seen in their organization, one
executive cited as useless the “’old school’
operations reports that analyze and report
historical performance and trends.” Other
examples included annual planning and
recreating legacy reports.
Copyright © 2017 Accenture All rights reserved.
ADOPT HIGH PERFORMING TRAITS
* According to Accenture research in partnership with MIT
INVESTMENT TODAYHigh performers make better and
more informed decisions
High performers are almost four times
as likely to report receiving a
significant ROI from analytics
INCREASING INVESTMENT TOMORROW
SMARTER INVESTMENT OVERALL
59 percent of high performers invest more than
one-quarter of their total technology expenditure
in analytics, versus only 17 percent of low
performers.
53 percent of high performers plan to significantly
increase their analytics investment over the next
three years.
Compared to 9 percent of low performers, further
widening the gap between high and low performers.
More than twice as many high performers are
spending more on analytics, including making
greater investments in human capital through
training, investments in people and the use of
consultants (82 percent vs. 40 percent).
94% 48%
92% 24%
vs
vs
59% 17%vs
82% 40%vs
53% 9%vs
High Performers Low PerformersCopyright © 2017 Accenture All rights reserved.
ADOPT HIGH PERFORMING TRAITS
Low performers
Gather data, lack analytics talent
High performers
Focus on insights to actions
Only one in five invest at a high level in
analytics and only one in 10 expect this to
increase significantly in the next three
years
Less than half manage talent from end-to-
end; just over half use a multi-faceted
approach; few are willing to acquire talent
Only one in five use seven or more types of
data in their analyses; less than half use
advanced analytical techniques
One third or fewer embed analytics into the
decision process and struggle with
decision-making
The majority invest considerably in their
analytical capability and this is expected to
significantly increase over the next three
years
Nearly all manage talent from end-to- end and
four out of five source talent using a multi-
faceted approach; more than twice as many
high performers are willing to acquire talent
compared to low performers
The majority use seven or more types of data
in analyses; four out of five use advanced
analytical techniques
Four out of five embed analytics into the
decision process
90%OR MORE
High performing organizations are
satisfied with the contribution
analytics has made to shaping
strategic direction, addressing
growth opportunities, informing
critical decisions and managing
risk, compared with 39% low
performers (on average).
Copyright © 2017 Accenture All rights reserved.
FOCUS ON VALUE CREATION WITH
UNPLANNEDANALYTICS
NEW MODEL
Bring together different data sources
to gain new insights
Use analytics pinpoint emerging
opportunities and turn data into
breakthrough business value
Develop analytics mindset and
encourage high performers to “show”
with data
Create visibility to spending patterns
to inform policies that better focus
future invest
OLD MODEL
Working towards step-change in
Silos without Focus
Use Invests poorly tracked,
managed, and controlled
Internal Mindset &
Cultural Inertia
Investments governed
by archaic tech & bus
spending cycles
Lack of Innovation
Poor Investments
Failed Talent Model
Flawed Tech Strategy
Copyright © 2017 Accenture All rights reserved.
Use Case
Focused
Rapid &
Flexible
Self
Service
Advanced
Visualization
IT DRIVEN BUSINESS DRIVEN
ADOPT THE UNPLANNEDANALYTICS
APPROACH
Data
Focused
Scheduled
Reports
Formal
Plan
Tabular
Output
Copyright © 2017 Accenture All rights reserved.
Use Case
Focused
Rapid &
Flexible
Self
Service
Advanced
Visualization
Leveraging Accenture Strategy team built set of
KPIs indicative of high performing organizations
Leveraging Accenture Digital team built
user based design dashboard for each
technology stack
UNPLANNEDANALYTICS
RELIES ON THE FASTT METHODOLOGY
Copyright © 2017 Accenture All rights reserved.
ANALYZEFIND SOLVE TRANSFORM
Adopt the FASTT methodology to initiate closed
loop from identifying opportunity through tracking
the fix
TRACK
FASTTANALYTICS METHODOLOGY
FIND –ANALYZE – SOLVE – TRACK-
TRANSFORM
Copyright © 2017 Accenture All rights reserved.
TRACK THE FIX
User Based
Hypothesis
Accenture
App Store
Business
Intelligence
ANALYZEFIND SOLVE TRANSFORM
Data Science
Find patterns, early
indicators and root
cause of the problem
Organizational
Fix
Process Fix
Technology Fix
Data Driven
Culture
New Better
Services
Get the Data
Team requests specific data
elements from customer
For example, team requests Vendor Name,
Invoice Amount, Payment Date and Payment
Discount Date
Visualize
Team ingests data and then
visualizes to diagnose gap
For example, App identifies that 20% of Vendors
are being paid less than 3 days late of Payment
Discount Date
Present the Data
Team presents to business
community for feedback and
confirmation
For example, the 3 day late equates to 20MM in lost
discounts and team would like to take 6 weeks to
find root cause
FIND
FASTT METHODOLOGY
Copyright © 2017 Accenture All rights reserved.
User Based
Hypothesis
Accenture
App Store
Business
Intelligence
FIND
What is it?
Team can use existing hypothesis, Accenture based ‘Apps’ or existing Business
Intelligence solutions that highlight opportunity area to explore
What is the point?
The goal of this phase is to highlight gaps and associated value that can then be
analyzed for root cause
ANALYZE
Data Science
Find patterns, early
indicators and root
cause of the problem
What is it?
Team leverages Data Insight team to apply existing/custom models to data set finding
patterns and associated coefficients to the hypothesis
What is the point?
The goal of this phase is to identify root causes and early indicators or patterns associated
with the Problem
Profile the Data
Team requests additional data and
begins iterating on segmenting data
into clusters
For example, team clusters all Vendors with
highest propensity of no discount
Predict the Pattern
Team uses statistical models to find
patterns associated with cluster
For example, cluster illustrates pattern of review
delay with dollar amounts >1MM within last 5
days of month
Present the Findings
Team presents to business community
for feedback and confirmation
For example, Data Insights team builds proposal that
creates process eliminating scheduled payments last 5
days of month
ANALYZE
FASTT METHODOLOGY
Copyright © 2017 Accenture All rights reserved.
Execute Solution
Team passes design of solution
and then executes the fix
For example, business team writes global
policy on accept/decline payment times– which
is implemented in Procurement system
workflow
Leave Behind Tracker
Team builds App based tracker
For example, team uses ‘Problem’ design from first
phase to build Procurement Discount App where
business can monitor discounts on monthly basis
Iterate UNPLANNED
Team initiates next area of
UNPLANNED Analytics
For example, team requests additional procurement data
needed to identify fraudulent behavior
SOLVE THEN TRACK
FASTT METHODOLOGY
Copyright © 2017 Accenture All rights reserved.
SOLVE
Organizational
Fix
Process Fix
Technology Fix
What is it?
Data Insight team passes solution to associated Org/Process/Technology group,
fixing root cause and leaving behind the ability to track progress
What is the point?
The goal is to fix the root cause proving overall fix via Tracker
TRANSFORM
Data
Driven
Culture New Better
Services
What is it?
The organization begins to see a cultural transformation towards quantitative analysis
superseding that of qualitative experience led.
What is the point?
Through iterations of FASTT the company will shift towards data as its competitive
differentiator and realize the ability to offer new and better services.
Data Driven Culture
Data driven analysis is federated to all parts of the business
For example, business team begins internal analysis of cash flow based on linear regression
that accounts for seasonality and vender relationship coefficients
New Better Services
Organization builds internal portal on preferred vendor pricing
For example, based on predicting prices and quantities needed, organization builds web based
portal internally to suggest vendor and timing based on analytic
TRANSFORM
FASTT METHODOLOGY
Copyright © 2017 Accenture All rights reserved.
A top strategic priority for business leaders is to get the organization running in a more cost-efficient way and
redirect resources to growth.
The FASTT methodology for unplanned analytics allows:
• Creating unprecedented spend
visibility at a forensic level
• Budgeting from zero each year
removes unnecessary cost and
creates a detailed forecast.
• Matrixed responsibility drives
positive tension and negotiations
to create an ownership mindset
• Creates a culture of sharing and
learning by example.
• Successful organizations will
balance the art (behavioral) and
the science (proof /incentives) of
this critical culture change
• Culture is not a barrier
to success… lack of ambition is.
IMPROVED
VISIBILITY
ENHANCED
ACCOUNTABILITY
EFFICIENT
ORGANIZATIONAL
CHANGE
Visibility often highlights Indirect
baseline increase of 20-40%
Accountability defined right up to C-
Suite as Global Package Owners
Sustainability dependent on
understanding of what it means to each
individual
UNPLANNEDANALYTICS WITH FASTT
SMART SPEND SOLUTION
Copyright © 2017 Accenture All rights reserved.
FOR MORE INFORATION
TERRY HEMKEN
Managing Director,
Accenture Analytics Insights Service
ABOUT ACCENTURE
Accenture is a leading global professional services organization, providing a broad range of
services and solutions in strategy, consulting, digital, technology and operations. Combining
unmatched experience and specialized skills across more than 40 industries and all business
functions—underpinned by the world’s largest delivery network—Accenture works at the
intersection of business and technology to help clients improve their performance and create
sustainable value for their stakeholders. With more than 411,000 people serving clients in more
than 120 countries, Accenture drives innovation to improve the way the world works and lives.
Visit us at www.accenture.com.
Copyright © 2017 Accenture
All rights reserved.
Accenture, its logo, and
High Performance Delivered are
trademarks of Accenture.
LEARN MORE
www.accenture.com/us-en/service-accenture-analytics-insights-
services

Unplanned analytics-led transformation

  • 1.
  • 2.
    AVOID BECOMING IRRELEVANT FAST FACTS: •Since 2000, 52% of the names on the Fortune 500 list are gone, either as a result of mergers, acquisitions or bankruptcies. • Only 5 percent of the companies are leaders in proactively adjusting to digital disruption while 30% of organizations don’t want to change at all. • In 1960, the average age of a company on the S&P 500 was 60 years old. By 2020, the average age will be 12. THE FORTUNE 500 LIST IS NOW IRRELEVANT Copyright © 2017 Accenture All rights reserved.
  • 3.
    FOCUS ONANALYTICS Data AnalyticsAdopters Brave Obstacles (Vincent Ryan), CFO Magazine, March 3, 2017 “When the insight from data analytics suggests different findings to the commonly held views, there is a tendency to reject the analytics and use them selectively when it supports the views”, one respondent said about her organization. Systems/technology Time constraints Talent/skills Corporate culture Training Finance processes Organization structure Data governance Leadership support None 34.6% 27.7% 27.0% 24.5% 23.9% 22.6% 22.6% 20.8% 16.4% 15.1% What obstacles prevent your finance function from having a highly effective data analytics program? Notes: Multiple responses allowed. Yes No Don't know What obstacles prevent your finance function currently seen as having a highly effective data analytics program? 43.2% 43.7% 13.1% The least-valuable uses of data analytics can be “time wasted gathering data that wasn’t ultimately necessary or relevant,” as one respondent indicated, or “getting bogged down in the details of the data and taking too long to make a decision based on data,” according to another. When asked what the least valuable use of data analytics seen in their organization, one executive cited as useless the “’old school’ operations reports that analyze and report historical performance and trends.” Other examples included annual planning and recreating legacy reports. Copyright © 2017 Accenture All rights reserved.
  • 4.
    ADOPT HIGH PERFORMINGTRAITS * According to Accenture research in partnership with MIT INVESTMENT TODAYHigh performers make better and more informed decisions High performers are almost four times as likely to report receiving a significant ROI from analytics INCREASING INVESTMENT TOMORROW SMARTER INVESTMENT OVERALL 59 percent of high performers invest more than one-quarter of their total technology expenditure in analytics, versus only 17 percent of low performers. 53 percent of high performers plan to significantly increase their analytics investment over the next three years. Compared to 9 percent of low performers, further widening the gap between high and low performers. More than twice as many high performers are spending more on analytics, including making greater investments in human capital through training, investments in people and the use of consultants (82 percent vs. 40 percent). 94% 48% 92% 24% vs vs 59% 17%vs 82% 40%vs 53% 9%vs High Performers Low PerformersCopyright © 2017 Accenture All rights reserved.
  • 5.
    ADOPT HIGH PERFORMINGTRAITS Low performers Gather data, lack analytics talent High performers Focus on insights to actions Only one in five invest at a high level in analytics and only one in 10 expect this to increase significantly in the next three years Less than half manage talent from end-to- end; just over half use a multi-faceted approach; few are willing to acquire talent Only one in five use seven or more types of data in their analyses; less than half use advanced analytical techniques One third or fewer embed analytics into the decision process and struggle with decision-making The majority invest considerably in their analytical capability and this is expected to significantly increase over the next three years Nearly all manage talent from end-to- end and four out of five source talent using a multi- faceted approach; more than twice as many high performers are willing to acquire talent compared to low performers The majority use seven or more types of data in analyses; four out of five use advanced analytical techniques Four out of five embed analytics into the decision process 90%OR MORE High performing organizations are satisfied with the contribution analytics has made to shaping strategic direction, addressing growth opportunities, informing critical decisions and managing risk, compared with 39% low performers (on average). Copyright © 2017 Accenture All rights reserved.
  • 6.
    FOCUS ON VALUECREATION WITH UNPLANNEDANALYTICS NEW MODEL Bring together different data sources to gain new insights Use analytics pinpoint emerging opportunities and turn data into breakthrough business value Develop analytics mindset and encourage high performers to “show” with data Create visibility to spending patterns to inform policies that better focus future invest OLD MODEL Working towards step-change in Silos without Focus Use Invests poorly tracked, managed, and controlled Internal Mindset & Cultural Inertia Investments governed by archaic tech & bus spending cycles Lack of Innovation Poor Investments Failed Talent Model Flawed Tech Strategy Copyright © 2017 Accenture All rights reserved.
  • 7.
    Use Case Focused Rapid & Flexible Self Service Advanced Visualization ITDRIVEN BUSINESS DRIVEN ADOPT THE UNPLANNEDANALYTICS APPROACH Data Focused Scheduled Reports Formal Plan Tabular Output Copyright © 2017 Accenture All rights reserved.
  • 8.
    Use Case Focused Rapid & Flexible Self Service Advanced Visualization LeveragingAccenture Strategy team built set of KPIs indicative of high performing organizations Leveraging Accenture Digital team built user based design dashboard for each technology stack UNPLANNEDANALYTICS RELIES ON THE FASTT METHODOLOGY Copyright © 2017 Accenture All rights reserved. ANALYZEFIND SOLVE TRANSFORM Adopt the FASTT methodology to initiate closed loop from identifying opportunity through tracking the fix TRACK
  • 9.
    FASTTANALYTICS METHODOLOGY FIND –ANALYZE– SOLVE – TRACK- TRANSFORM Copyright © 2017 Accenture All rights reserved. TRACK THE FIX User Based Hypothesis Accenture App Store Business Intelligence ANALYZEFIND SOLVE TRANSFORM Data Science Find patterns, early indicators and root cause of the problem Organizational Fix Process Fix Technology Fix Data Driven Culture New Better Services
  • 10.
    Get the Data Teamrequests specific data elements from customer For example, team requests Vendor Name, Invoice Amount, Payment Date and Payment Discount Date Visualize Team ingests data and then visualizes to diagnose gap For example, App identifies that 20% of Vendors are being paid less than 3 days late of Payment Discount Date Present the Data Team presents to business community for feedback and confirmation For example, the 3 day late equates to 20MM in lost discounts and team would like to take 6 weeks to find root cause FIND FASTT METHODOLOGY Copyright © 2017 Accenture All rights reserved. User Based Hypothesis Accenture App Store Business Intelligence FIND What is it? Team can use existing hypothesis, Accenture based ‘Apps’ or existing Business Intelligence solutions that highlight opportunity area to explore What is the point? The goal of this phase is to highlight gaps and associated value that can then be analyzed for root cause
  • 11.
    ANALYZE Data Science Find patterns,early indicators and root cause of the problem What is it? Team leverages Data Insight team to apply existing/custom models to data set finding patterns and associated coefficients to the hypothesis What is the point? The goal of this phase is to identify root causes and early indicators or patterns associated with the Problem Profile the Data Team requests additional data and begins iterating on segmenting data into clusters For example, team clusters all Vendors with highest propensity of no discount Predict the Pattern Team uses statistical models to find patterns associated with cluster For example, cluster illustrates pattern of review delay with dollar amounts >1MM within last 5 days of month Present the Findings Team presents to business community for feedback and confirmation For example, Data Insights team builds proposal that creates process eliminating scheduled payments last 5 days of month ANALYZE FASTT METHODOLOGY Copyright © 2017 Accenture All rights reserved.
  • 12.
    Execute Solution Team passesdesign of solution and then executes the fix For example, business team writes global policy on accept/decline payment times– which is implemented in Procurement system workflow Leave Behind Tracker Team builds App based tracker For example, team uses ‘Problem’ design from first phase to build Procurement Discount App where business can monitor discounts on monthly basis Iterate UNPLANNED Team initiates next area of UNPLANNED Analytics For example, team requests additional procurement data needed to identify fraudulent behavior SOLVE THEN TRACK FASTT METHODOLOGY Copyright © 2017 Accenture All rights reserved. SOLVE Organizational Fix Process Fix Technology Fix What is it? Data Insight team passes solution to associated Org/Process/Technology group, fixing root cause and leaving behind the ability to track progress What is the point? The goal is to fix the root cause proving overall fix via Tracker
  • 13.
    TRANSFORM Data Driven Culture New Better Services Whatis it? The organization begins to see a cultural transformation towards quantitative analysis superseding that of qualitative experience led. What is the point? Through iterations of FASTT the company will shift towards data as its competitive differentiator and realize the ability to offer new and better services. Data Driven Culture Data driven analysis is federated to all parts of the business For example, business team begins internal analysis of cash flow based on linear regression that accounts for seasonality and vender relationship coefficients New Better Services Organization builds internal portal on preferred vendor pricing For example, based on predicting prices and quantities needed, organization builds web based portal internally to suggest vendor and timing based on analytic TRANSFORM FASTT METHODOLOGY Copyright © 2017 Accenture All rights reserved.
  • 14.
    A top strategicpriority for business leaders is to get the organization running in a more cost-efficient way and redirect resources to growth. The FASTT methodology for unplanned analytics allows: • Creating unprecedented spend visibility at a forensic level • Budgeting from zero each year removes unnecessary cost and creates a detailed forecast. • Matrixed responsibility drives positive tension and negotiations to create an ownership mindset • Creates a culture of sharing and learning by example. • Successful organizations will balance the art (behavioral) and the science (proof /incentives) of this critical culture change • Culture is not a barrier to success… lack of ambition is. IMPROVED VISIBILITY ENHANCED ACCOUNTABILITY EFFICIENT ORGANIZATIONAL CHANGE Visibility often highlights Indirect baseline increase of 20-40% Accountability defined right up to C- Suite as Global Package Owners Sustainability dependent on understanding of what it means to each individual UNPLANNEDANALYTICS WITH FASTT SMART SPEND SOLUTION Copyright © 2017 Accenture All rights reserved.
  • 15.
    FOR MORE INFORATION TERRYHEMKEN Managing Director, Accenture Analytics Insights Service
  • 16.
    ABOUT ACCENTURE Accenture isa leading global professional services organization, providing a broad range of services and solutions in strategy, consulting, digital, technology and operations. Combining unmatched experience and specialized skills across more than 40 industries and all business functions—underpinned by the world’s largest delivery network—Accenture works at the intersection of business and technology to help clients improve their performance and create sustainable value for their stakeholders. With more than 411,000 people serving clients in more than 120 countries, Accenture drives innovation to improve the way the world works and lives. Visit us at www.accenture.com. Copyright © 2017 Accenture All rights reserved. Accenture, its logo, and High Performance Delivered are trademarks of Accenture.
  • 17.