This document discusses implementing a green economy through industrial ecology and eco-efficiency. It provides definitions of key concepts from the United Nations like green economy and eco-efficiency. It also summarizes strategies like cleaner production, industrial symbiosis, and product service systems. Specific examples are given of initiatives in areas like water recycling, waste reduction, and expanded polystyrene recycling. Overall the document outlines an approach to transitioning industry to be more sustainable and resource efficient through industrial ecology principles.

![Economic aspects:
Flux [tonnes/an] Procédé Boots Procédé BHC
Réactifs 33'000 17'000
Produits 13'000 13'000
Déchets 20'000 4'000
Total 66'000 34'000
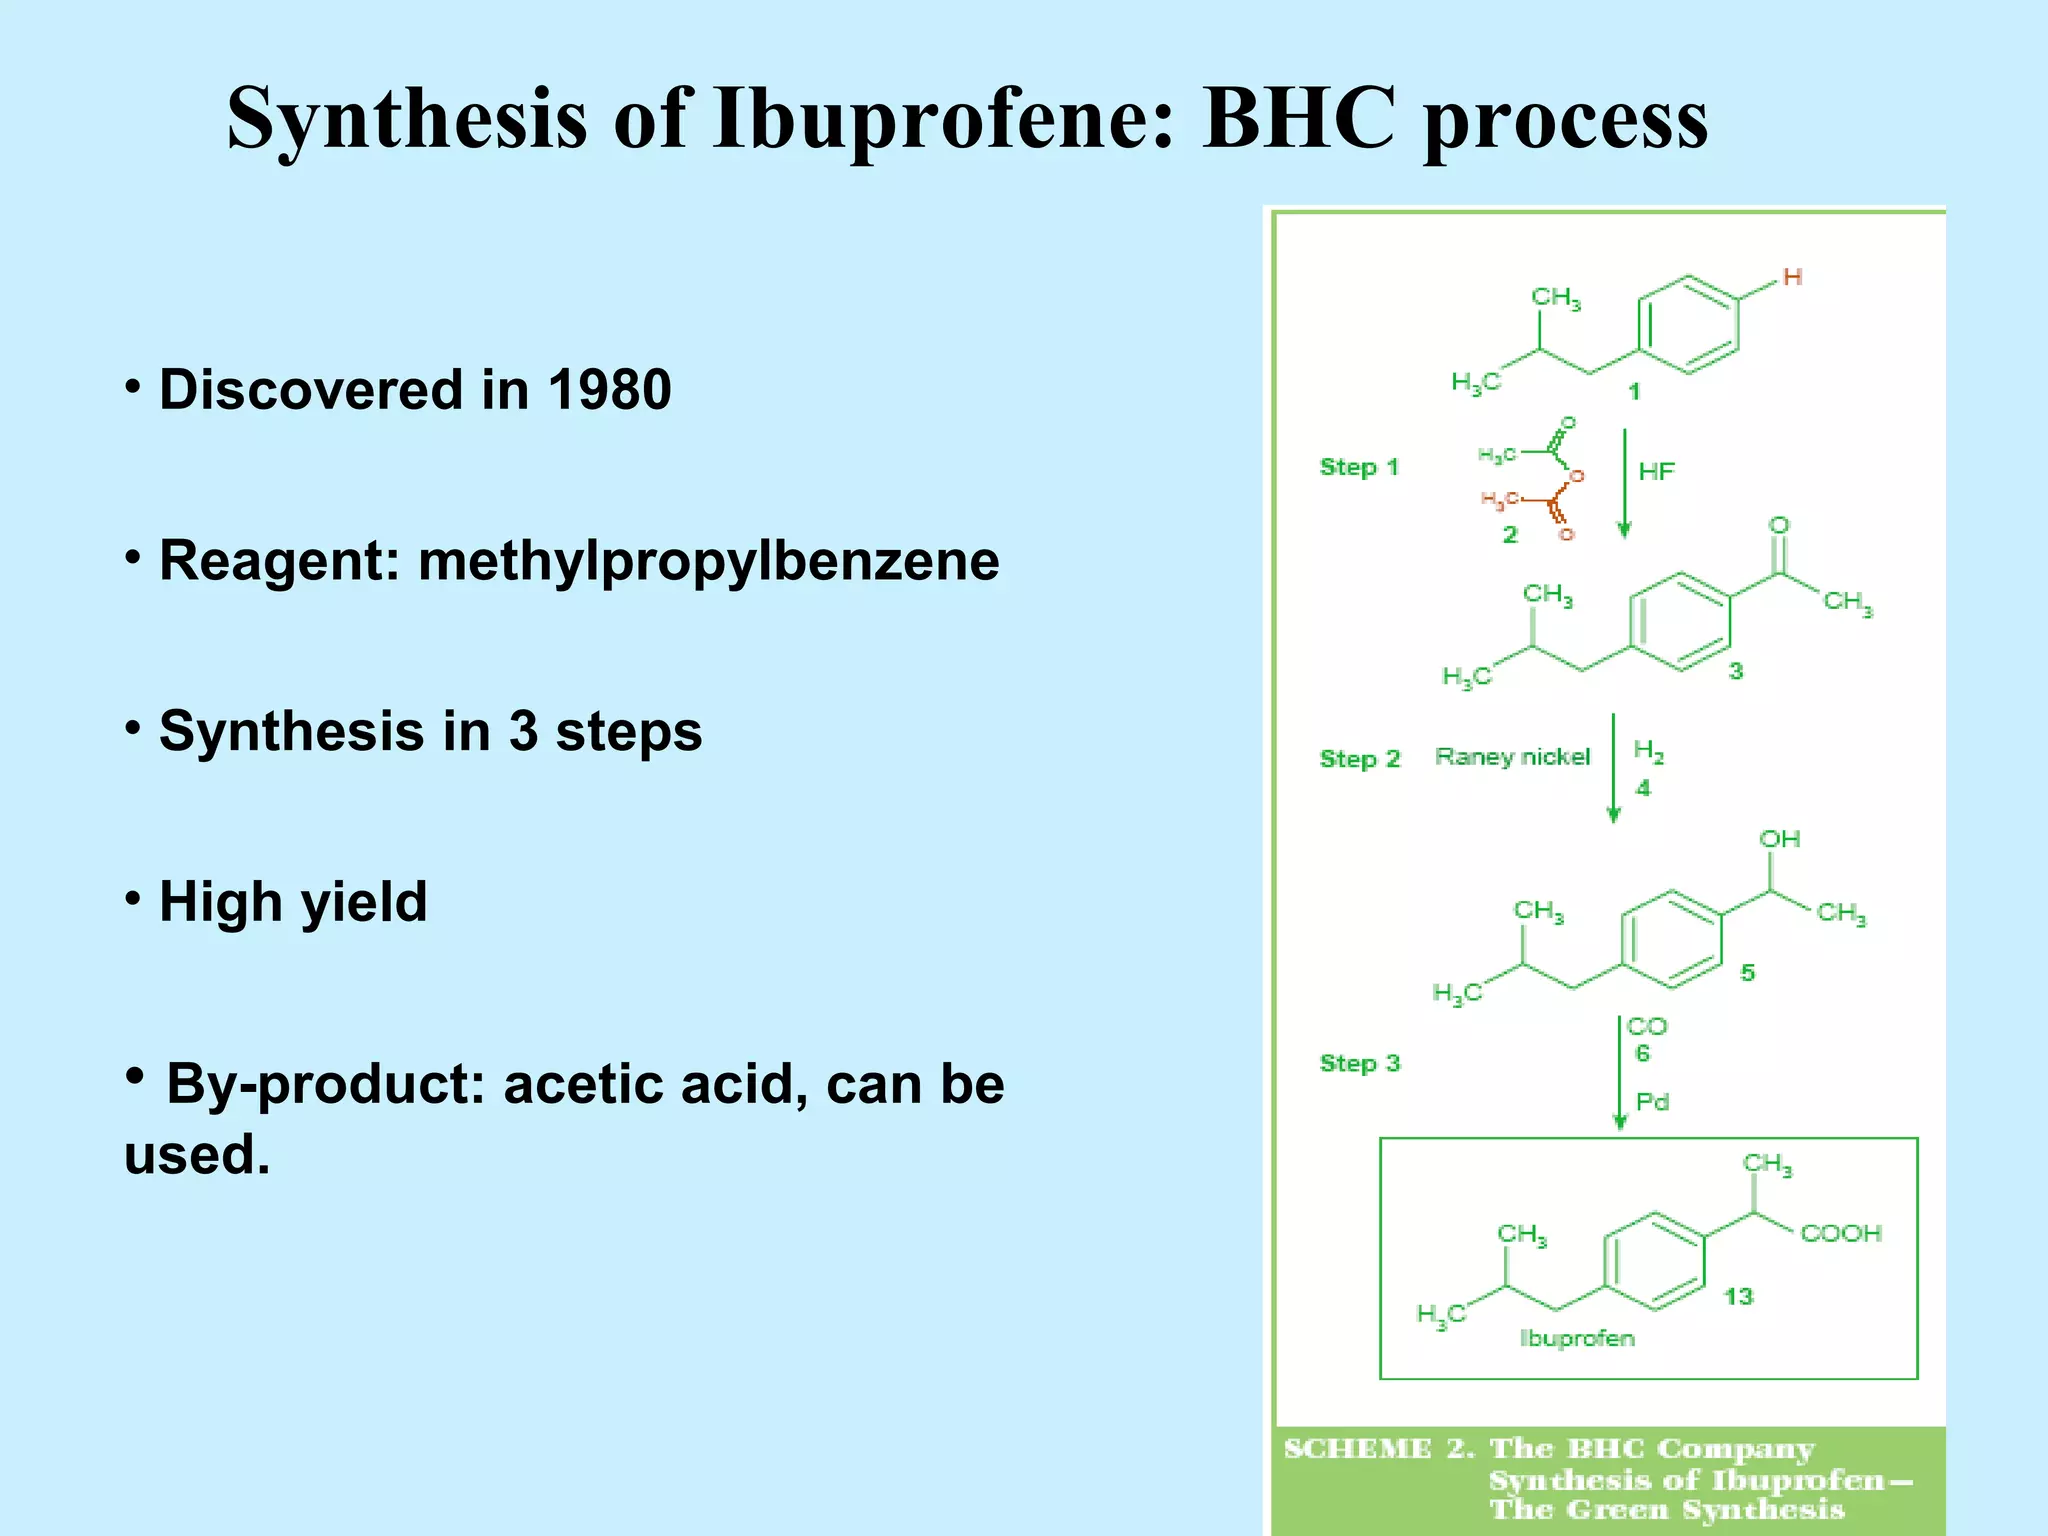
• Annual production: 13'000 tons
• Materials consumption divided by 2
• BHC process: no waste](https://image.slidesharecdn.com/1coursegreenacademyerkman-copie-141229222031-conversion-gate02/75/1-course-green_academy_erkman-copie-20-2048.jpg)