Download as PDF, PPTX
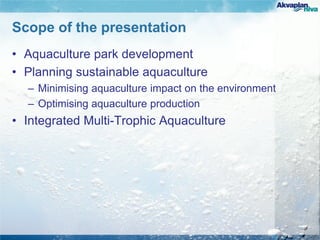
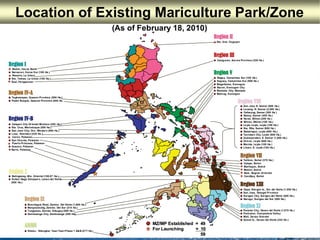
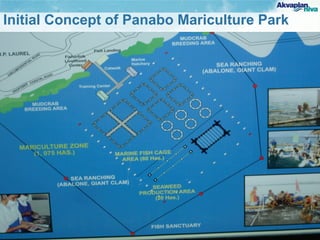
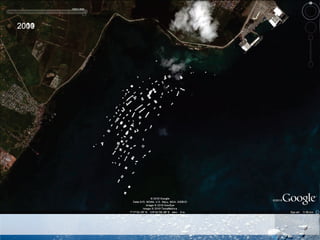
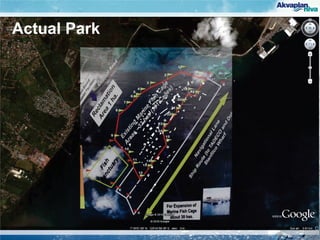
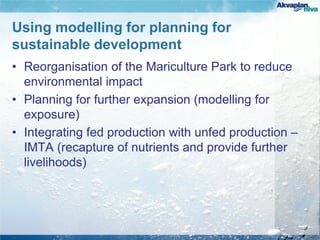
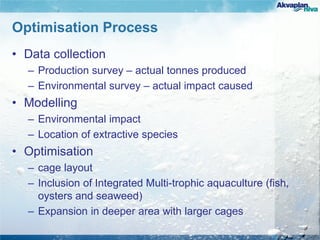
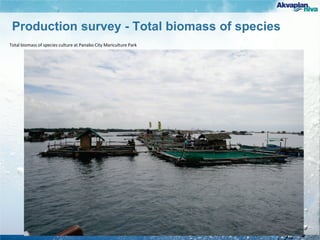
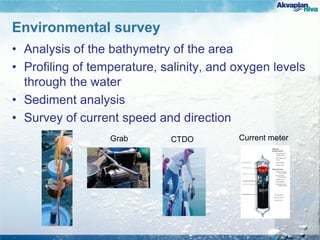
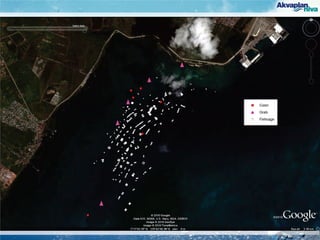
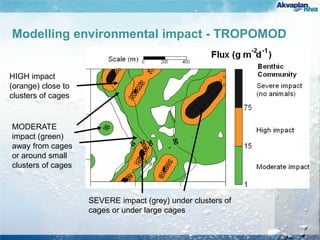
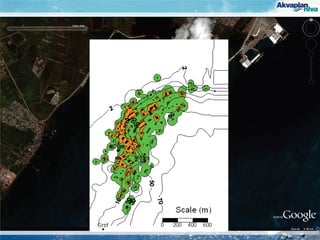
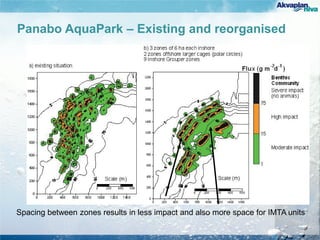
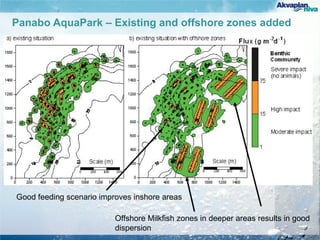
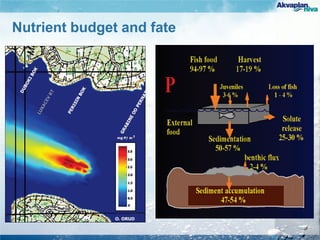
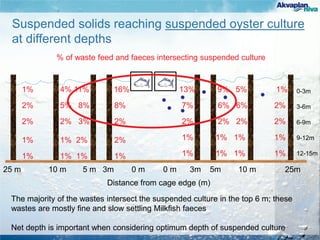
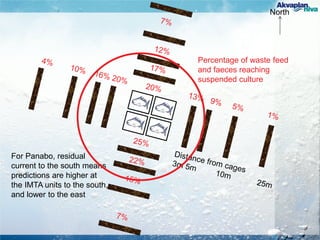
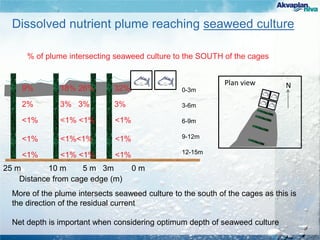
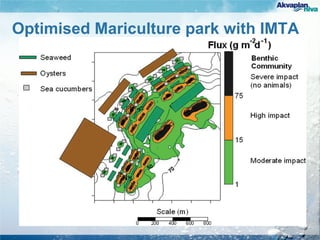
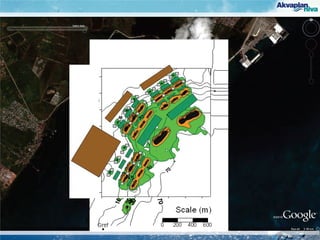
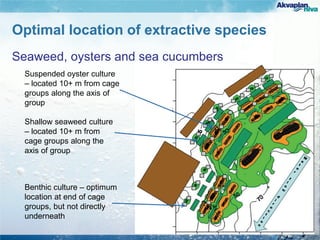
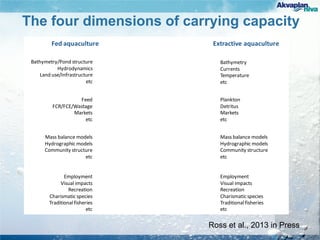
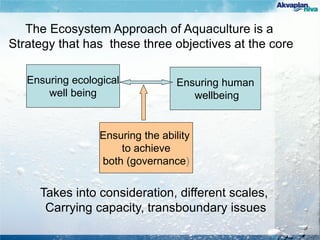
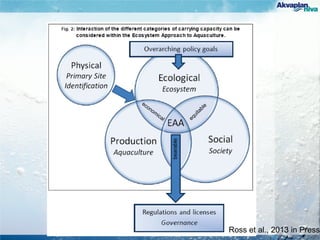
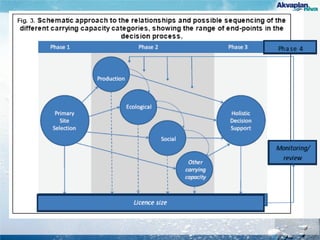

This document discusses planning and management of aquaculture parks in the Philippines for sustainable development. It provides an overview of existing and planned mariculture park locations across the country. A case study of the Panabo Mariculture Park is used to demonstrate how carrying capacity modeling was used to optimize cage layout, include integrated multi-trophic aquaculture, and plan for expansion. Modeling of environmental impacts, nutrient budgets, and uptake by extractive species helped determine the optimal location of seaweed, oysters, and other benthic cultures within the park. Ensuring ecological, human, and governance well-being are key principles of the ecosystem approach used for sustainable aquaculture planning and management.


