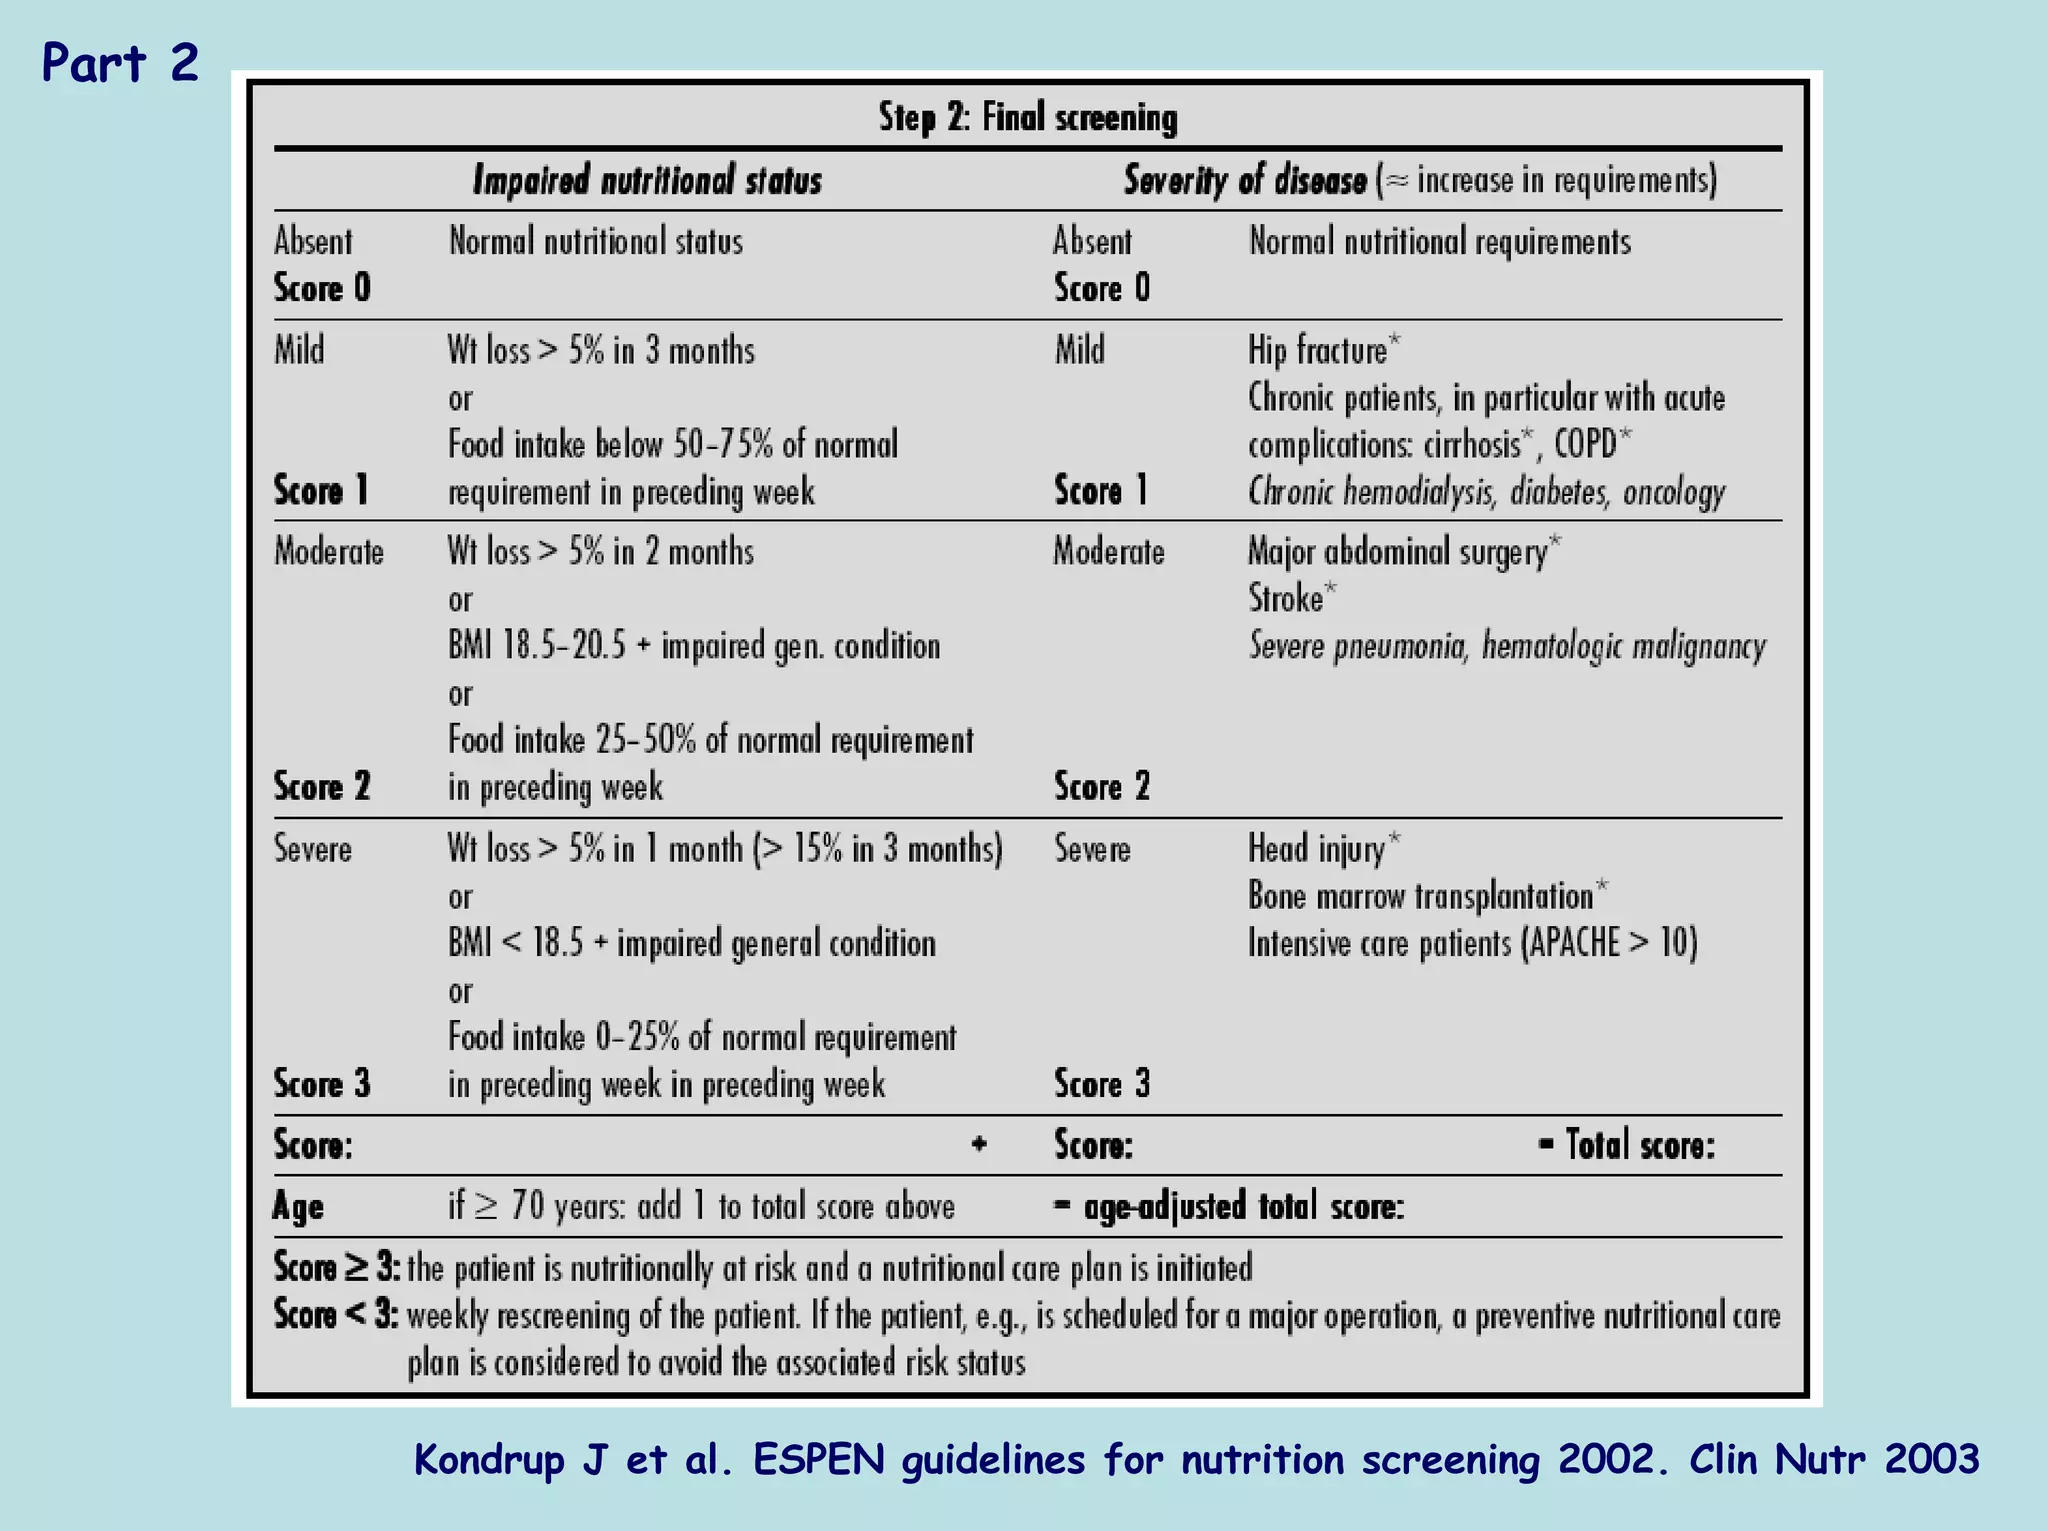
Download as PDF, PPTX
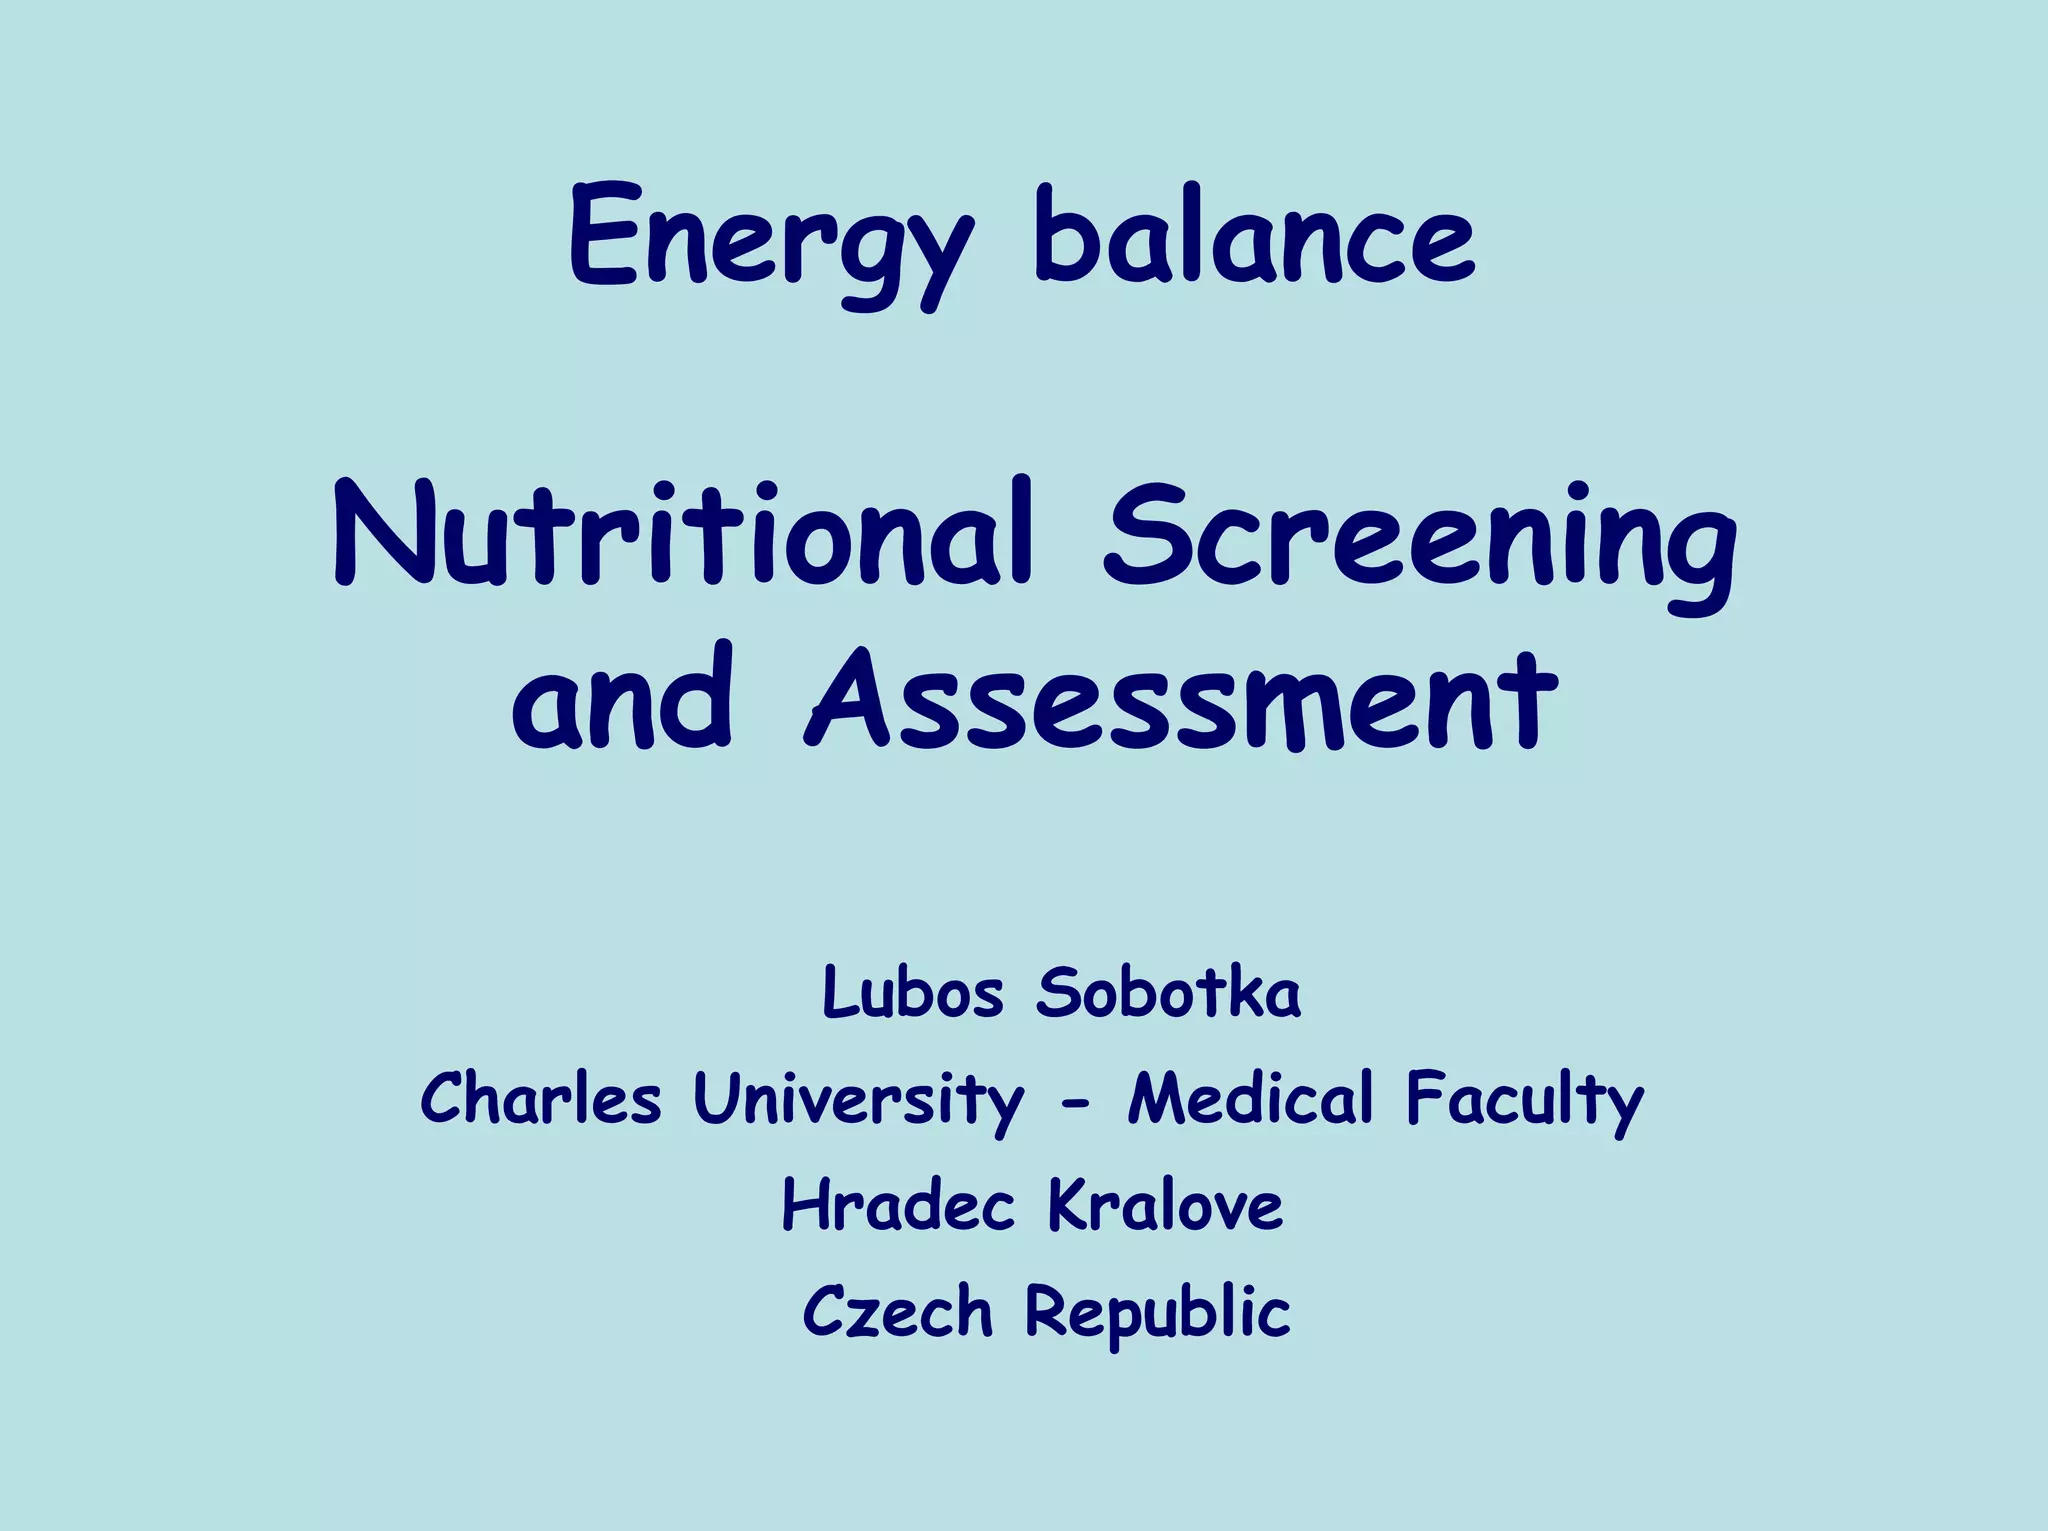
![Relationship between REE and RQ
[REE calculation based on VO2 or on VCO2]
120,0
115,0
Difference in REE [%]
110,0
105,0
VCO2
100,0
VO2
95,0 VO2 a VCO2
90,0
85,0
80,0
0,7 0,75 0,8 0,85 0,9 0,95 1
RQ
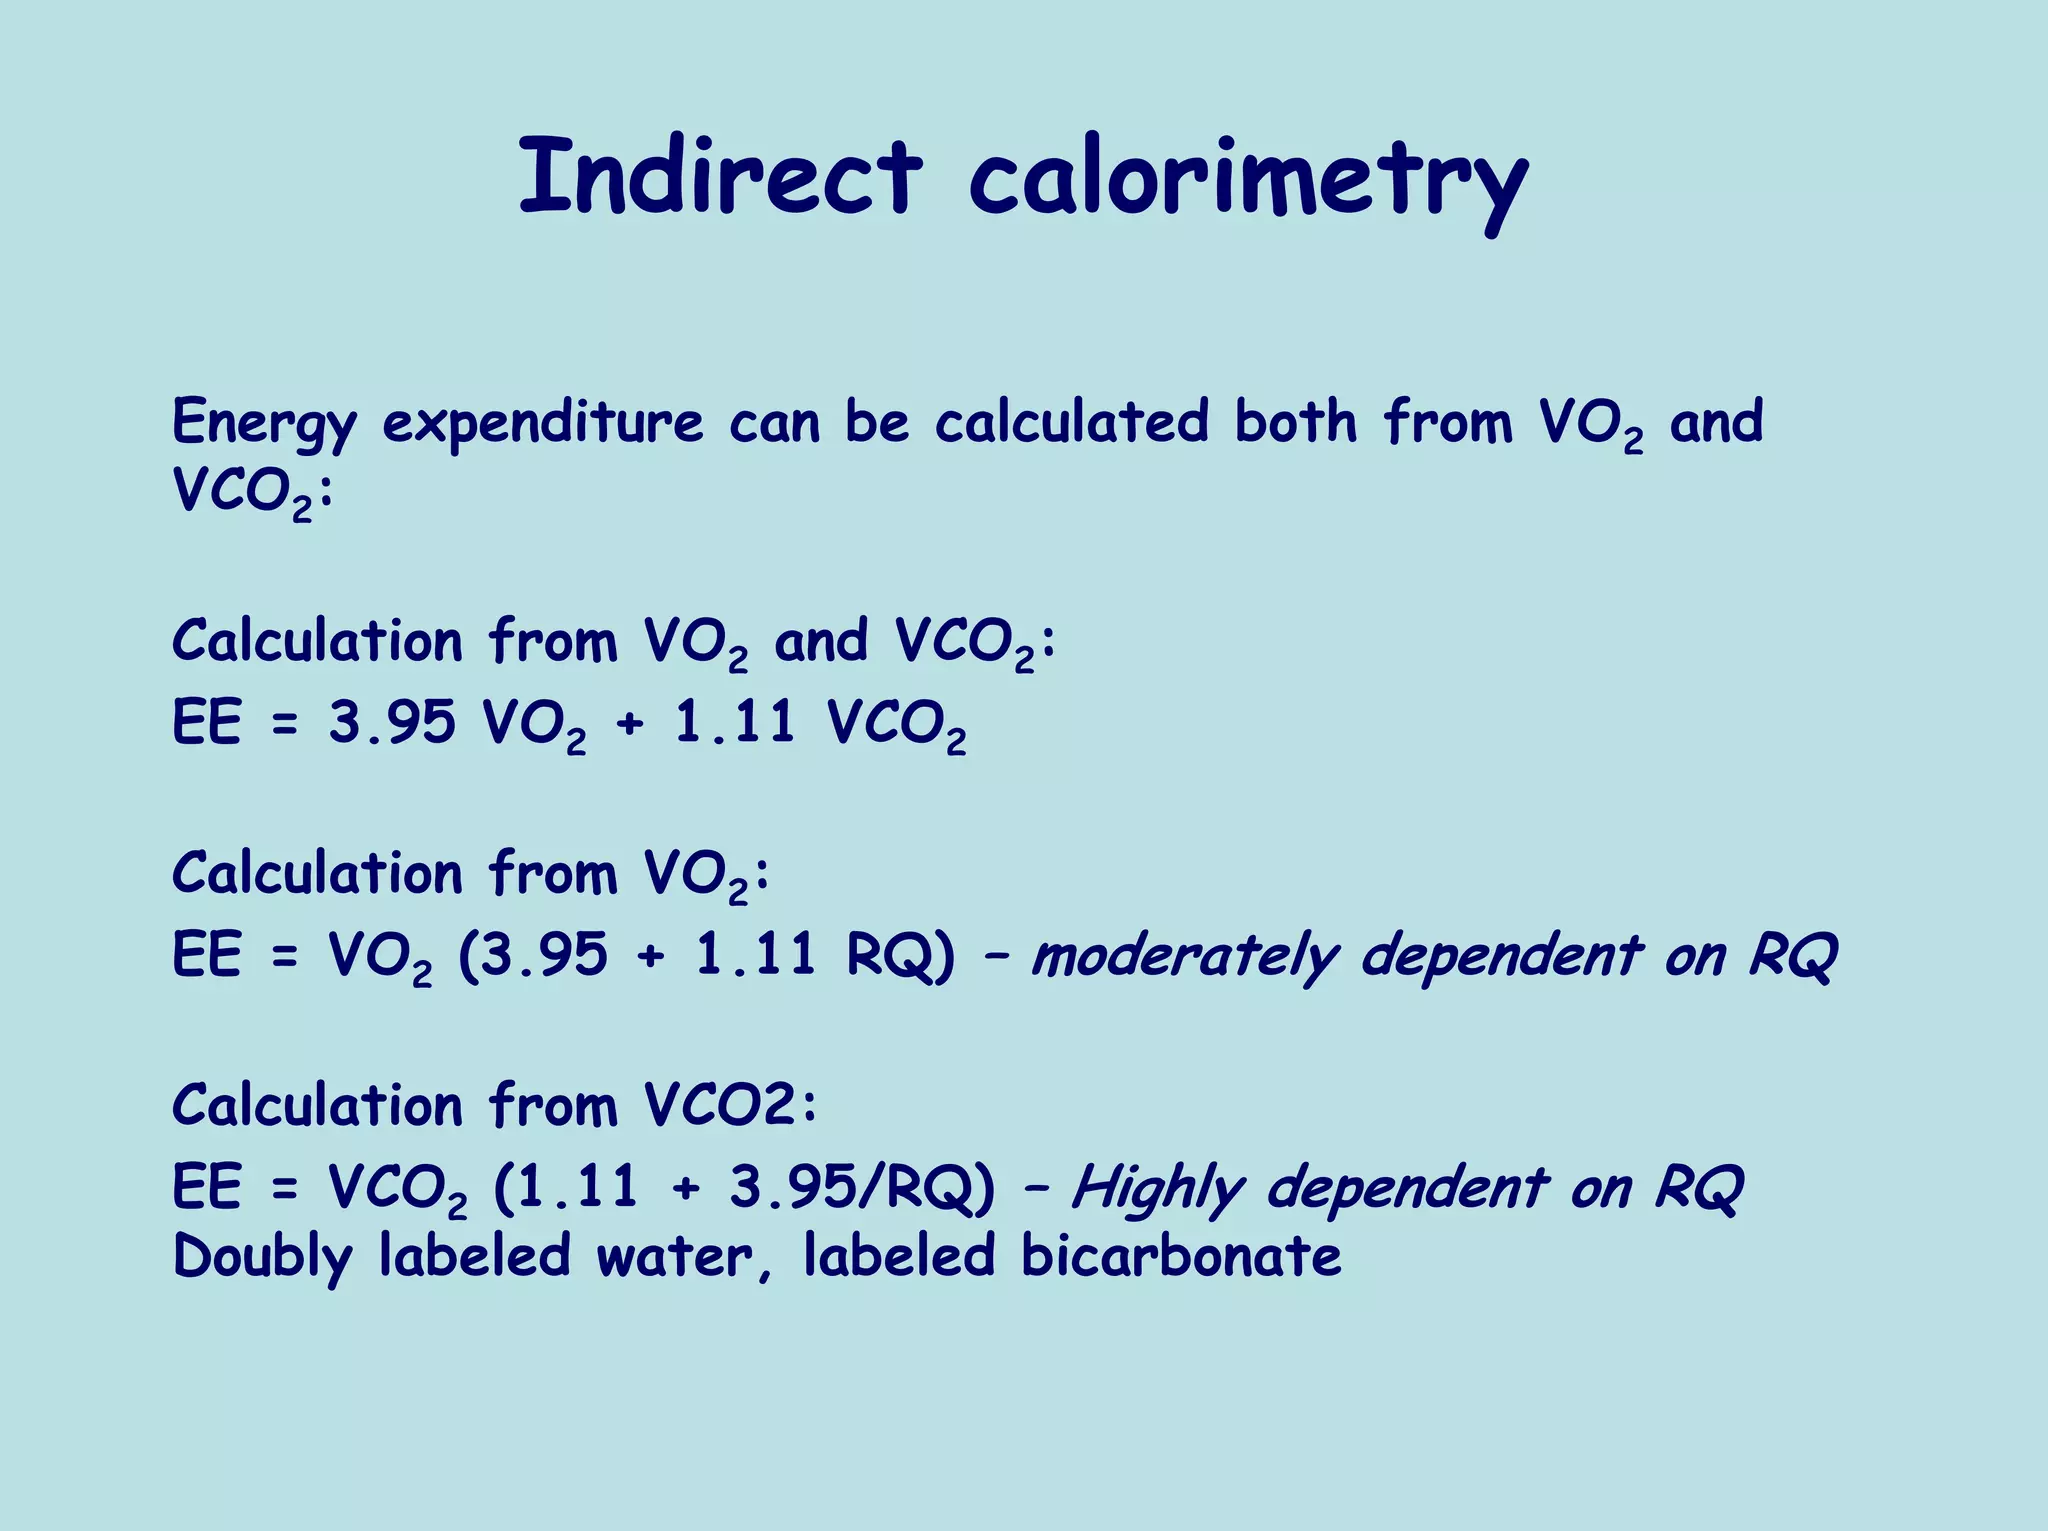
REE calculated from VCO2 is more dependent on RQ (possible
mistake 15%) then if calculated from VO2 (possible mistake
4%)](https://image.slidesharecdn.com/02sobotkahow-120503081830-phpapp01/75/02-sobotka-how-13-2048.jpg)
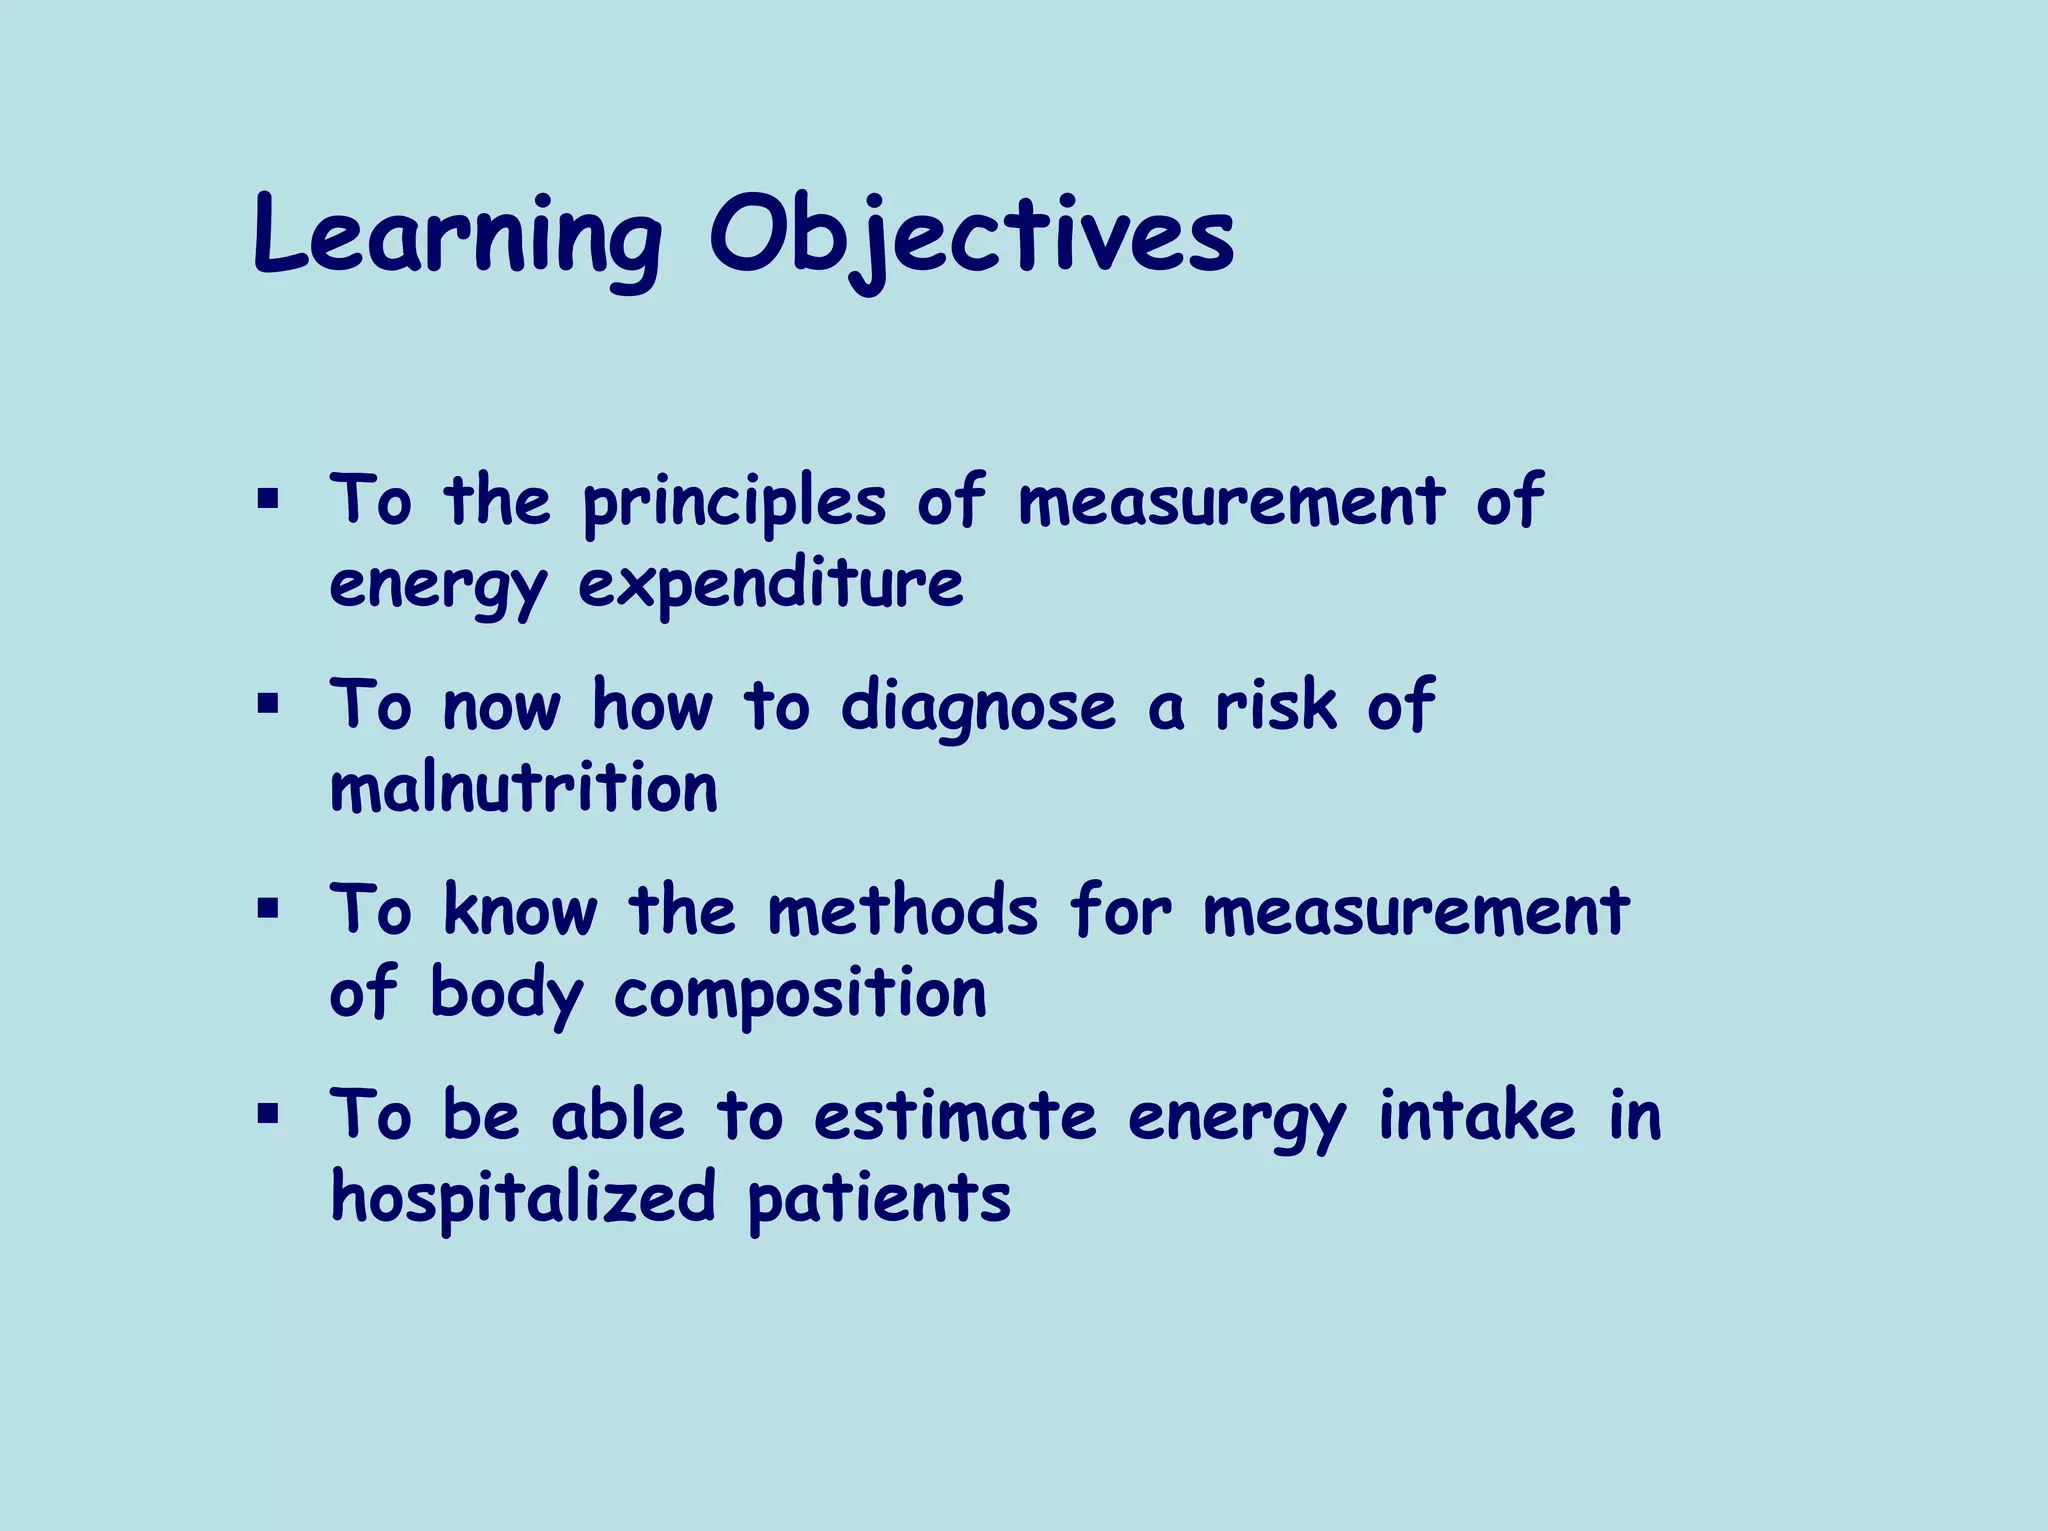
![Relationship between heart rate and energy
expenditure
12,00
10,00
8,00
Energy expenditure
[kcal/min.]
6,00
4,00
2,00
0,00
40 50 60 70 80 90 100 110 120 130 140
Heart rate [b/min]](https://image.slidesharecdn.com/02sobotkahow-120503081830-phpapp01/75/02-sobotka-how-15-2048.jpg)
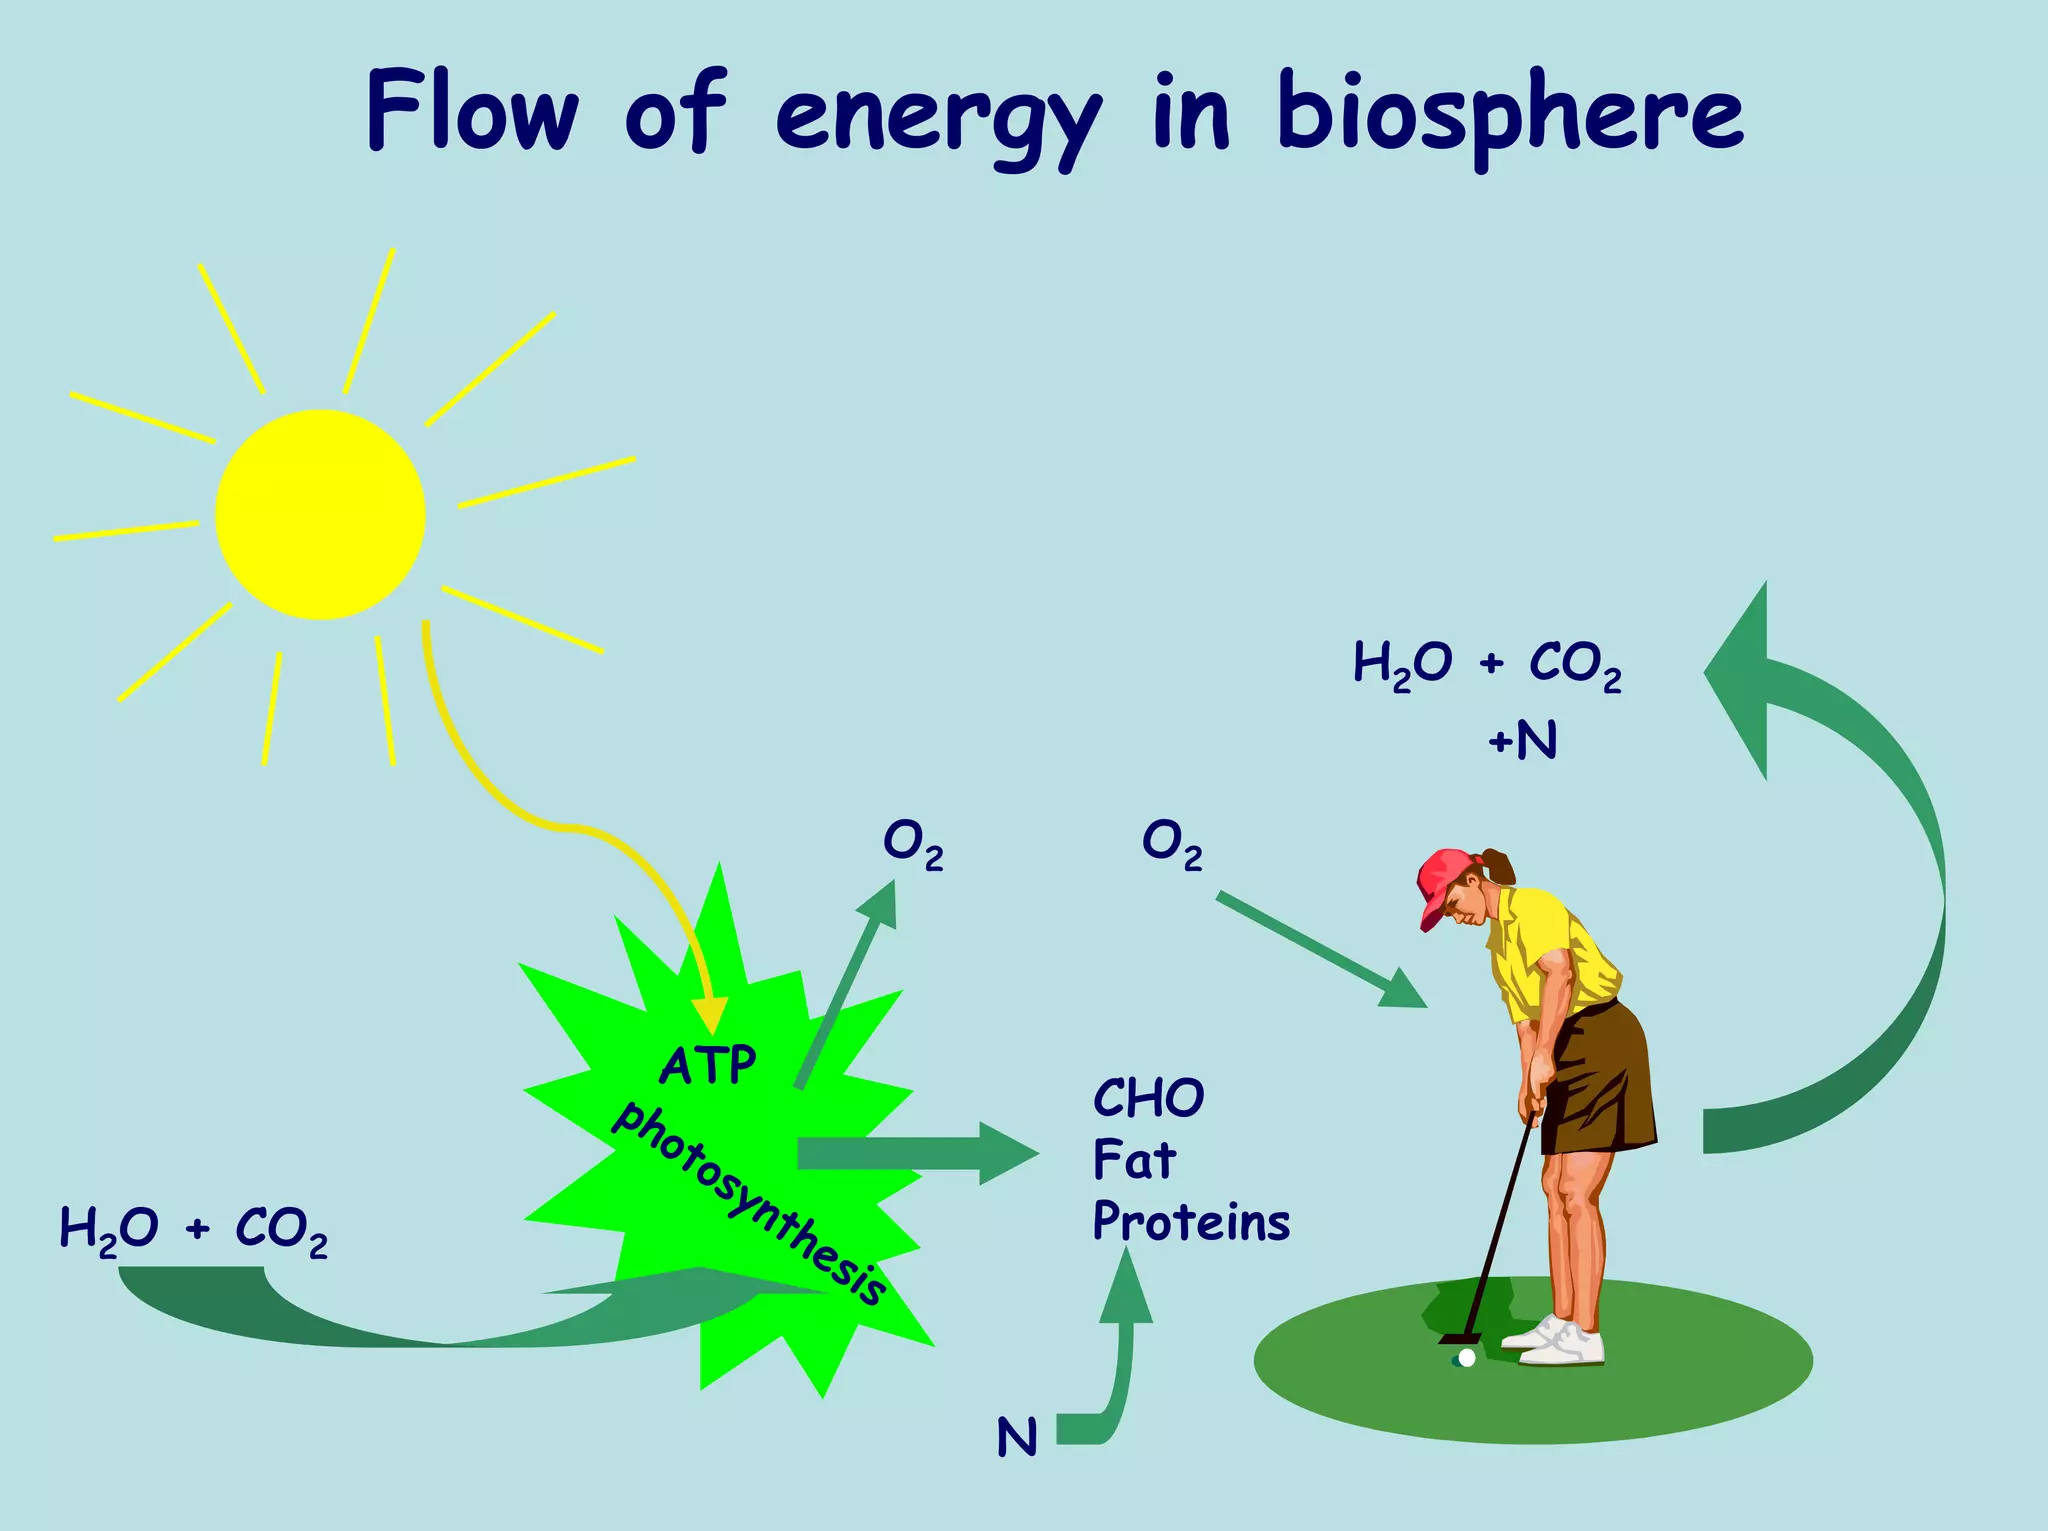
![Relationship between heart rate and energy
expenditure –whole group
14
12
10
Energy expenditure
8
[cal/min.]
6
4
2
0
75 95 115 135 155 175
Heart rate [b/min]](https://image.slidesharecdn.com/02sobotkahow-120503081830-phpapp01/75/02-sobotka-how-16-2048.jpg)
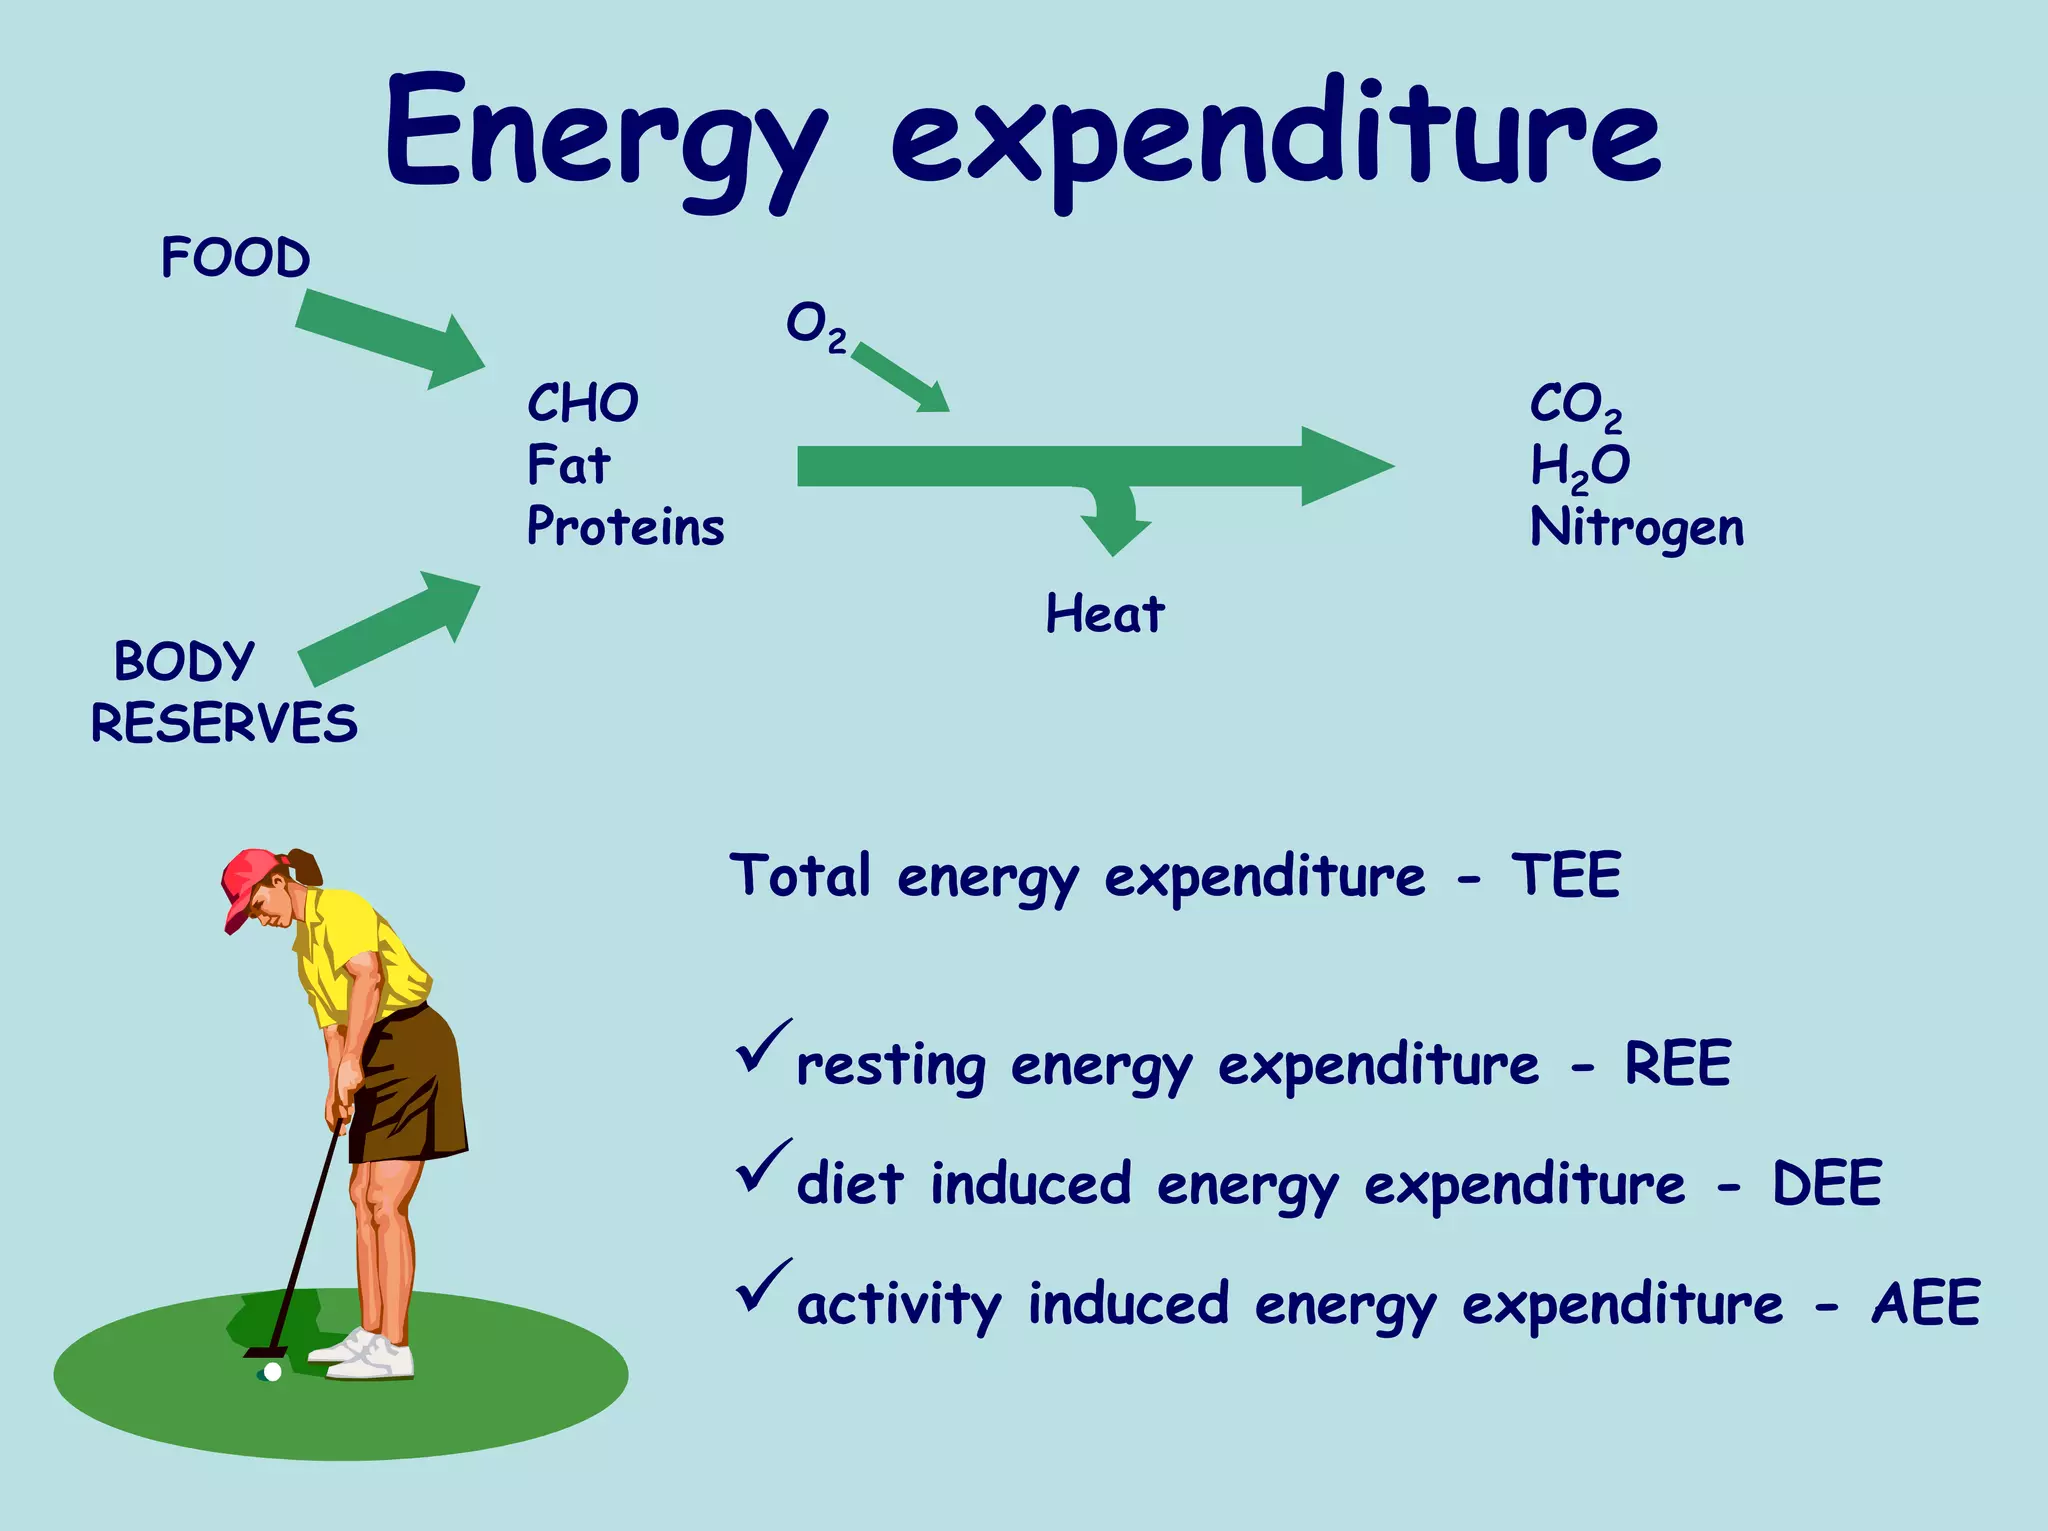
![Relationship between heart rate and energy
expenditure –individual patients
18
16
14
12
Energy expenditure
[cal/min.]
10
8
6
4
2
0
95 105 115 125 135 145 155
Heart rate [b/min]](https://image.slidesharecdn.com/02sobotkahow-120503081830-phpapp01/75/02-sobotka-how-17-2048.jpg)


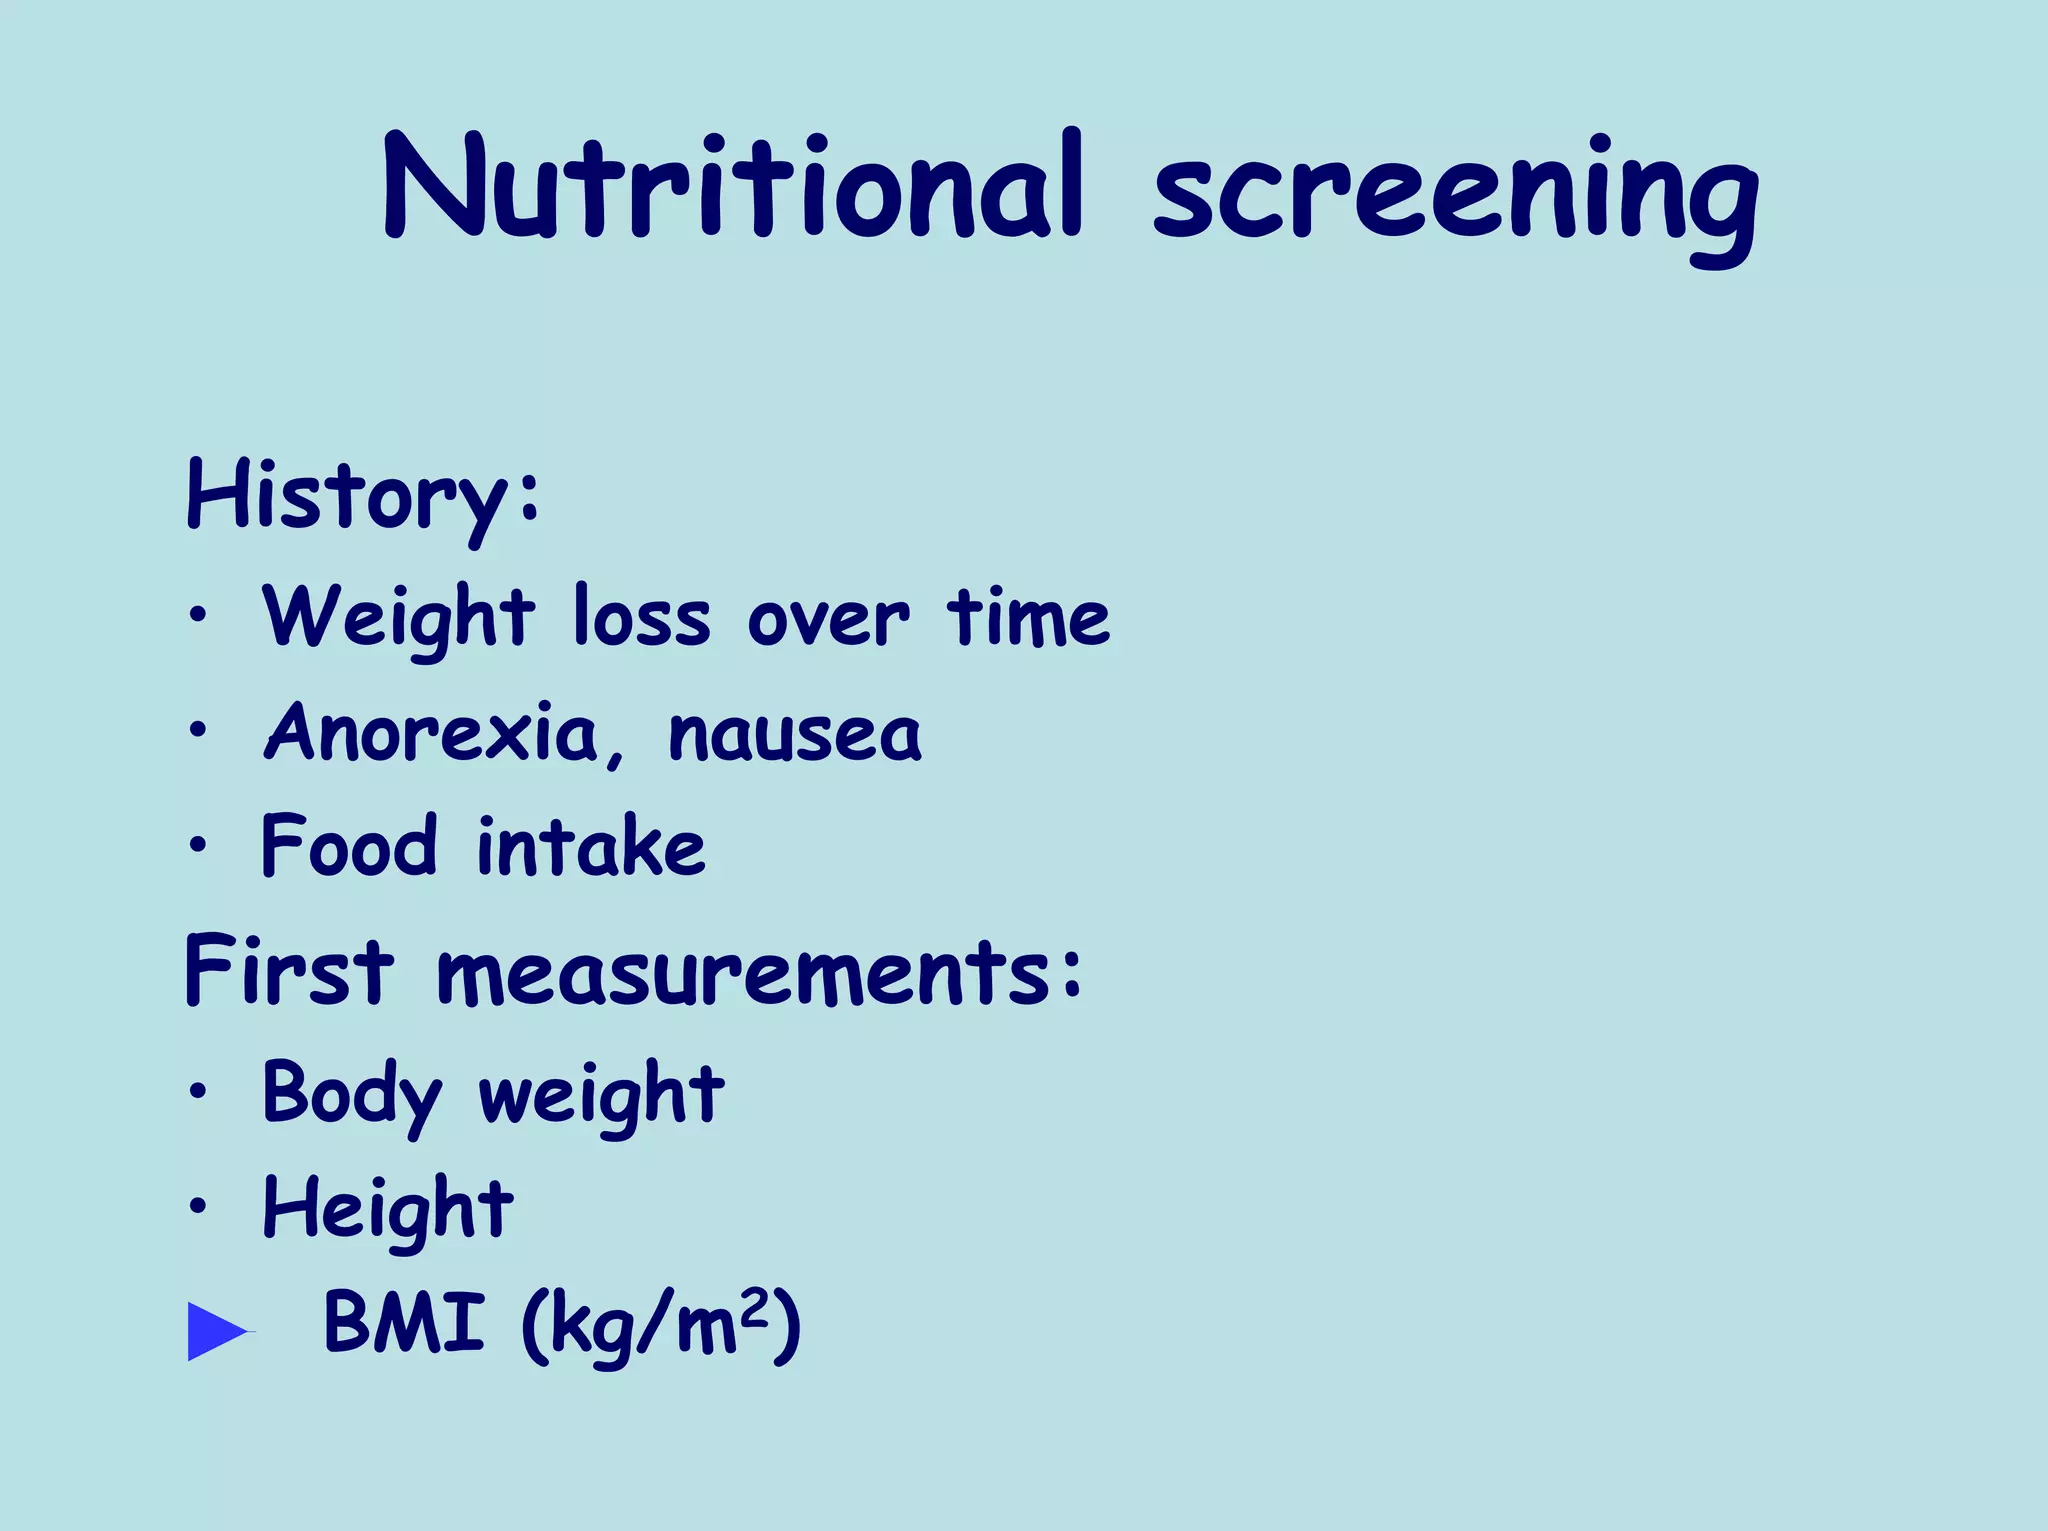
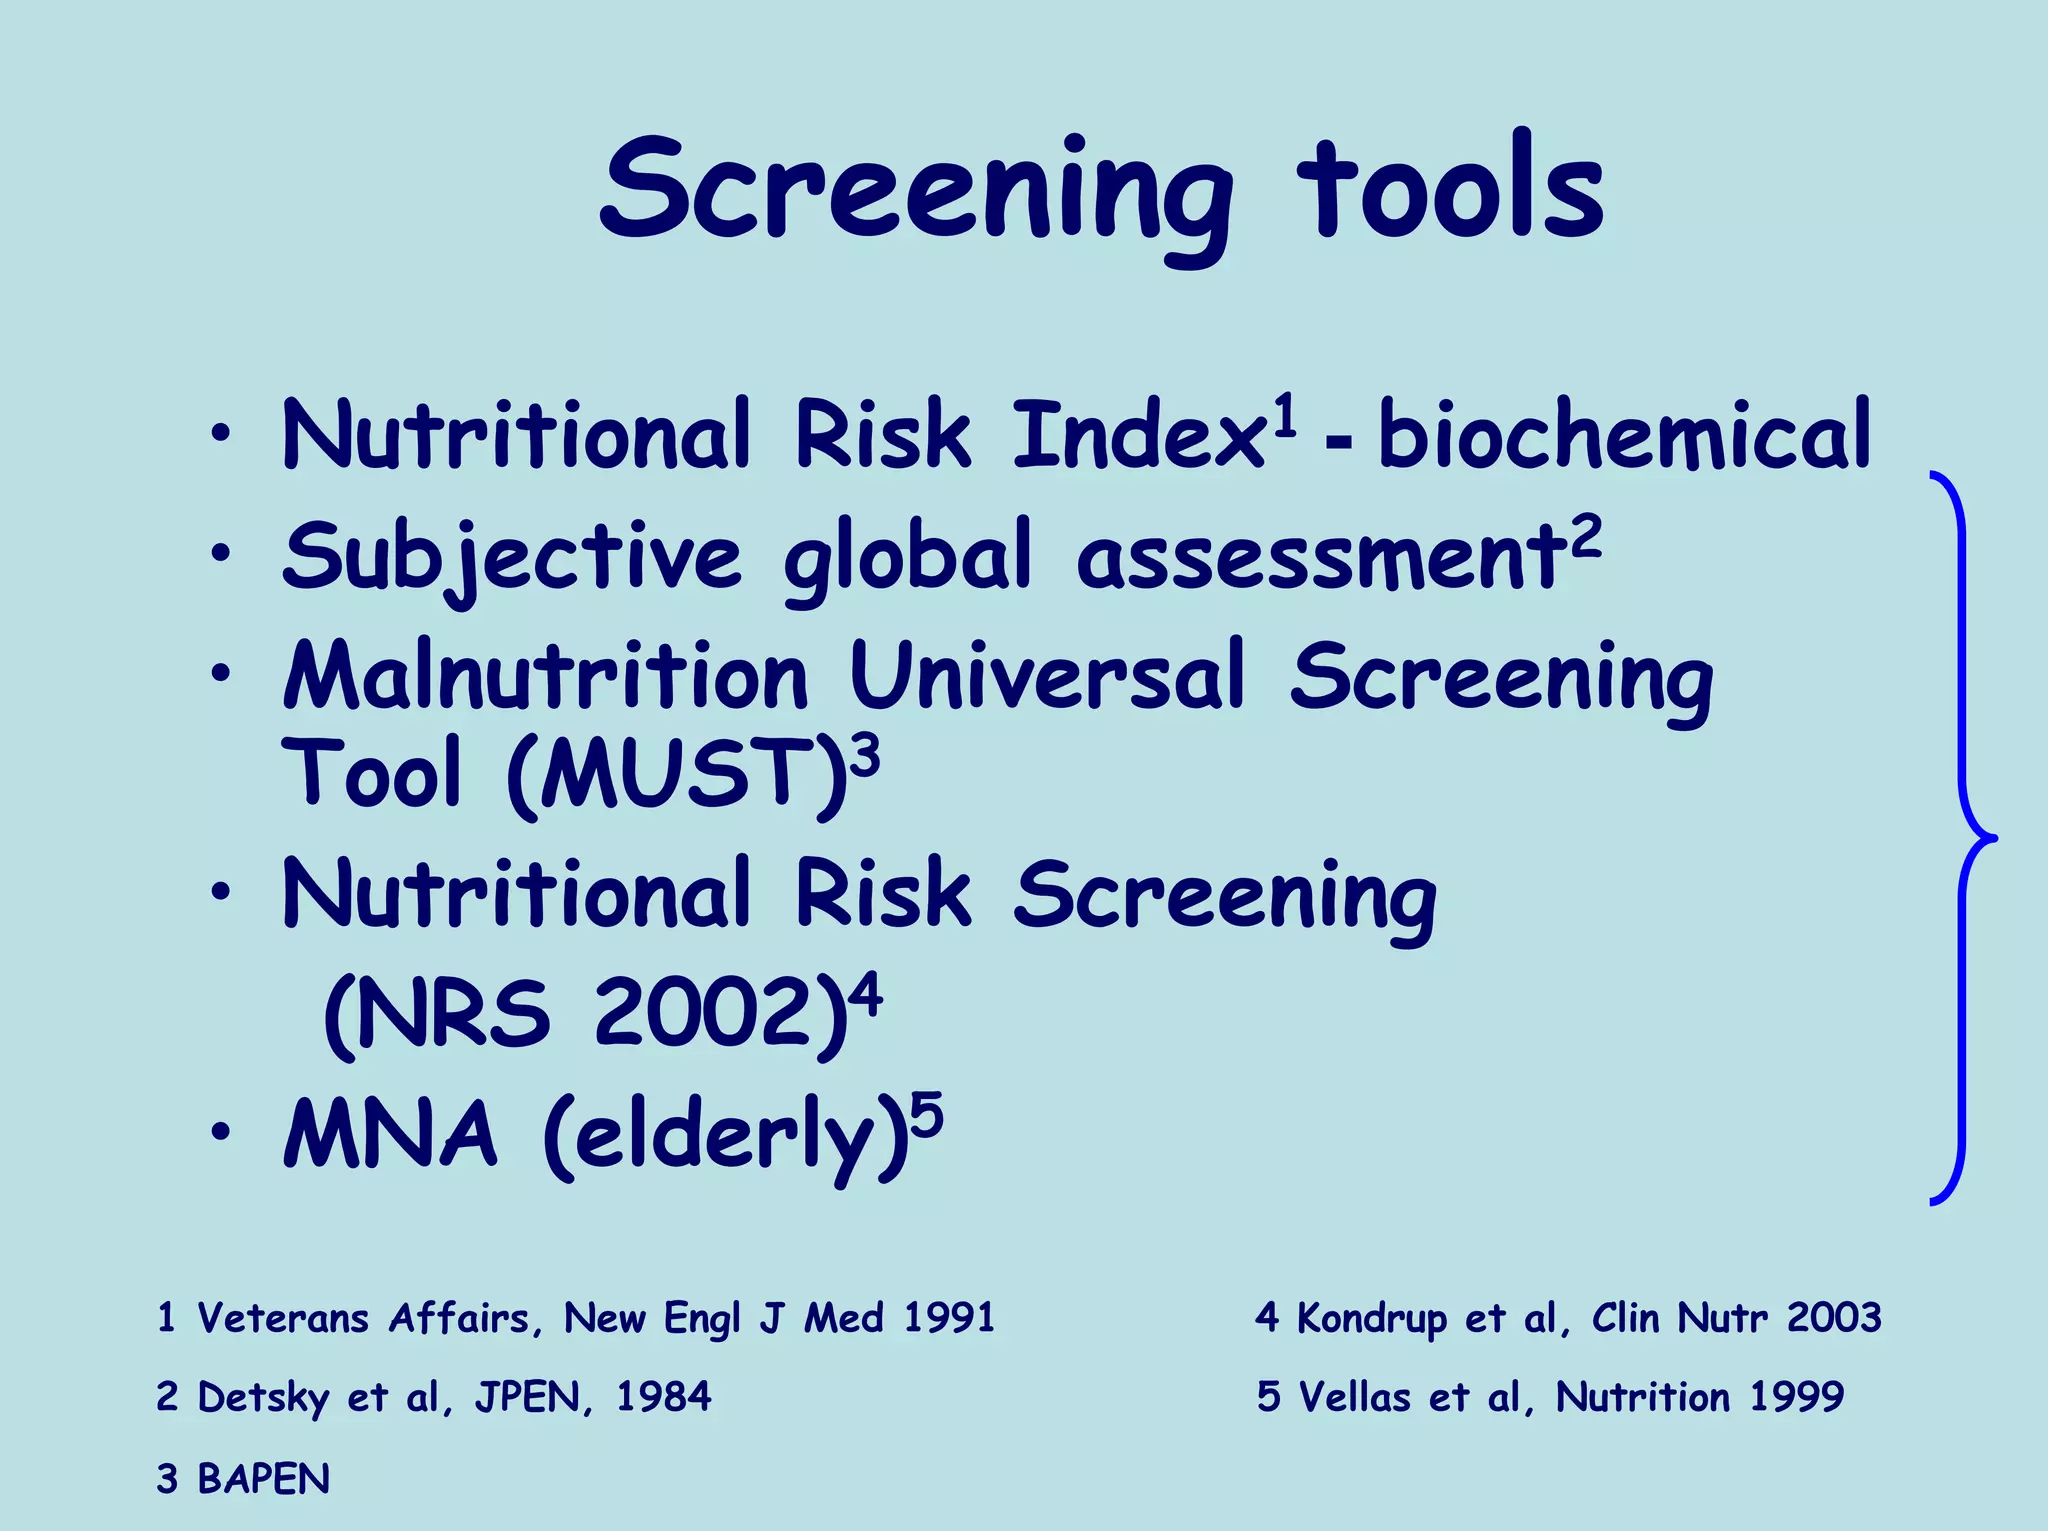

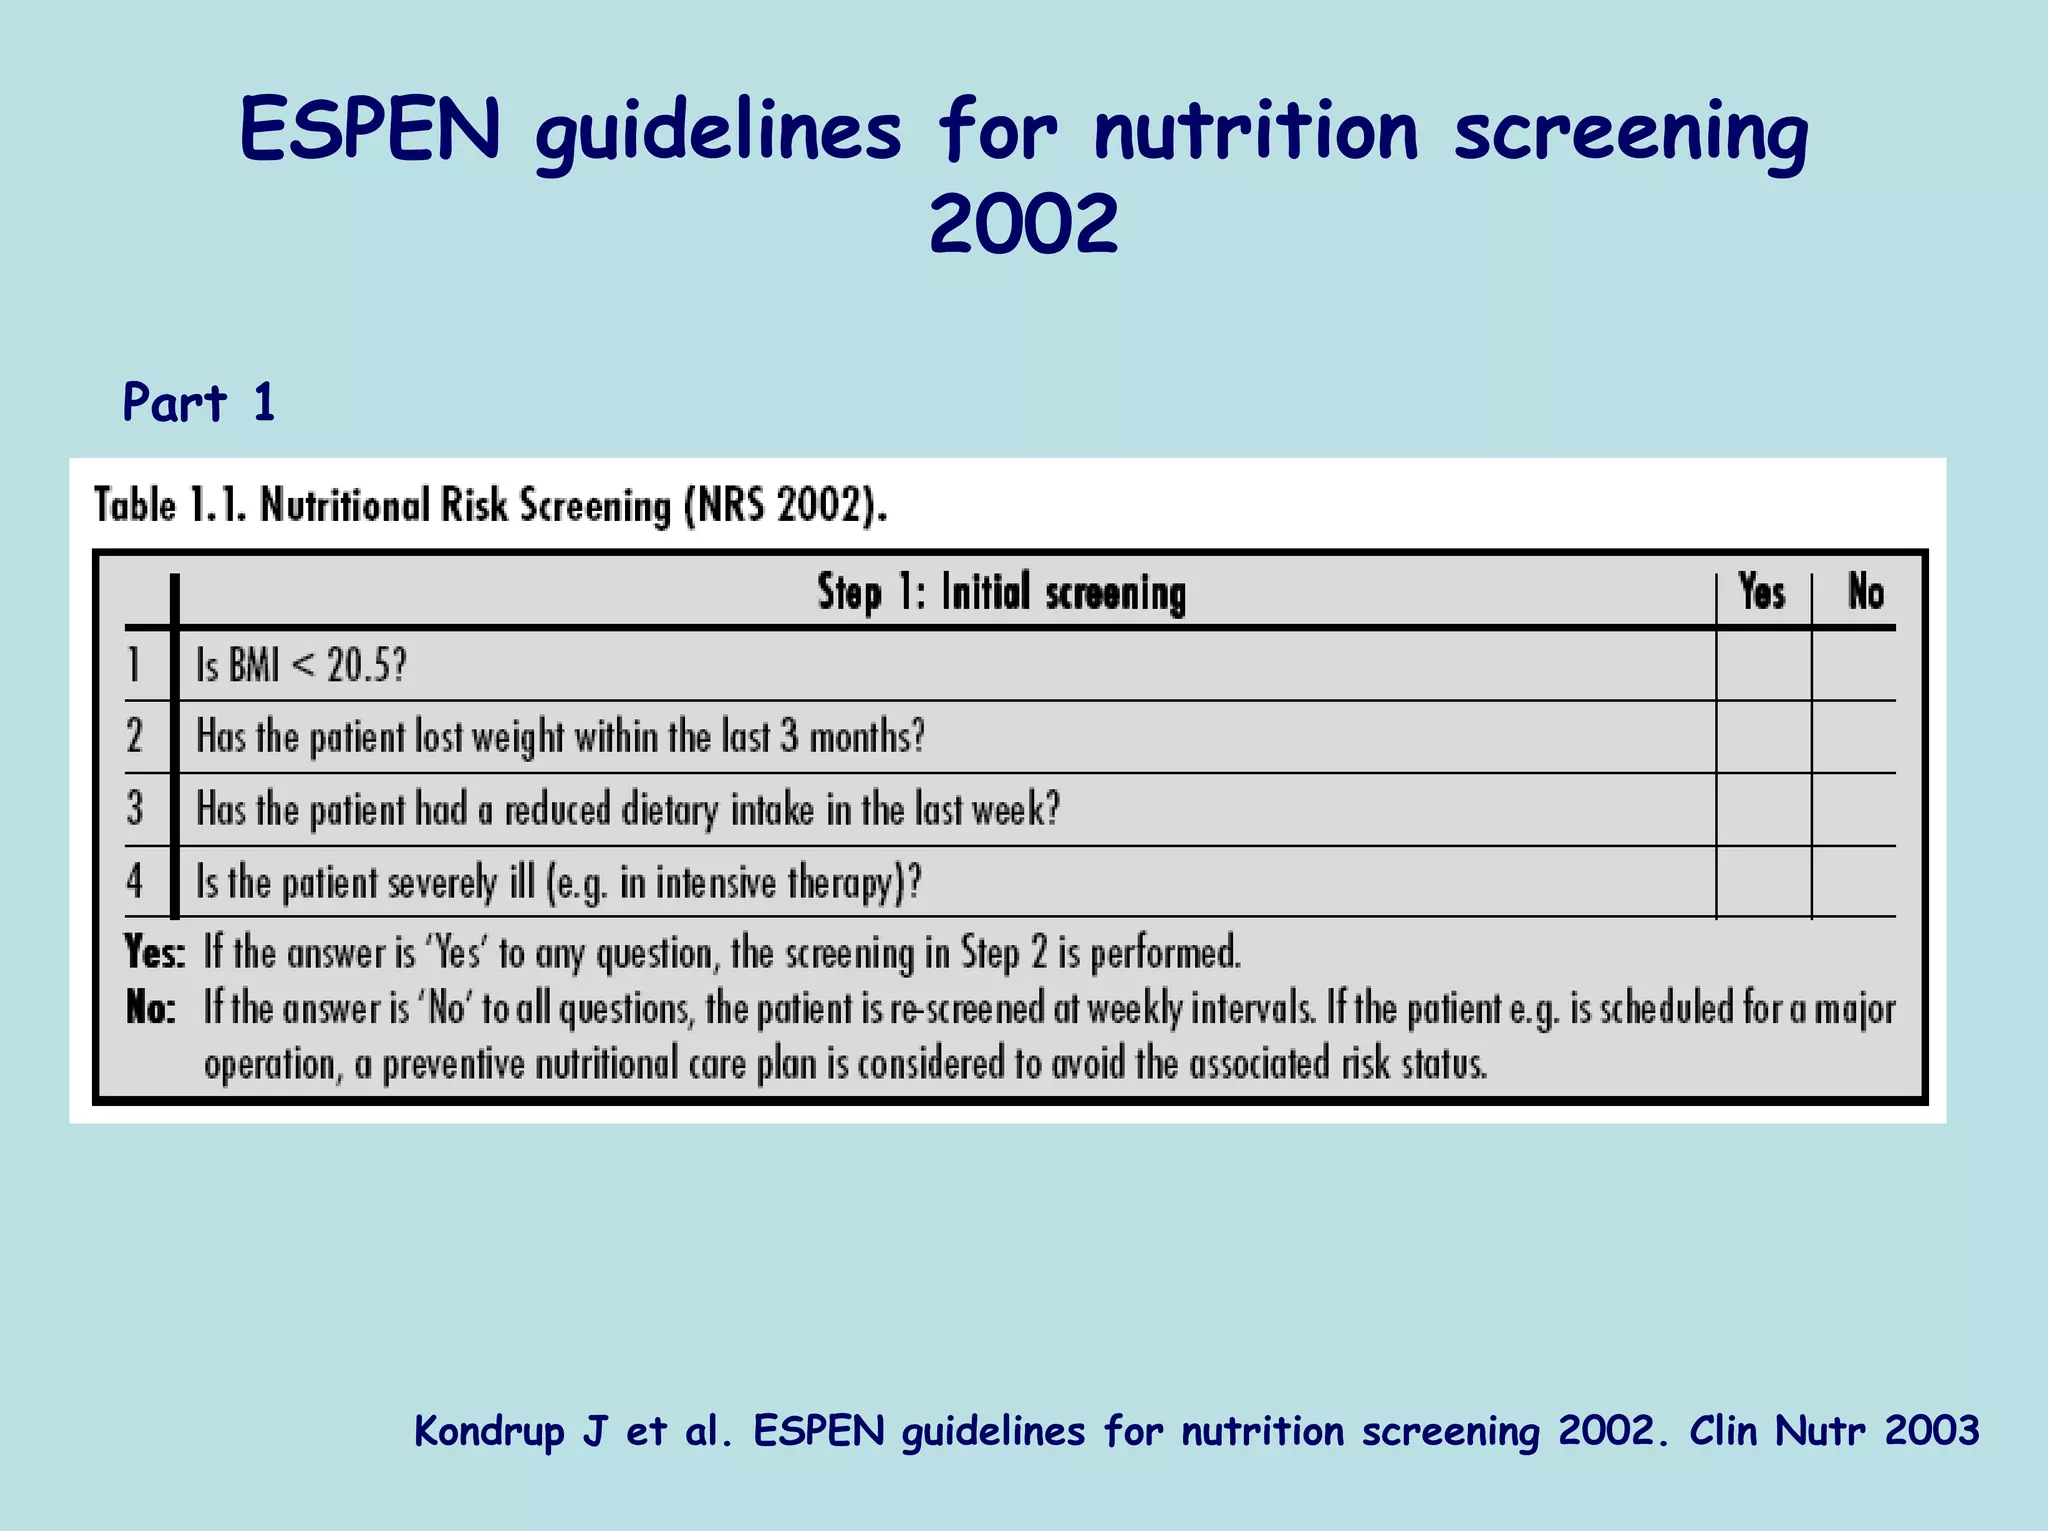
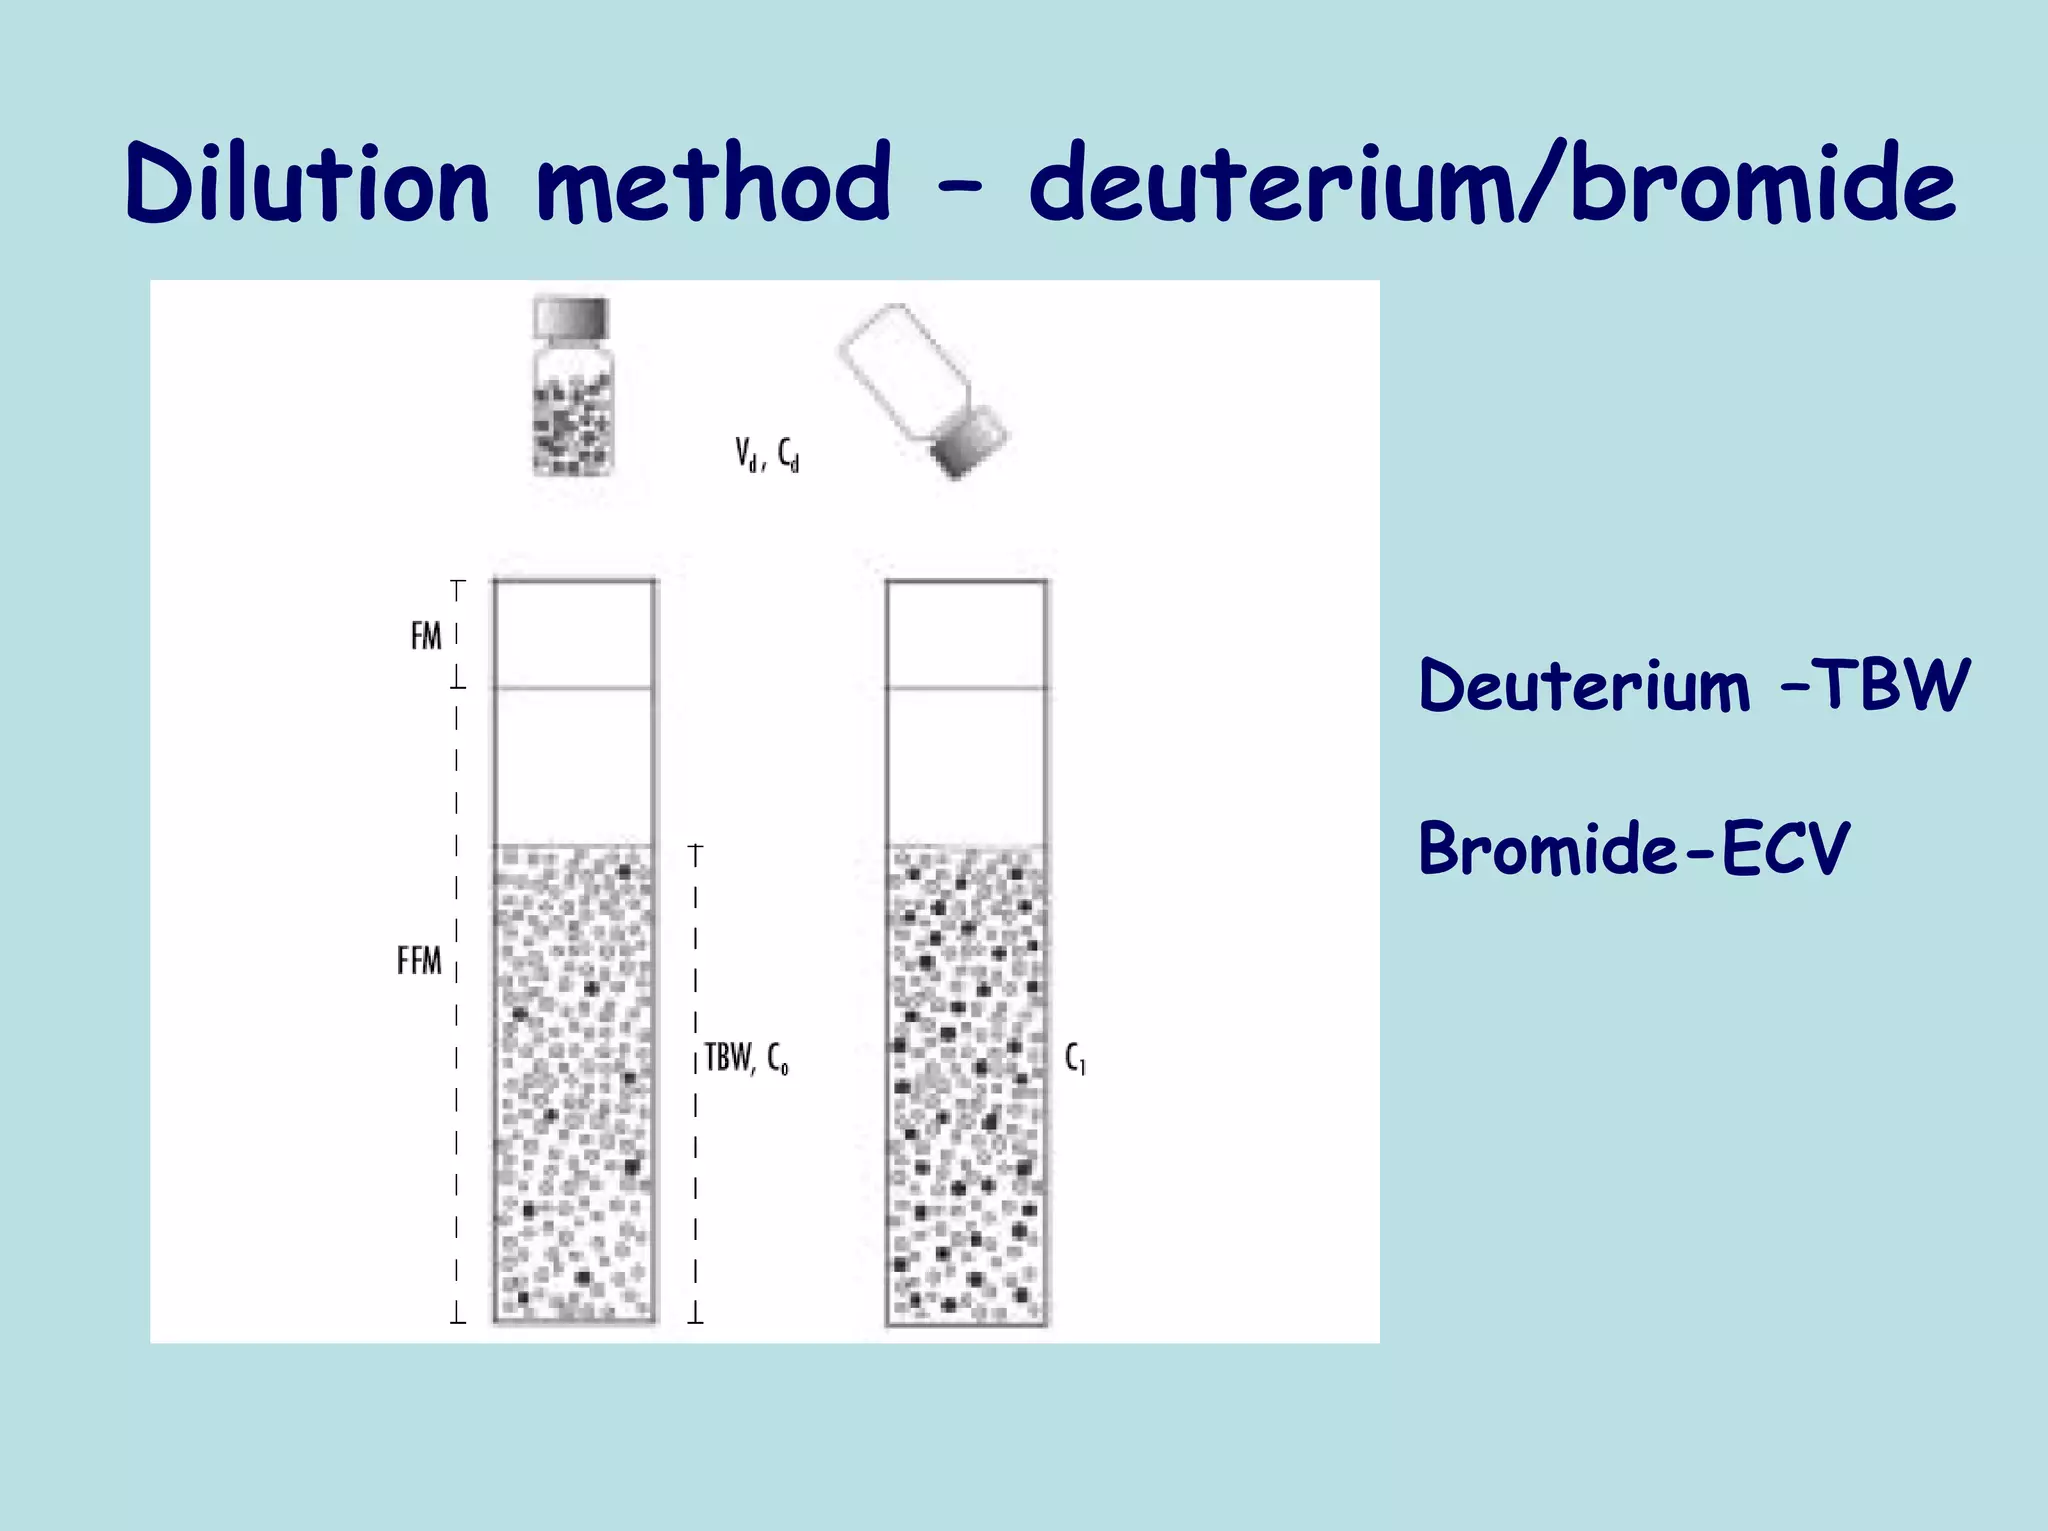
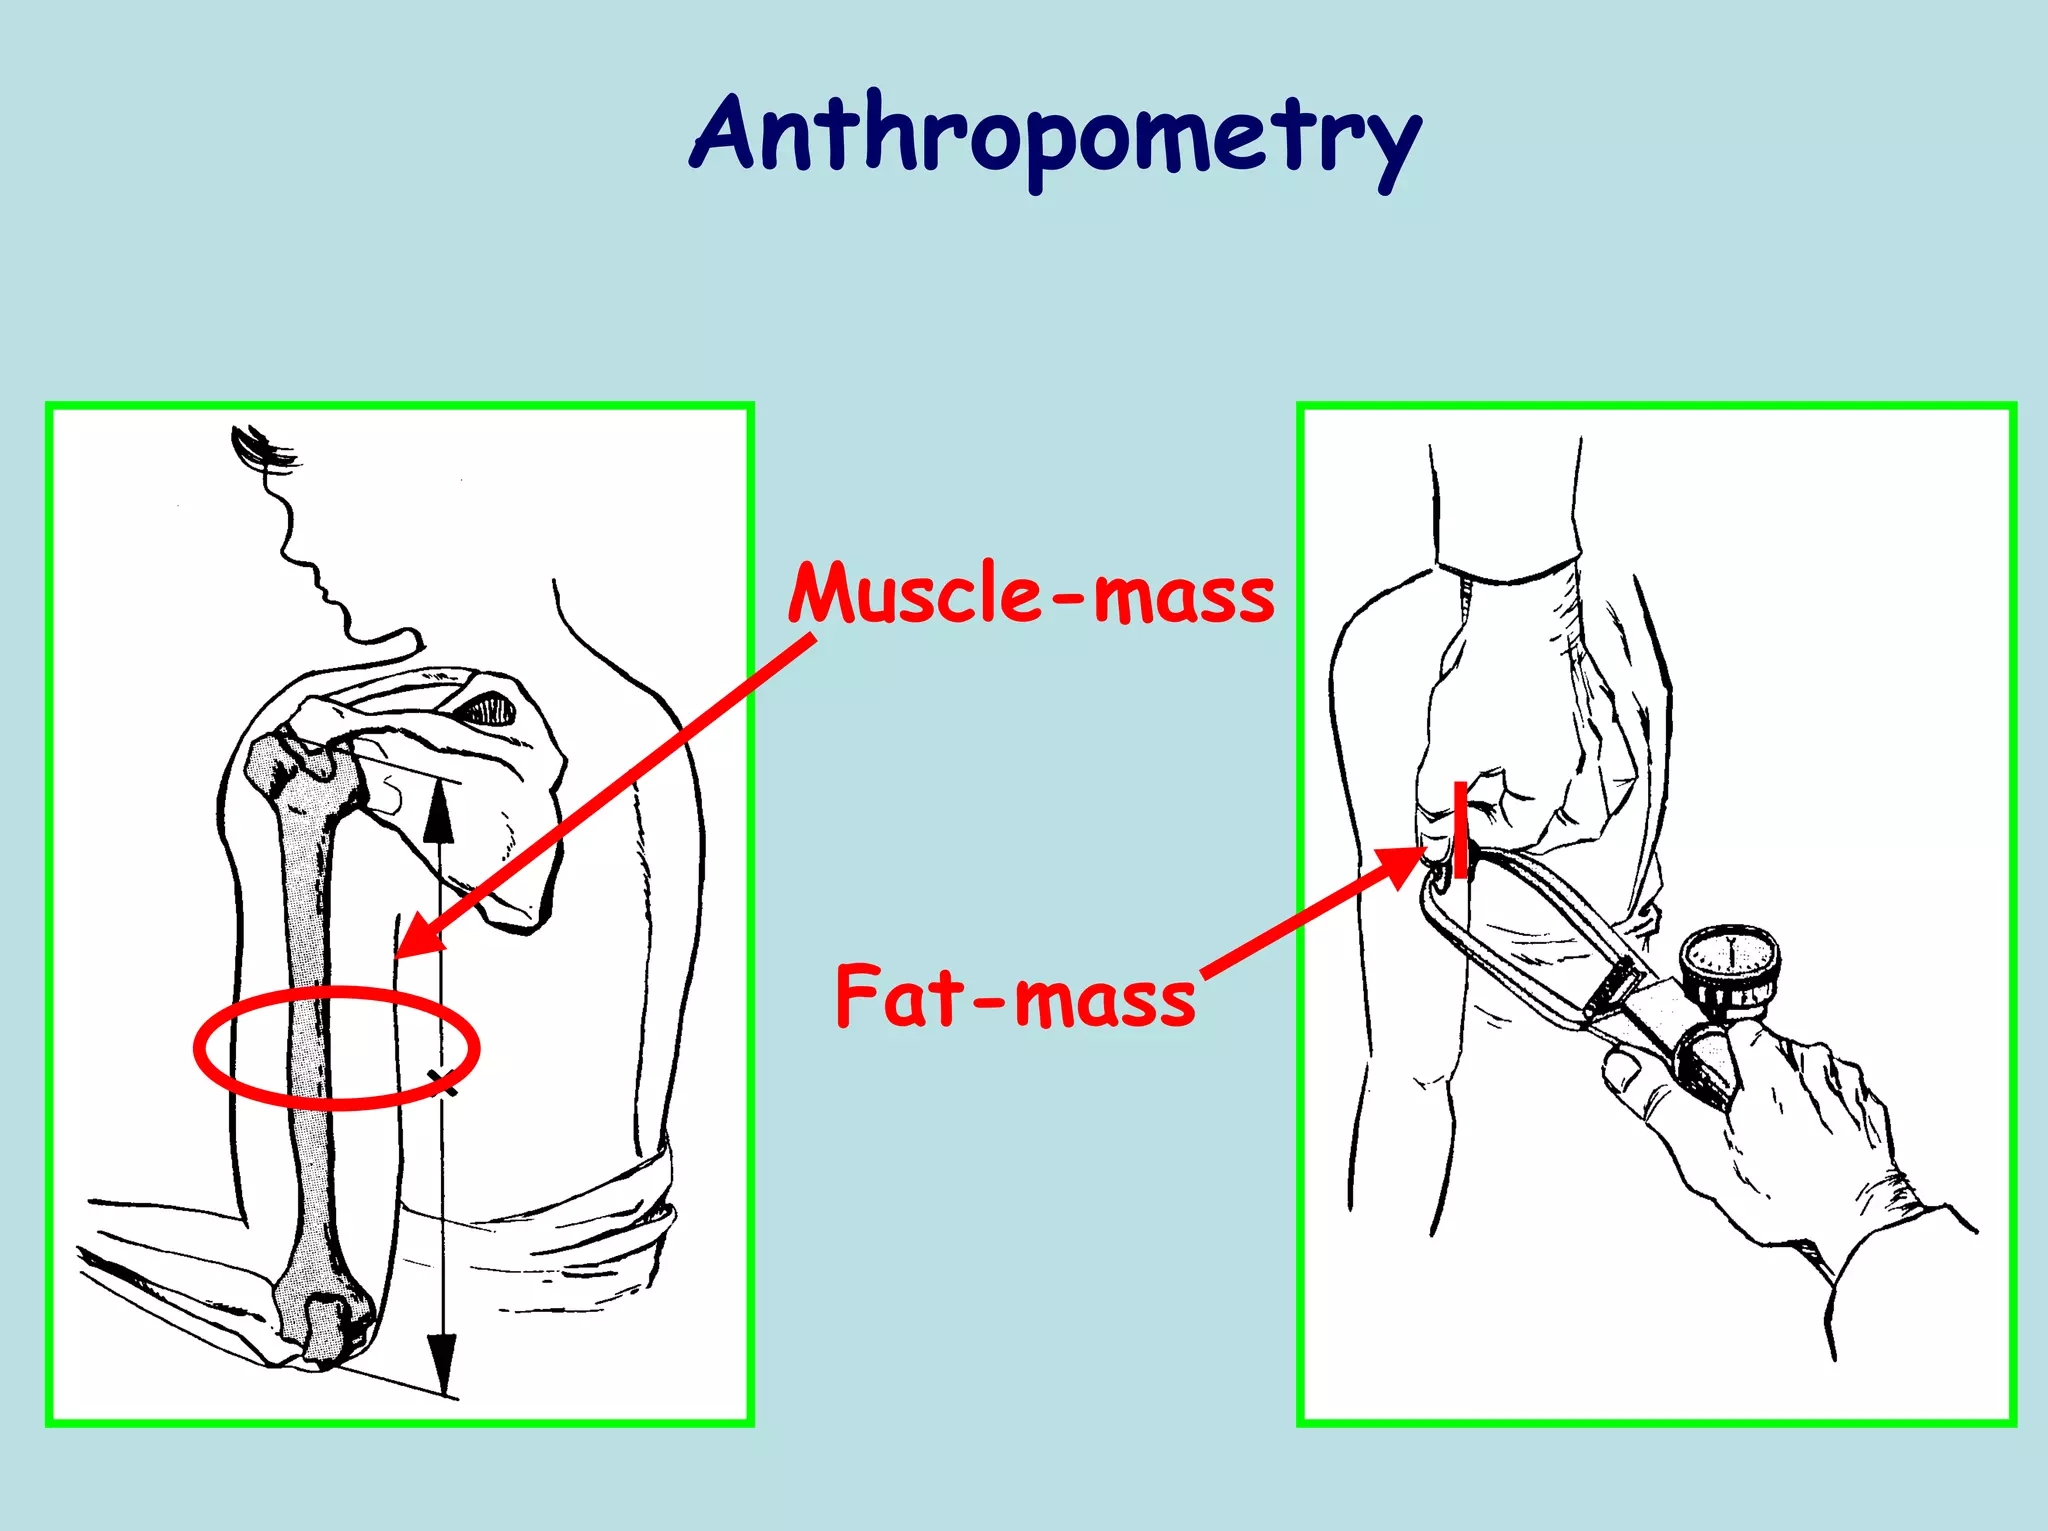
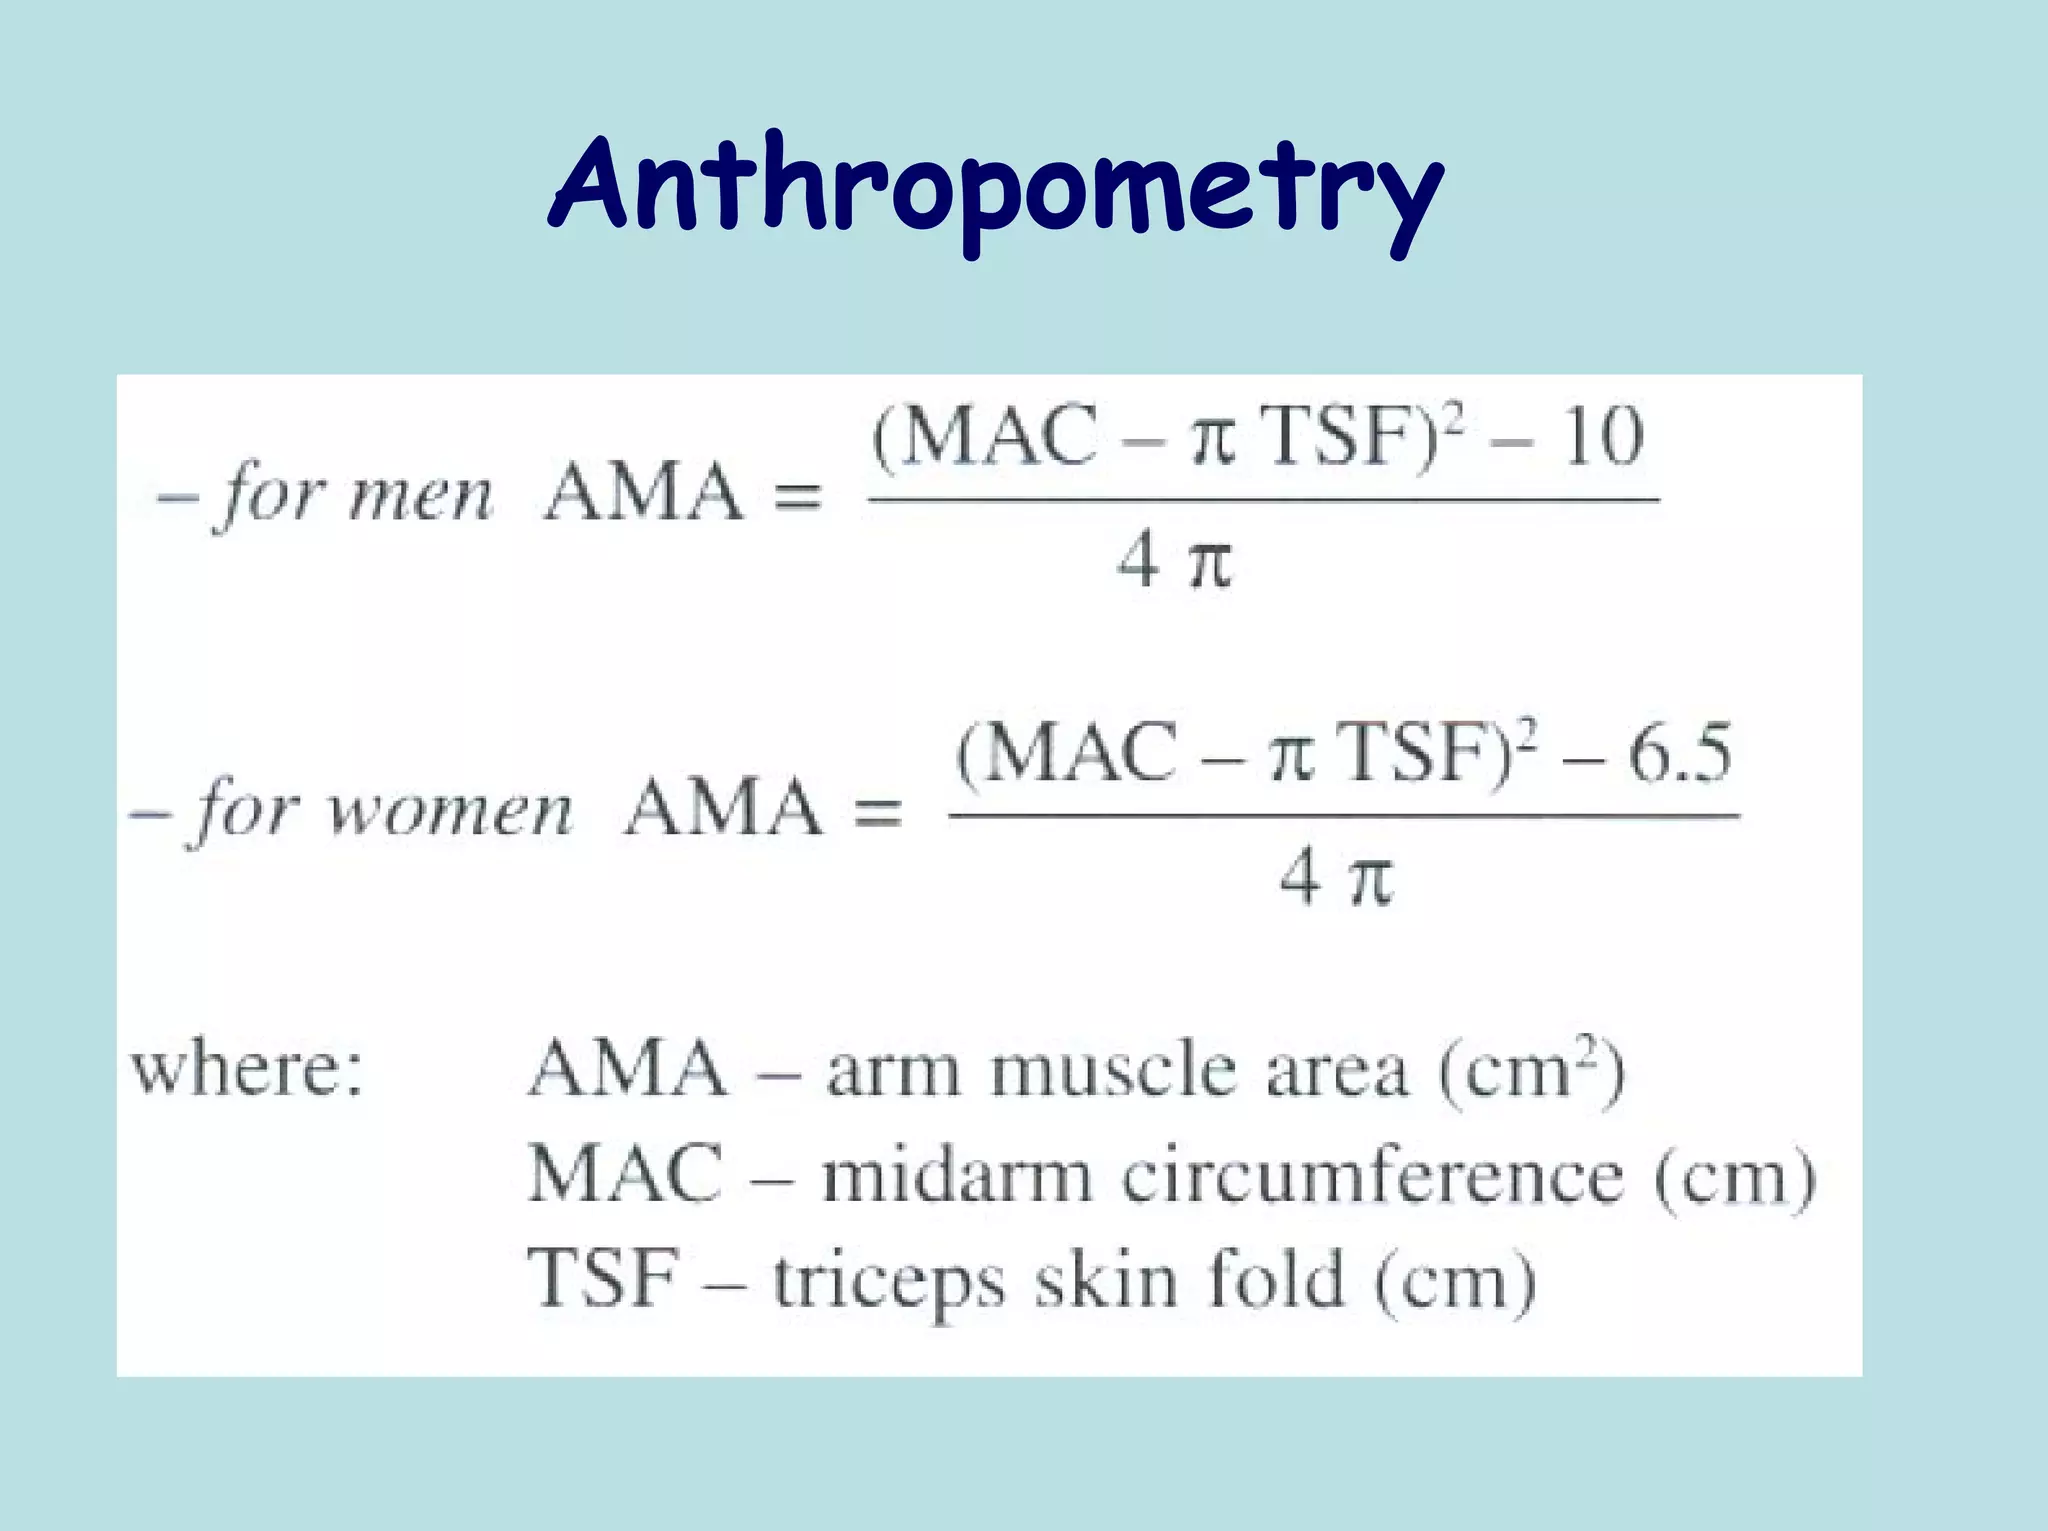

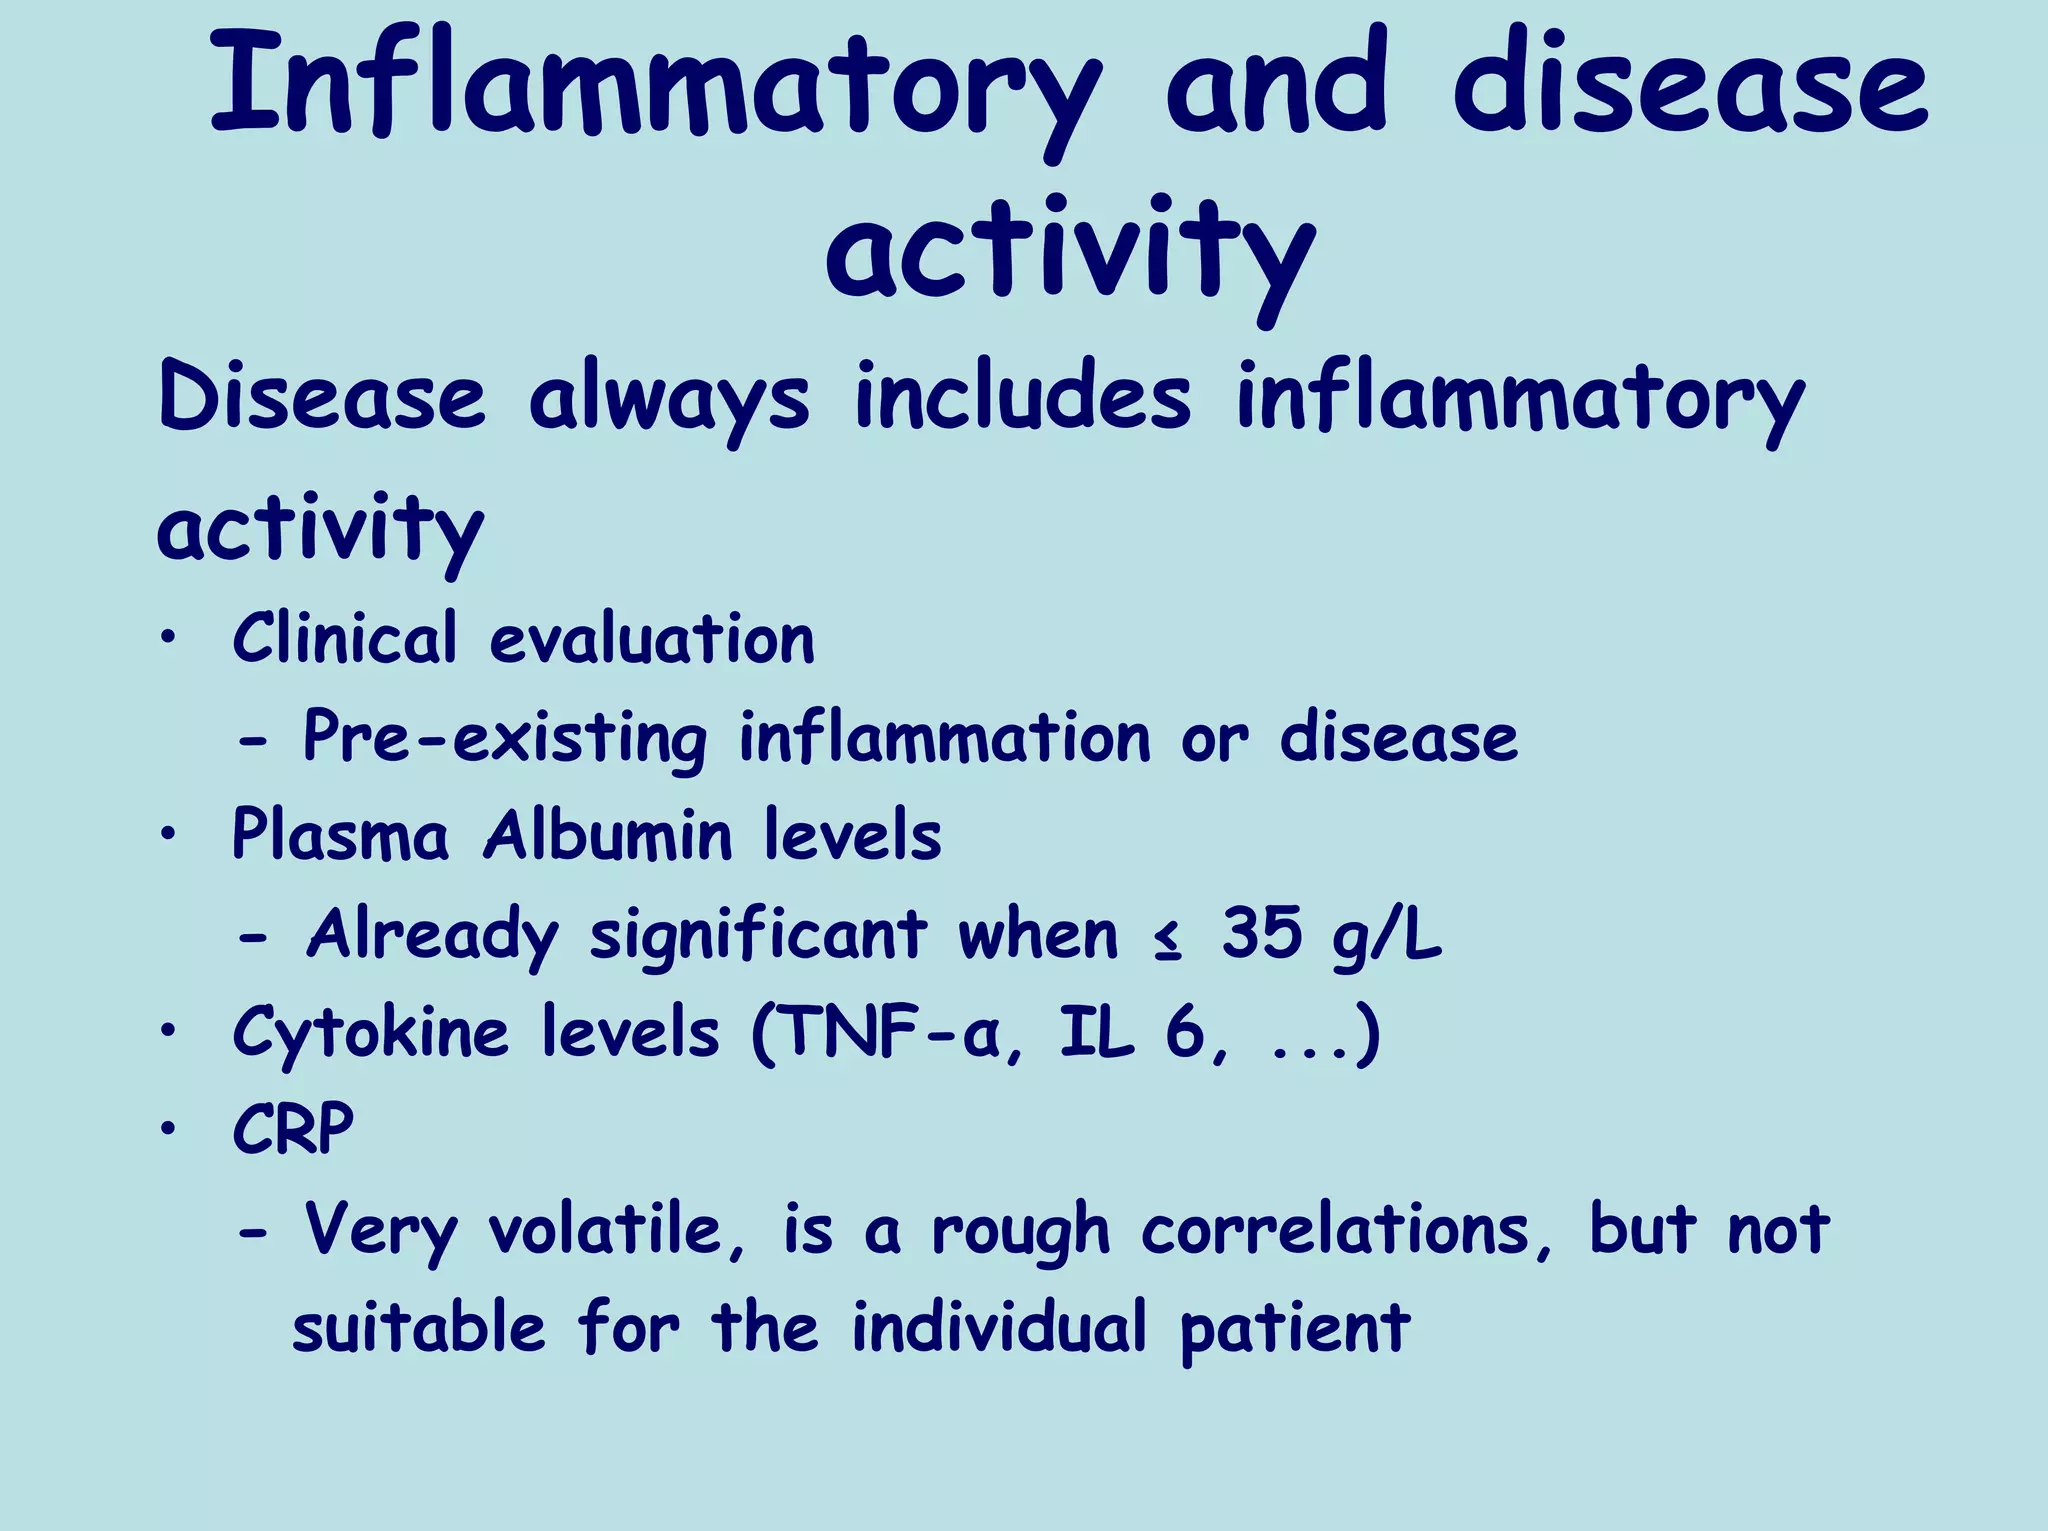
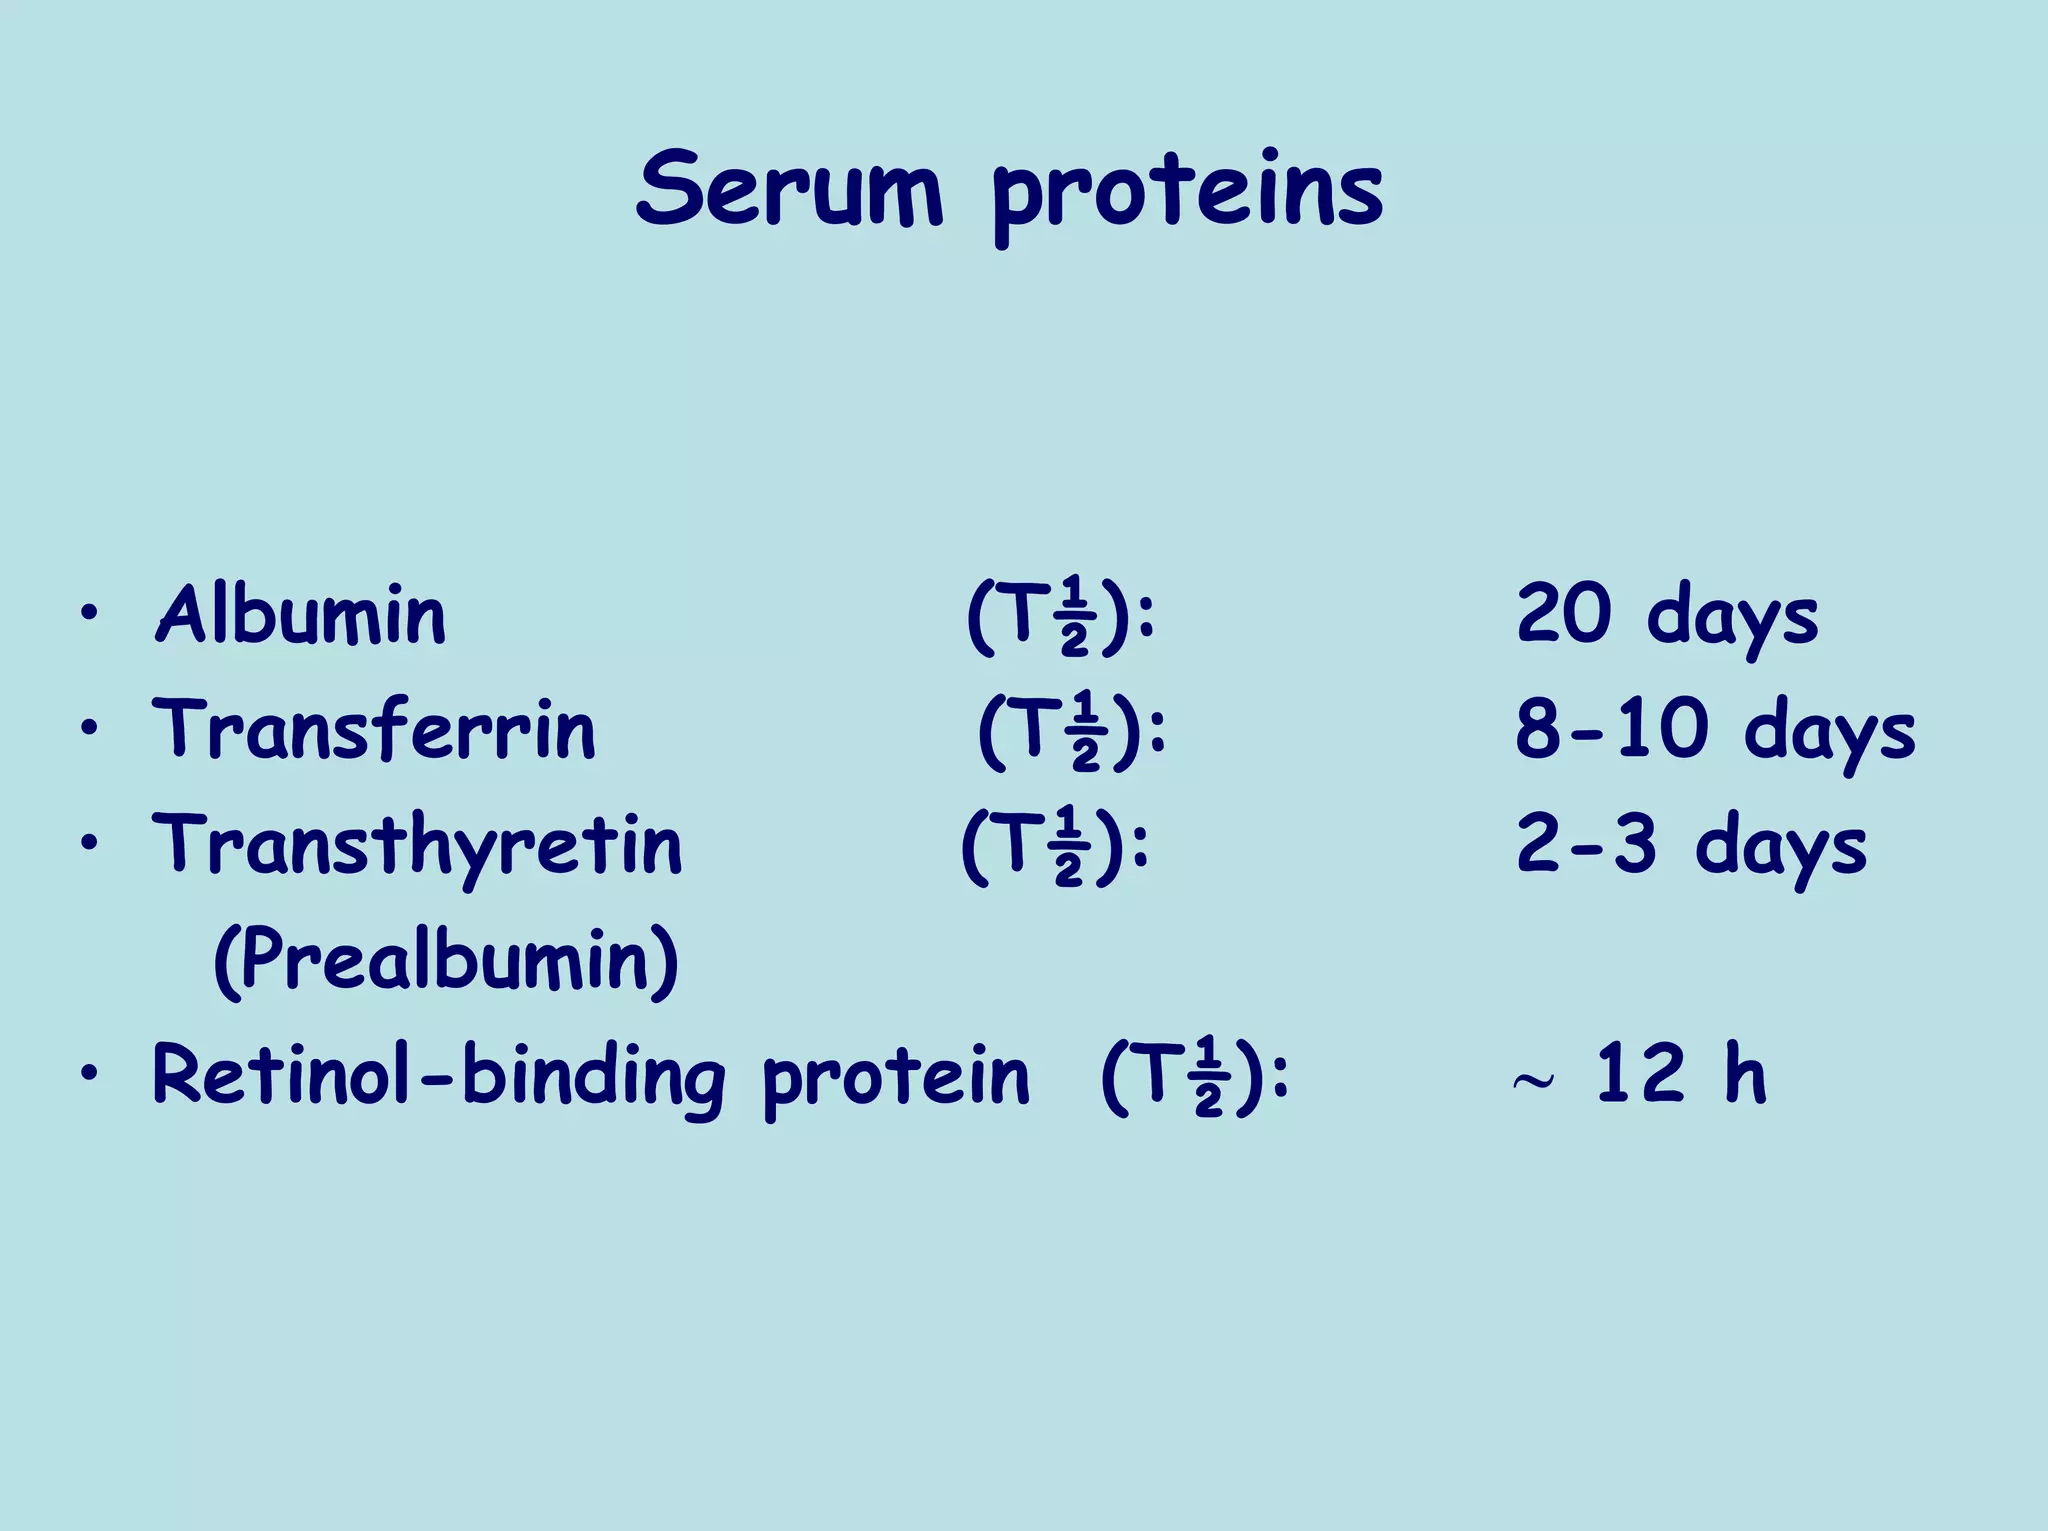

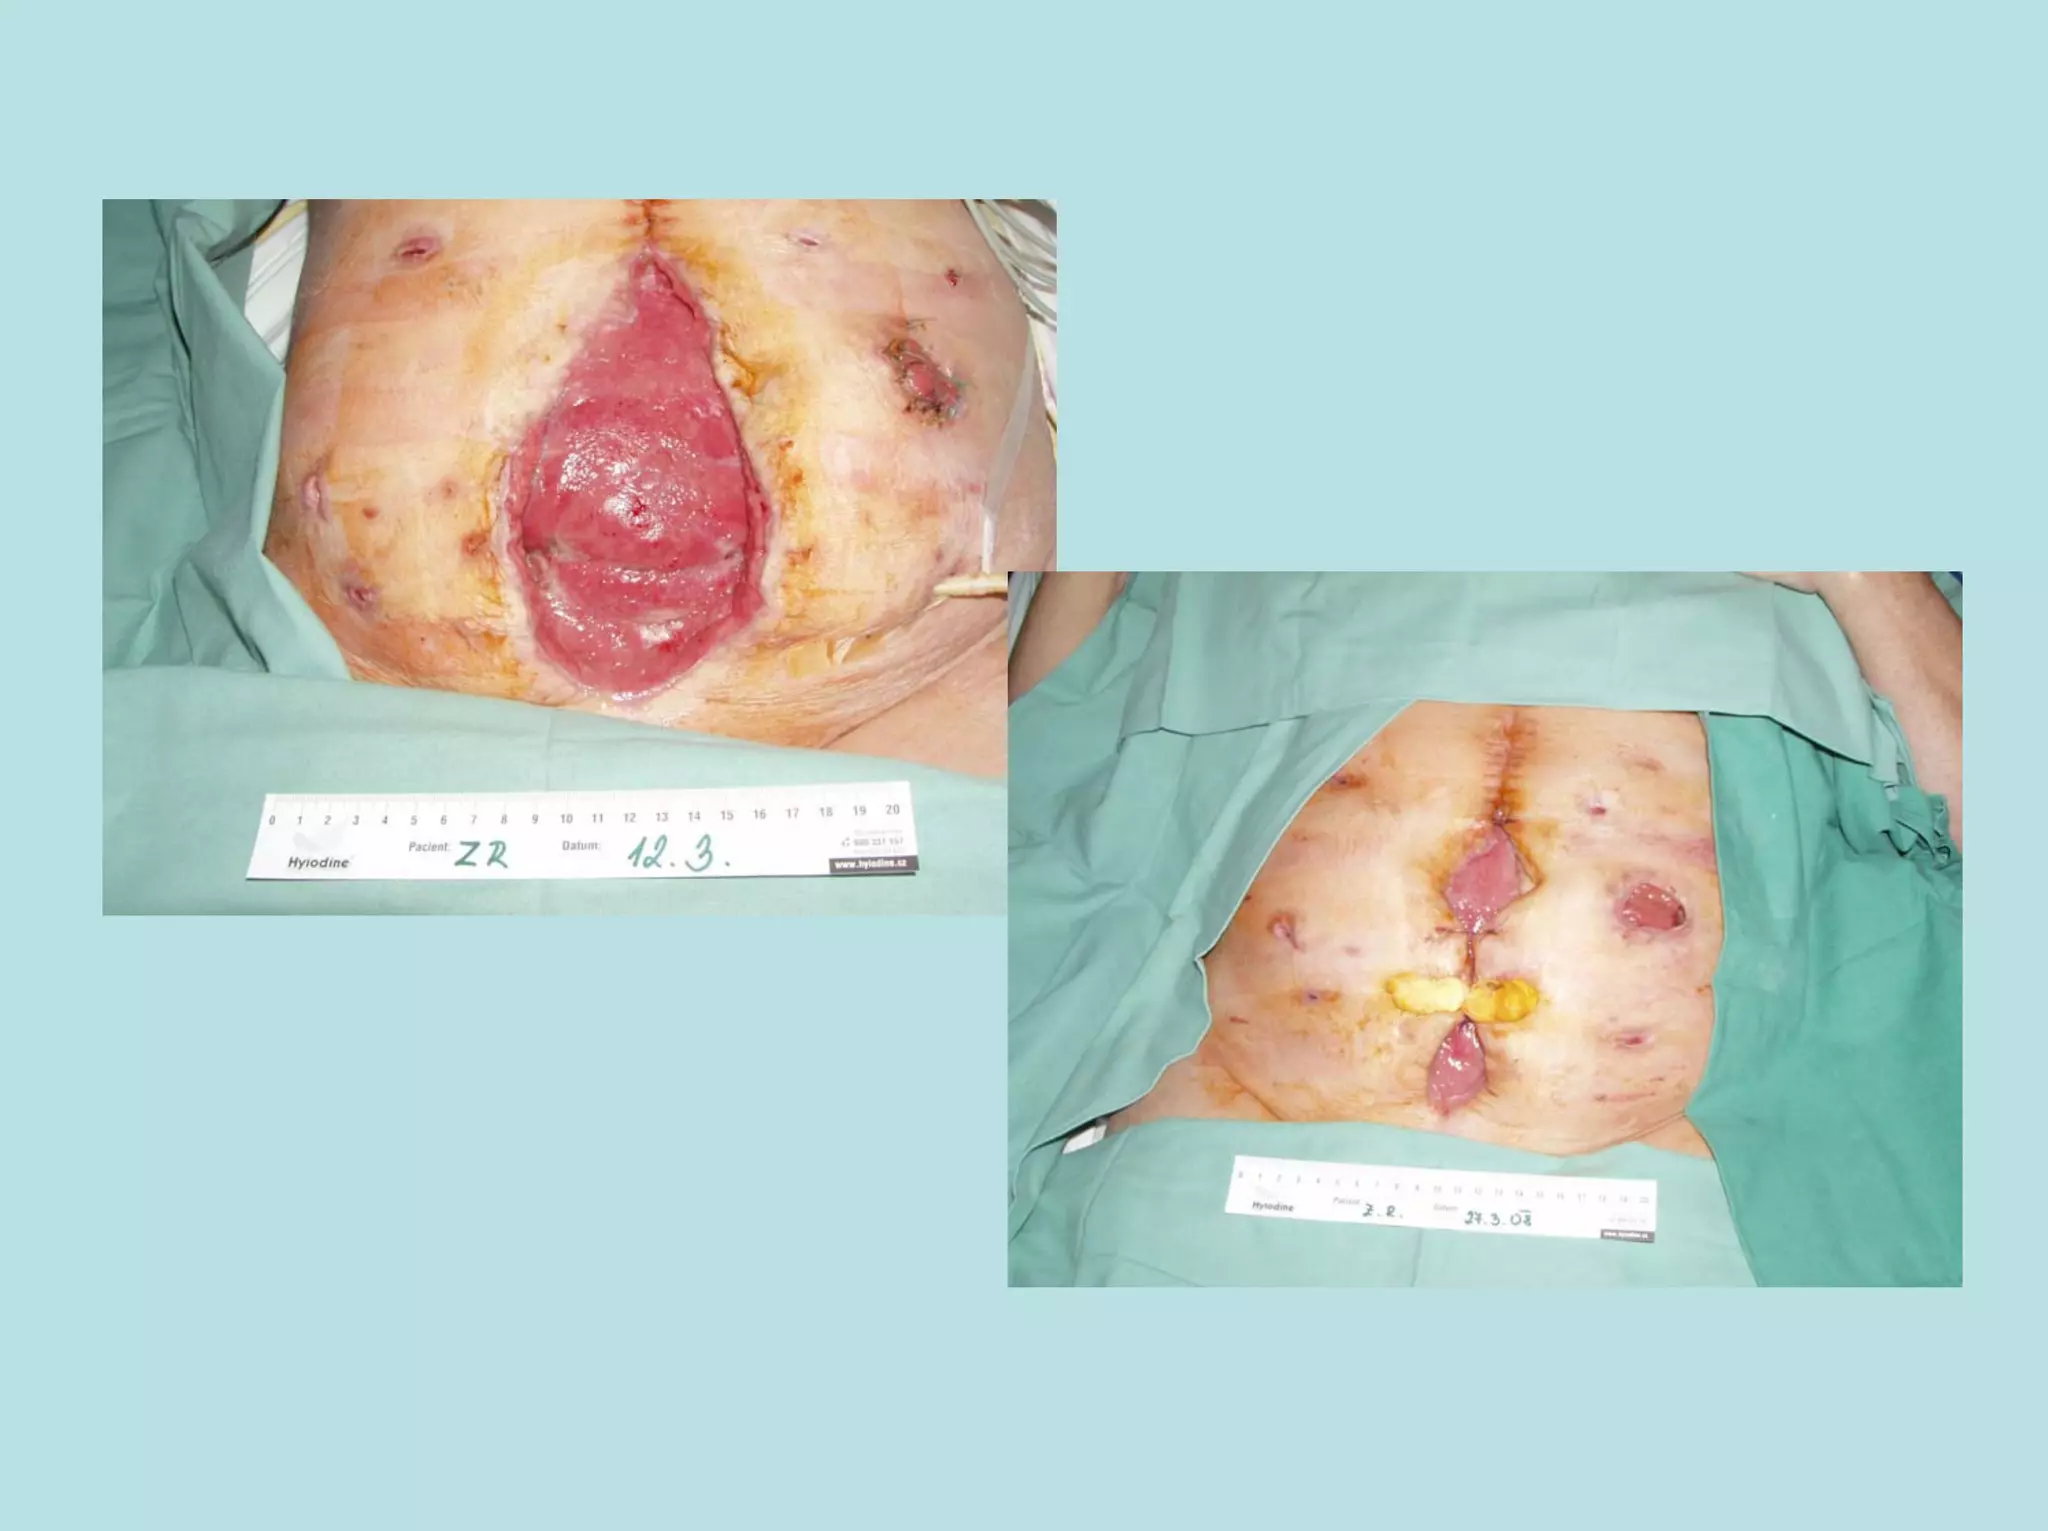


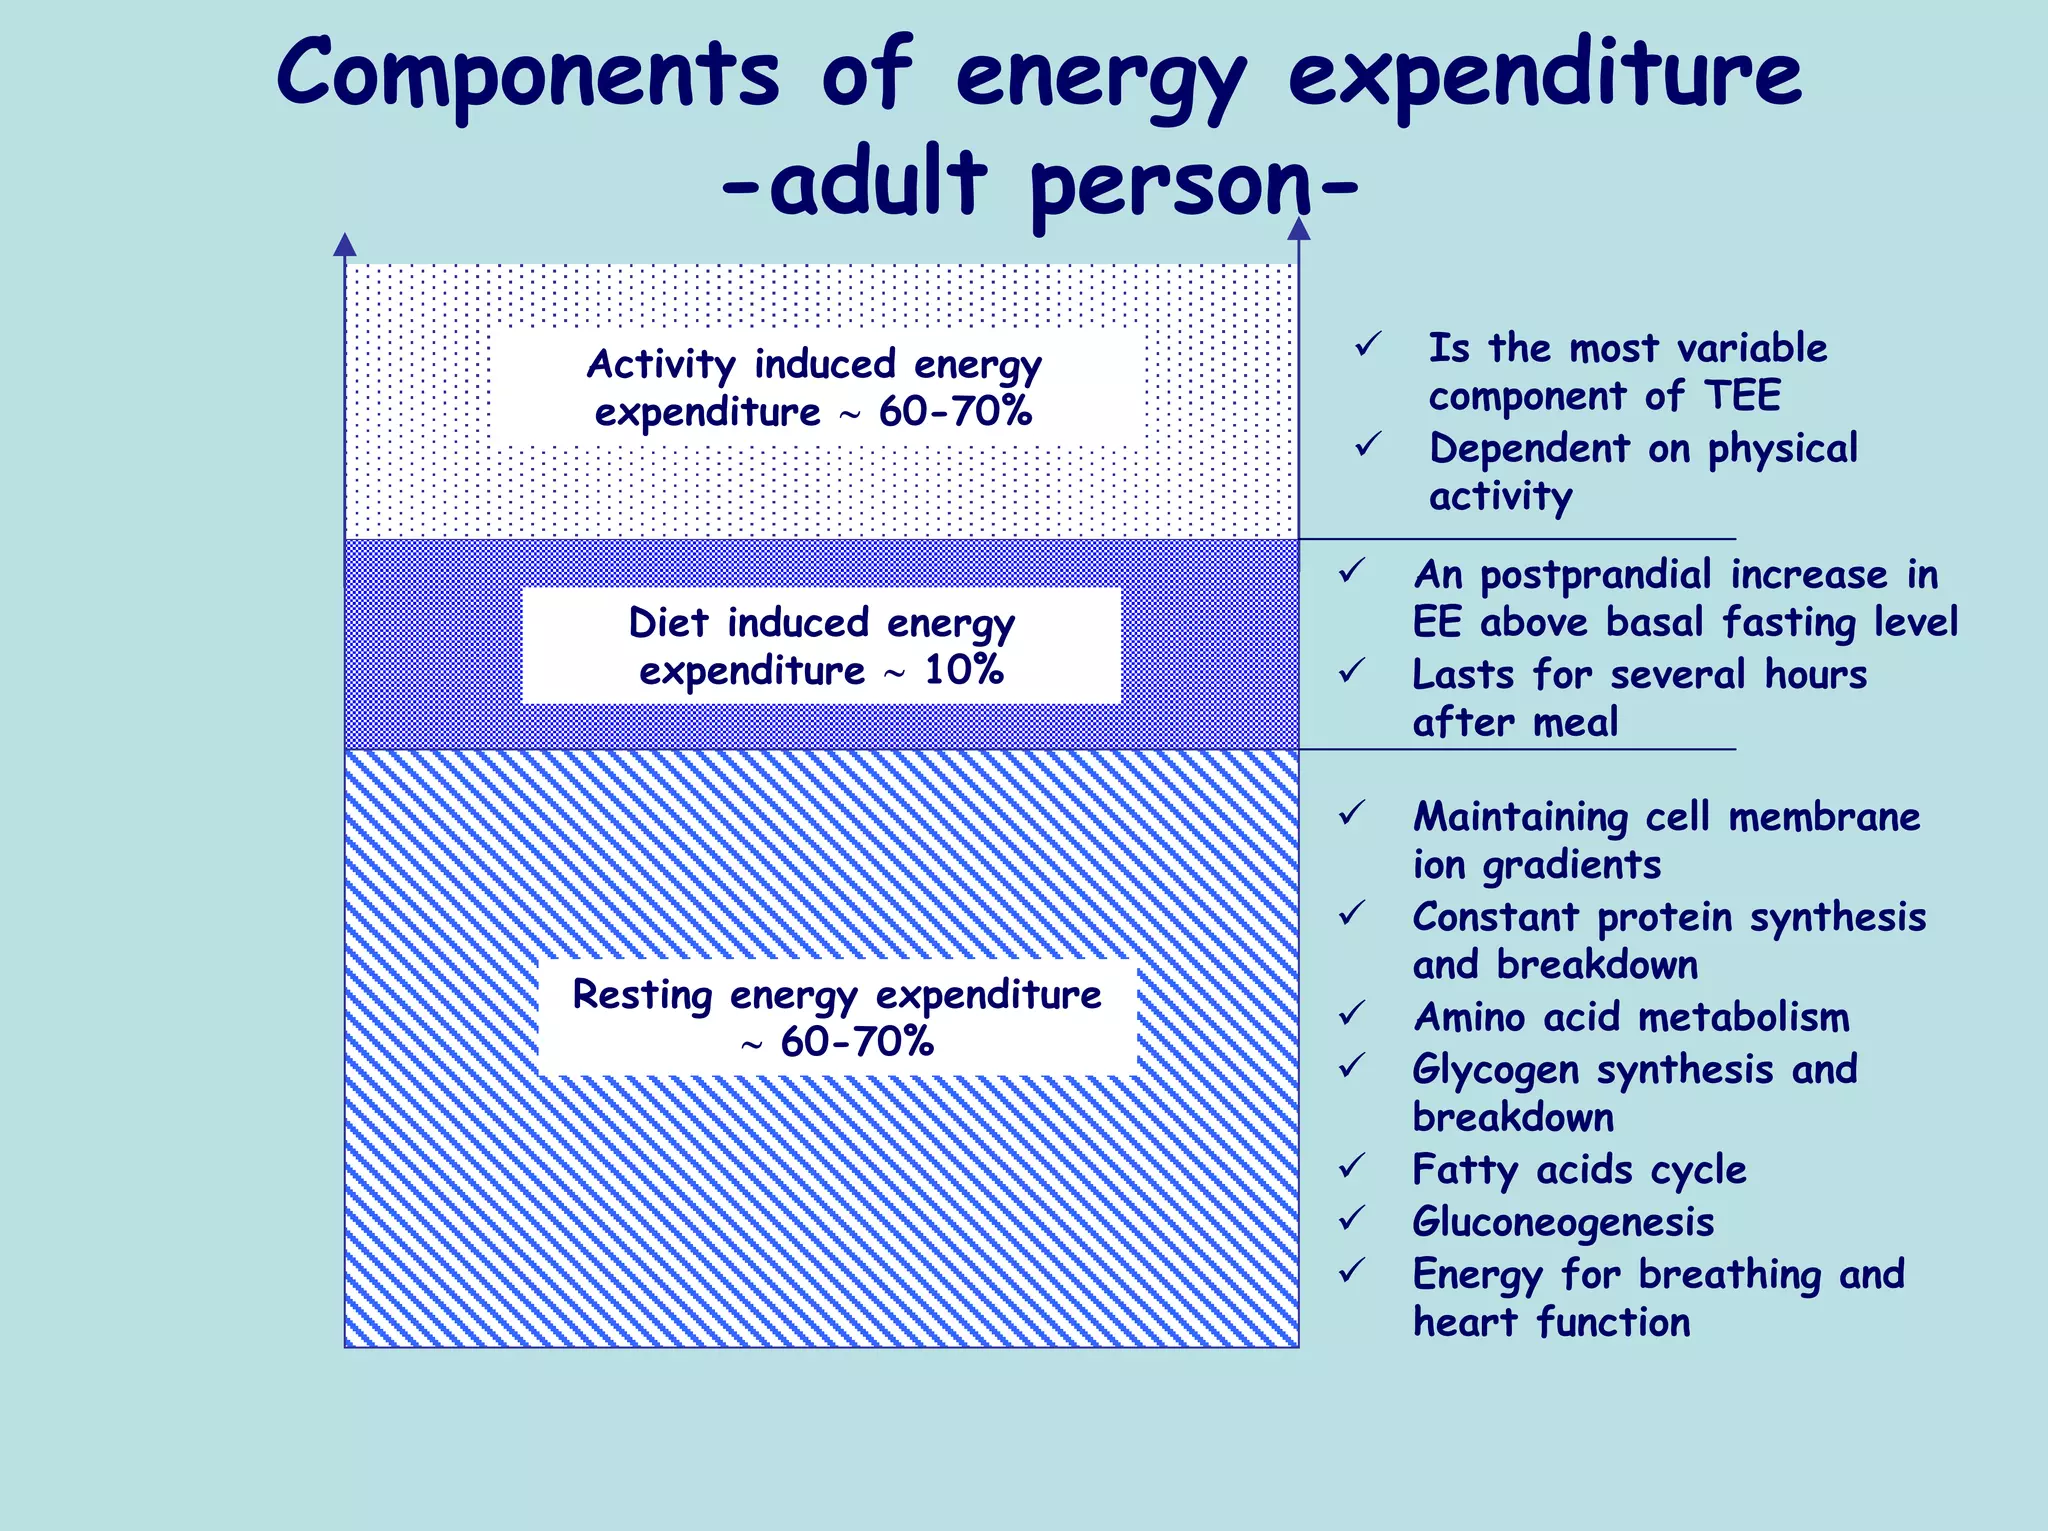
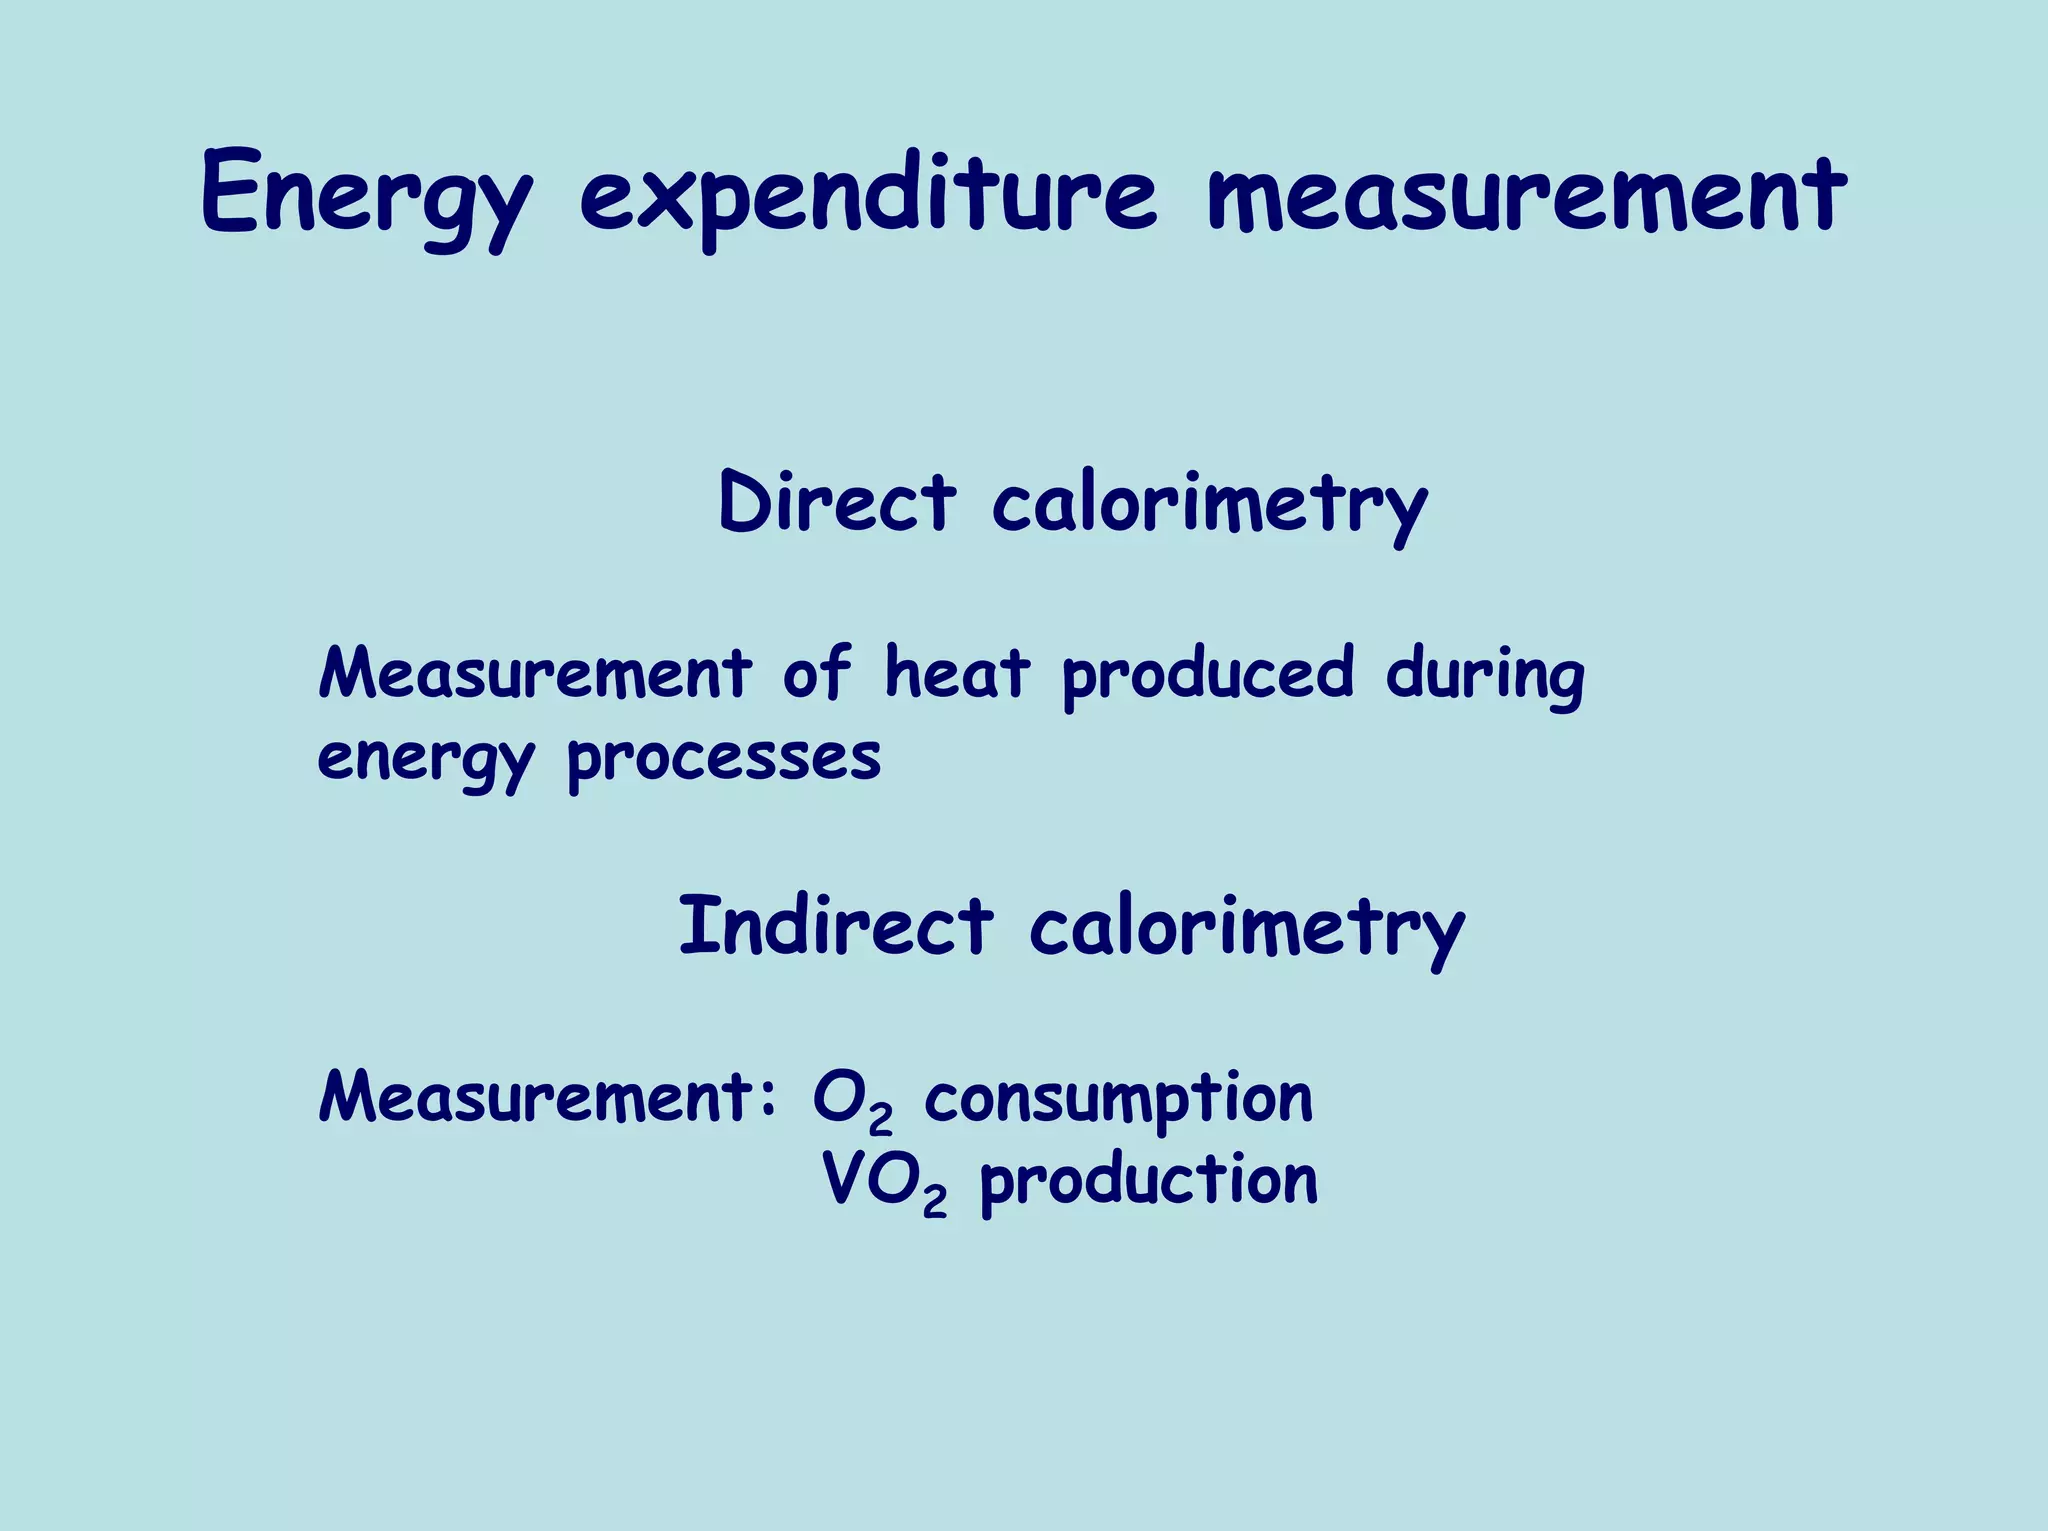
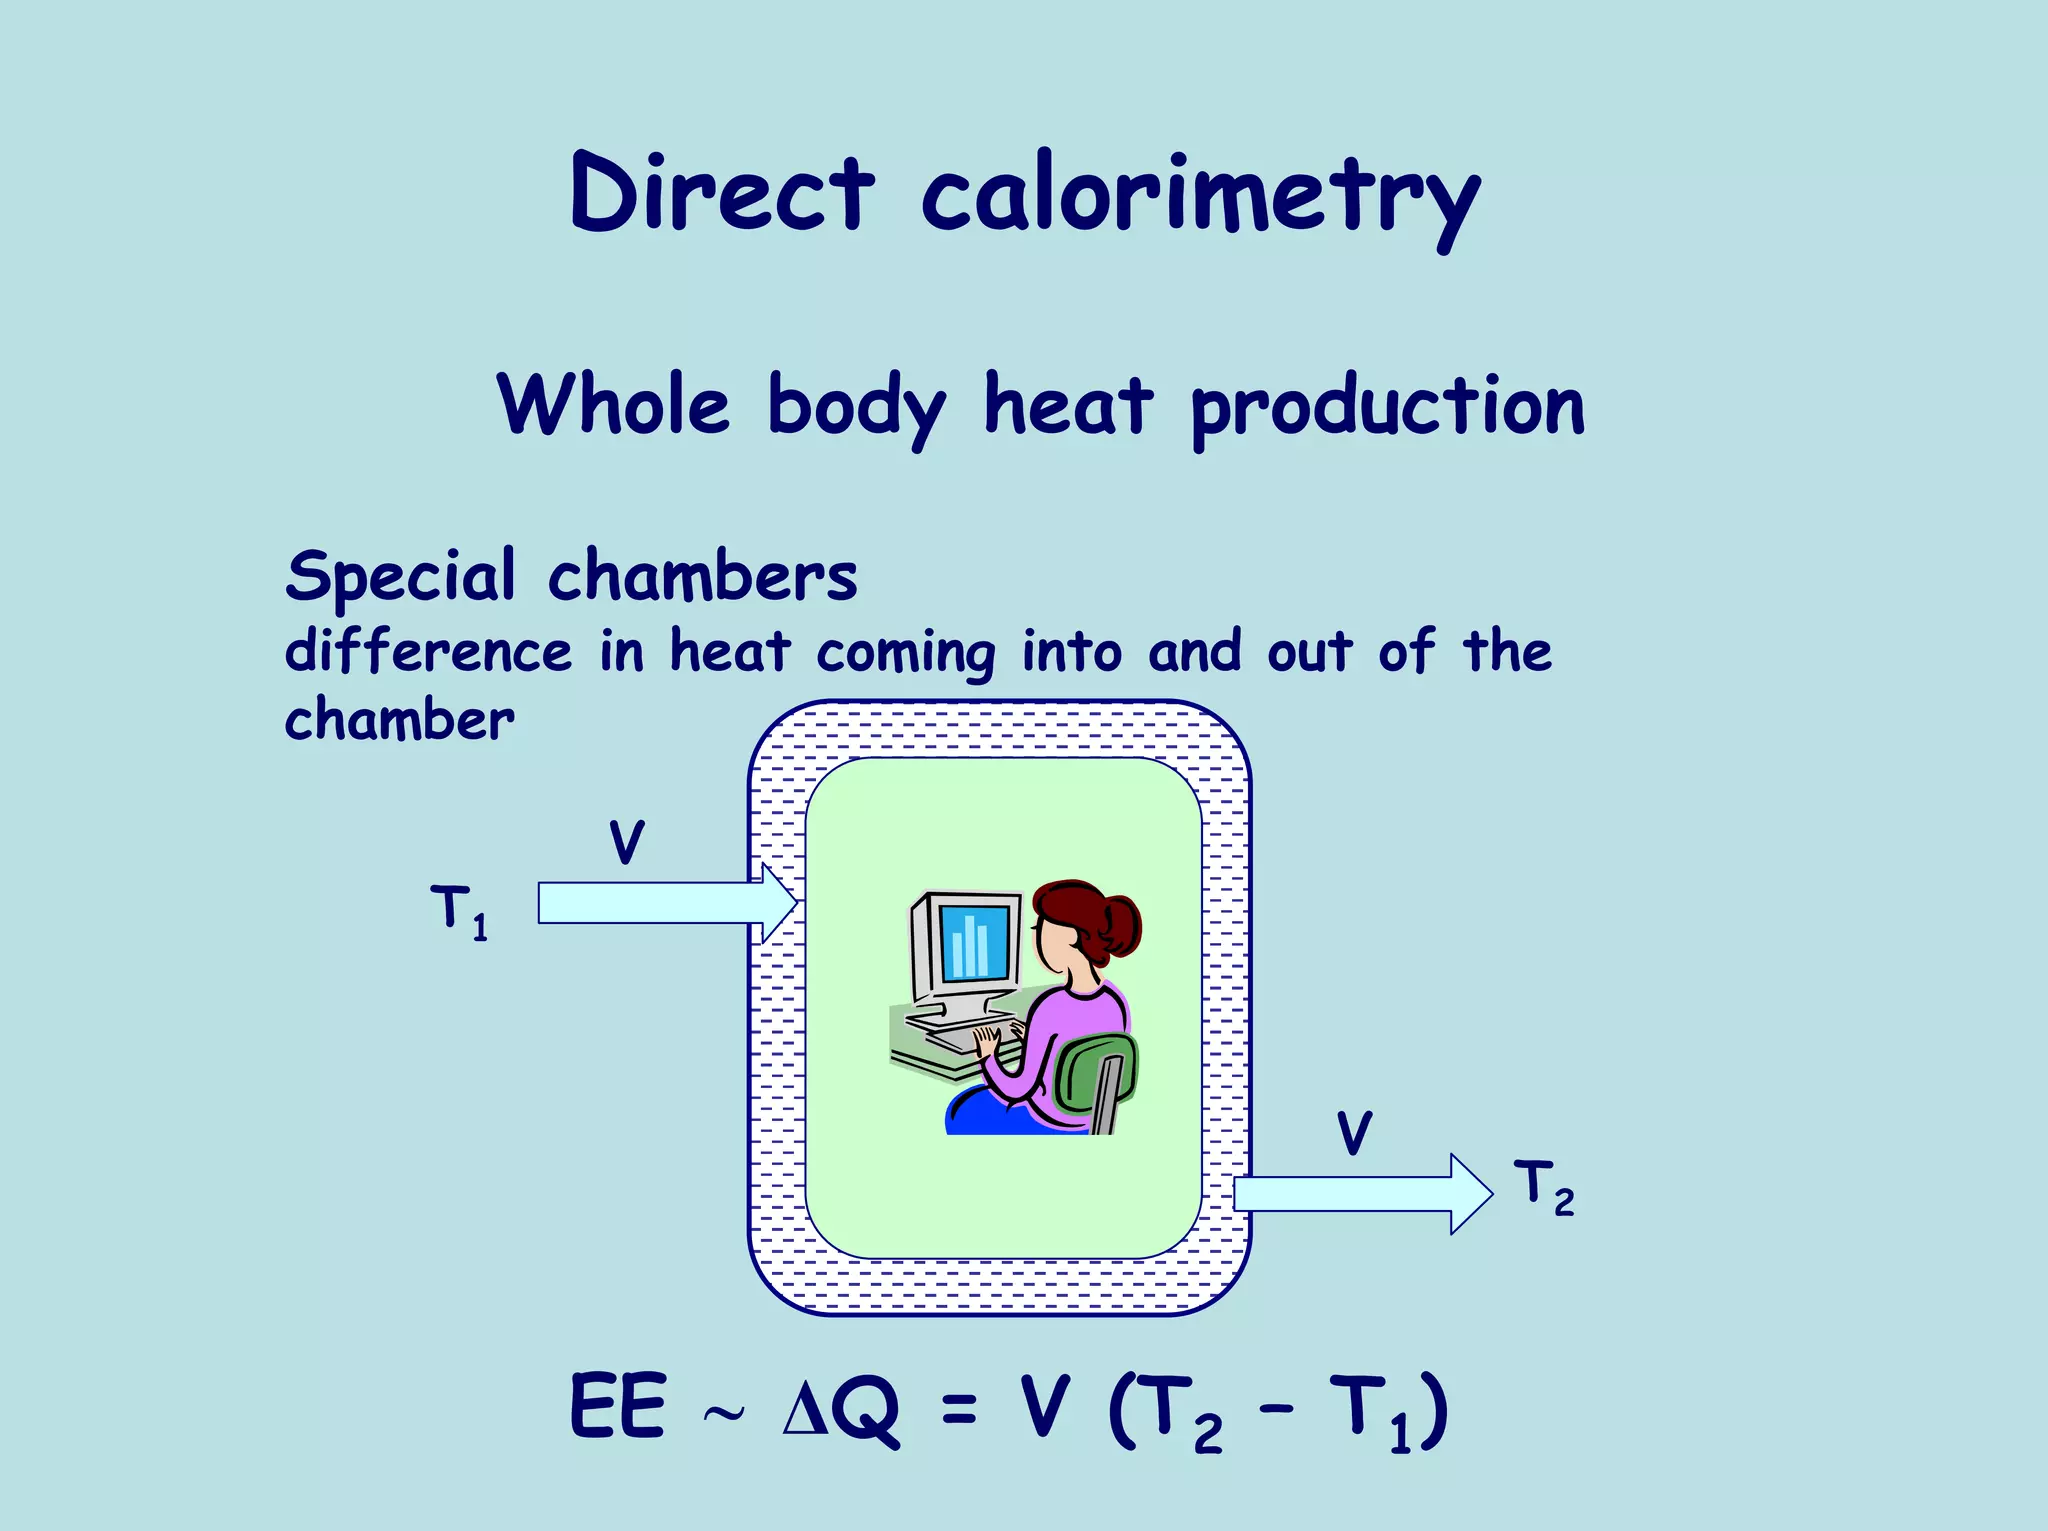
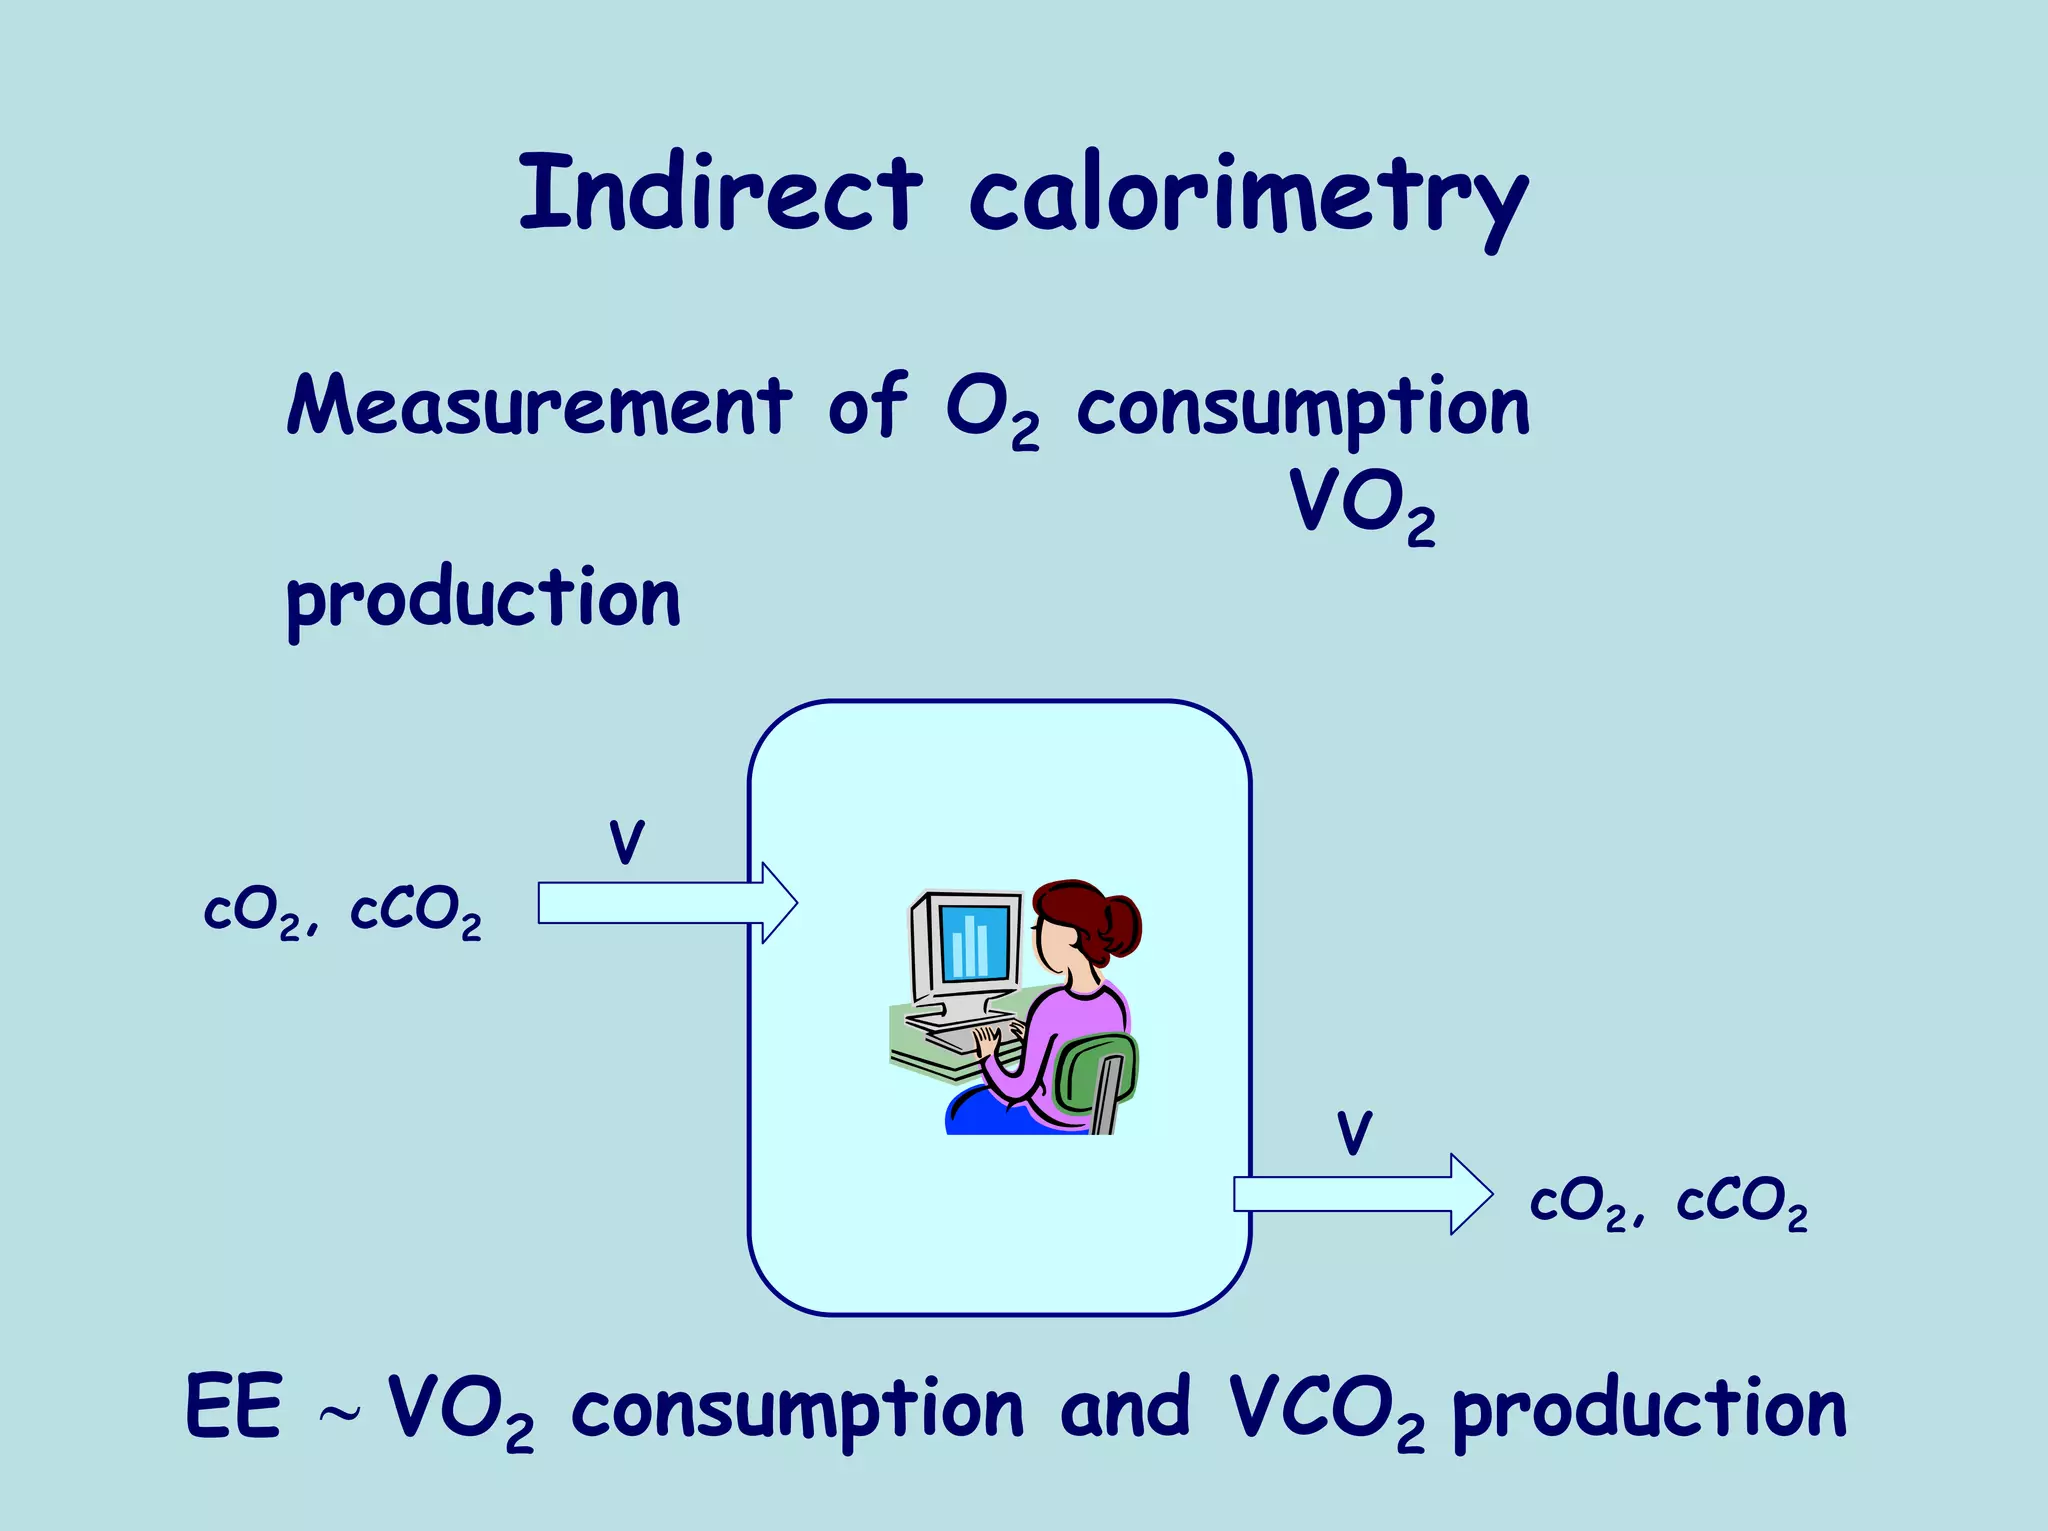
The document discusses principles of measuring energy expenditure and assessing nutritional status. It covers: - Components of energy expenditure including resting, diet, and activity induced expenditure - Methods to measure energy expenditure directly via calorimetry and indirectly via oxygen consumption and carbon dioxide production - Relationships between heart rate, energy expenditure, and respiratory quotient - Methods to assess body composition including anthropometry, bioelectrical impedance analysis, dual energy x-ray absorptiometry, and creatinine excretion - Factors that influence nutritional screening and assessment tools like disease activity and inflammation markers.


![Octahedral rhenium K4[Re6S8(CN)6] and Cu(OH)2cluster modifiedTiO2for the phot...](https://cdn.slidesharecdn.com/ss_thumbnails/appliedcatalysisageneral49920153238-171005000403-thumbnail.jpg?width=640&height=640&fit=bounds)
![Octahedral rhenium k4[re6 s8(cn)6] and](https://cdn.slidesharecdn.com/ss_thumbnails/octahedralrheniumk4re6s8cn6and-200110040250-thumbnail.jpg?width=640&height=640&fit=bounds)


