This paper discusses the implementation of multiple distributed generation (DG) planning in power distribution systems using an embedded meta ep-firefly algorithm (emefa) combined with artificial neural networks (ANN). The proposed method optimizes the weight of ANN to minimize distribution losses and meets specific penetration levels for DG installations, validated using the IEEE 69 bus test system. Results indicate that the emefa-ANN approach effectively reduces losses and enhances the overall efficiency of the distribution system.
![Indonesian Journal of Electrical Engineering and Computer Science
Vol. 7, No. 1, July 2017, pp. 1 ~ 8
DOI: 10.11591/ijeecs.v7.i1.pp1-8 1
Received March 7, 2017; Revised May 17, 2017; Accepted June 4, 2017
Multiple DG Planning Considering Distribution Loss
and Penetration Level using EMEFA-ANN Method
S. R. A. Rahim*
1
, I. Musirin
2
, M. M. Othman
3
, M. H. Hussain
4
1,4
School of Electrical System Engineering, Universiti Malaysia Perlis (UniMAP), 02600, Arau, Perlis,
Malaysia
2,3
Center for Electrical Power Engineering Studies, Faculty of Electrical Engineering, Universiti Teknologi
MARA, 40450 Shah Alam, Malaysia
Corresponding author, e-mail: rafidah@unimap.edu.my*
1
, ismailbm@salam.uitm.edu.my
2
,
mamat505my@yahoo.com
3
, muhdhatta@unimap.edu.my
4
Abstract
This paper presents the implementation of multiple distributed generations planning in distribution
system using computational intelligence technique. A pre-developed computational intelligence
optimization technique named as Embedded Meta EP-Firefly Algorithm (EMEFA) was utilized to determine
distribution loss and penetration level for the purpose of distributed generation (DG) installation. In this
study, the Artificial Neural Network (ANN) was used in order to solve the complexity of the multiple DG
concepts. EMEFA-ANN was developed to optimize the weight of the ANN to minimize the mean squared
error. The proposed method was validated on IEEE 69 Bus distribution system with several load variations
scenario. The case study was conducted based on the multiple unit of DG in distribution system by
considering the DGs are modeled as type I which is capable of injecting real power. Results obtained from
the study could be utilized by the utility and energy commission for loss reduction scheme in distribution
system.
Keywords: artificial neural network, DG planning, distributed generation, embedded Meta EP-firefly
algorithm, penetration level, distribution loss
Copyright © 2017 Institute of Advanced Engineering and Science. All rights reserved.
1. Introduction
DG is an emerging approach that is well known in electric power system recently.
Nevertheless, the researcher and utility engineer have a lot of problem that need to be
concerned in the DG allocation problem. DG units need to be strategically placed in distribution
systems in order to obtain the maximum output from the DG installation. Improper sizing and
placement of DG may result overcompensation or under compensation [1-2]. Consequently, the
factors of the best location and sizing are among the crucial issues in the implementation of
distributed generation in the distribution system. Therefore, it is necessary to develop an
optimization or heuristic technique based methodology to identify the optimal placement of
distributed renewable generation for a given system that can provide economic, environmental
and technical advantages [3-5]. There are several researches that study on the optimal
distributed renewable generation location by their imposed constraints and objectives. However,
the systematic principle for this issue is still an unsolved problem [6]. The integration of multiple-
DG units cannot be handled simply as well as single-DG because of the complex structures of
power networks, despite of these different techniques. Consequently, researchers have started
to use intelligent techniques such as Genetic Algorithm [7], Evolutionary Programming (EP) [8],
Particle Swarm Optimization [9] and Firefly Algorithm (FA) [10], fuzzy logic [11] and ANN [12] to
solve the problem.
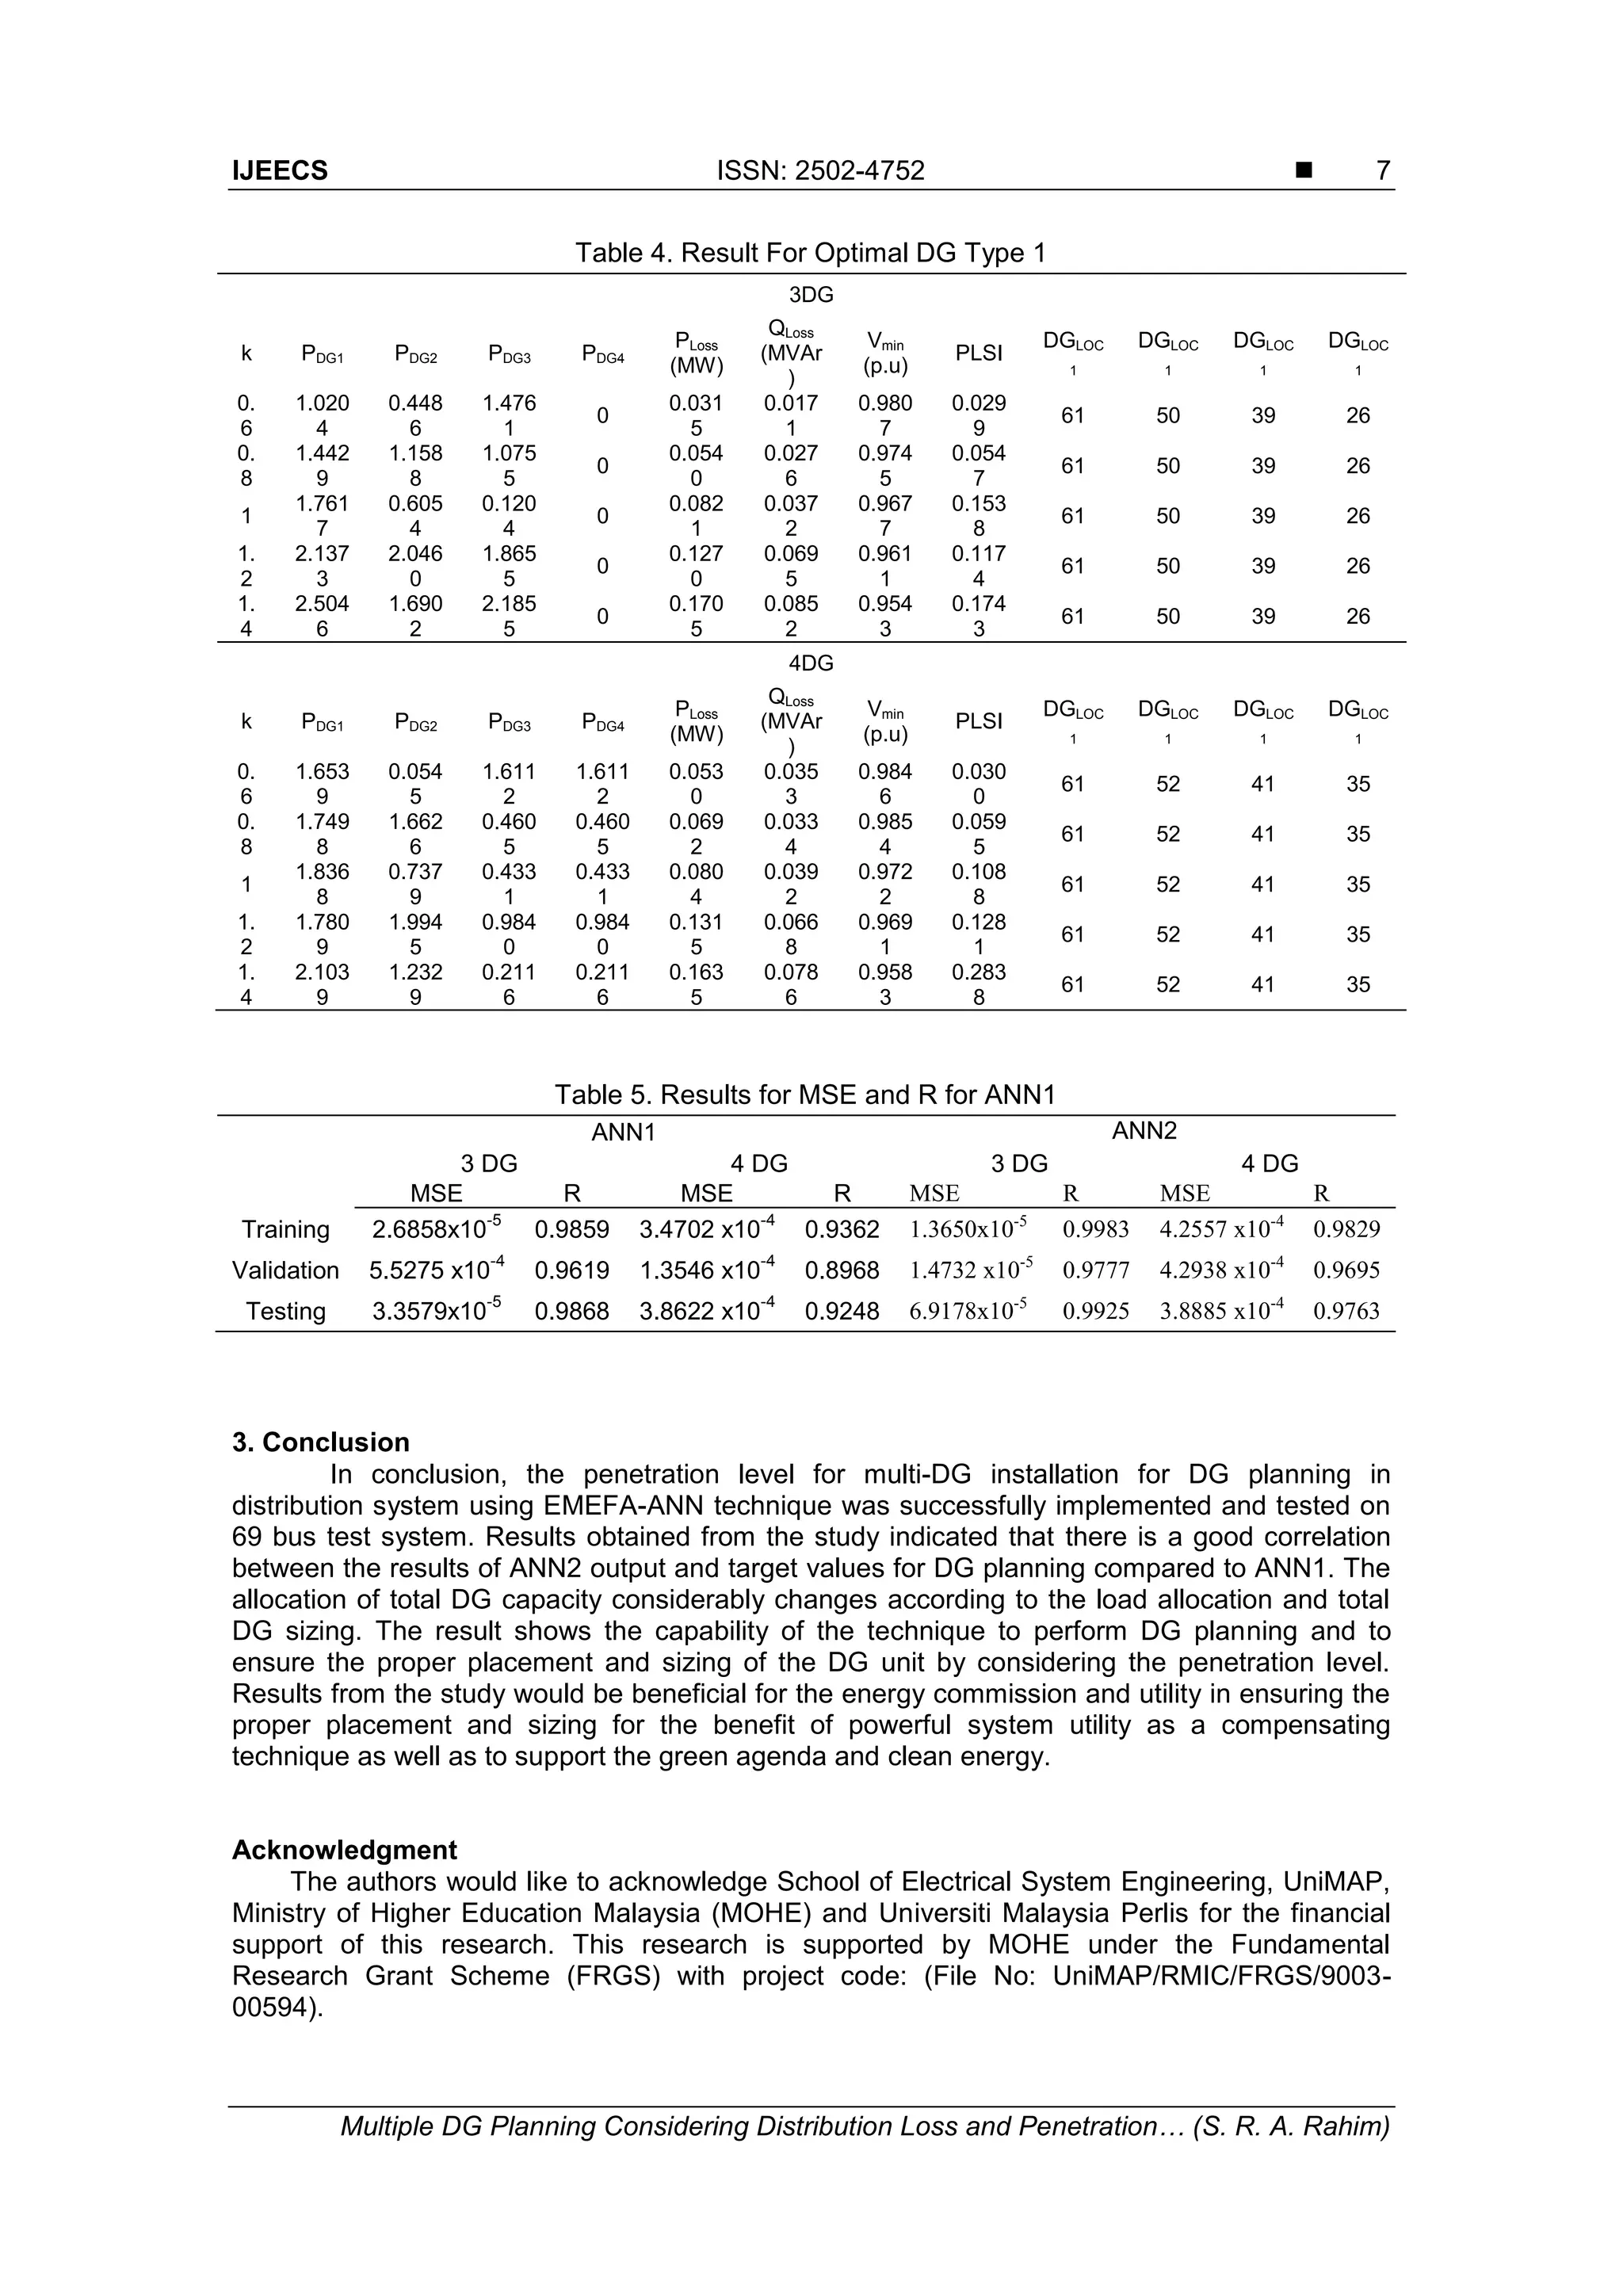
This paper presents the effect of multiple DG installation considering loss minimization
and the penetration level in distribution system. The proposed EMEFA-ANN was utilized to
optimize the weight of the ANN to minimize the mean squared error (MSE). Results indicated
that the proposed EMEFA-ANN has achieved better MSE error. The loss equation is used to
determine the optimal size of DG by using the computational intelligence technique and it is
necessary to consider the reduction of I
2
R loss in order to obtain the efficient power delivery in](https://image.slidesharecdn.com/0116286-32182-1-smmultipleedit-201014042302/75/01-16286-32182-1-sm-multiple-edit-1-2048.jpg)
![ ISSN: 2502-4752
IJEECS Vol. 7, No. 1, July 2017 : 1 – 8
2
the distribution system. The loss associated with the active and reactive power components of
branch currents is given by (1).
sincos
1 1
n
i
n
j
jiji
ji
jiij
jiji
ji
iij
loss QPPQ
VV
R
QQPP
VV
R
P
(1)
Where Pi and Qi are the real and reactive power of bus i respectively, Pj and Qj are the
real and reactive power of bus j respectively, Rij is the line resistance between bus i and bus j, Vi
and Vj are the voltage magnitude of bus i and bus j respectively, and δi and δj are the voltage
angle of bus i and bus j respectively. Table 1 indicates the DG type and the variable of the DG
modelling for optimization. Equation (2) and (3) shows the setting of voltage limit and loss
reduction limit respectively. The results of power losses must be less than without DG sources
or in base case.
upVup .05.1.95.0 min (2)
(3)
(4)
P
Max
DGloss
nDG
i
p
(5)
nbus
i
i
demand
Max
DG PP %80
(6)
Table 1. DG Type and The Variable Of The DG Modelling For Optimization
The proposed technique was tested on the IEEE 69 bus test systems in order to
validate the technique. The case study was conducted based on the multiple unit of DG in
distribution system by considering the DGs are modelled as type I. The power factor of the
system was set to be 0.85 based on IEEE standard and energy commission [13]. The analysis
was done by setting the voltage limit to an acceptable value. The Ploss is also refer as δloss to
demonstrate the total loss in the system. With regard to DG penetration, the total amount of DG
active power in the network must not exceed 0.8 times the total system demand. In this study,
the variation of active and reactive load as shown in (7) and (8) with respect to the load factor k.
The penetration level sensitivity index (PLSI) was derived from the loss equation and
penetration level calculated in the system. Penetration level refers to the capacity of DG to be
installed with respect to the total load in the system. The general mathematical equation is given
by (9). Equation (10) shows the formulation of the penetration level of DG at bus n. In this study,
DGwithoutDGwith
lossloss PP
lossloss P
DG Type DG Modelling
Type I:
DG capable of injecting real power only, like photovoltaic, fuel cells etc. is the
good examples of type-I DG.
xi = Pg (MW)
Type II: DG capable of injecting reactive power only to improve the voltage
profile fall in type-II DG, e.g. kvar compensator, synchronous compensator,
capacitors etc.
xi = Qg (MVAr)
Type III:
DG capable of injecting both real and reactive power, e.g. synchronous
machines.
xi = Pg (MW)
Qg = Pg × tan-1
θ (MVAr)
Type IV:
DG capable of injecting real but consuming reactive power, e.g. induction
generators used in the wind farms.
xi = Pg (MW)
Qg = - Pg × tan-1
θ (MVAr)](https://image.slidesharecdn.com/0116286-32182-1-smmultipleedit-201014042302/75/01-16286-32182-1-sm-multiple-edit-2-2048.jpg)
![ ISSN: 2502-4752
IJEECS Vol. 7, No. 1, July 2017 : 1 – 8
4
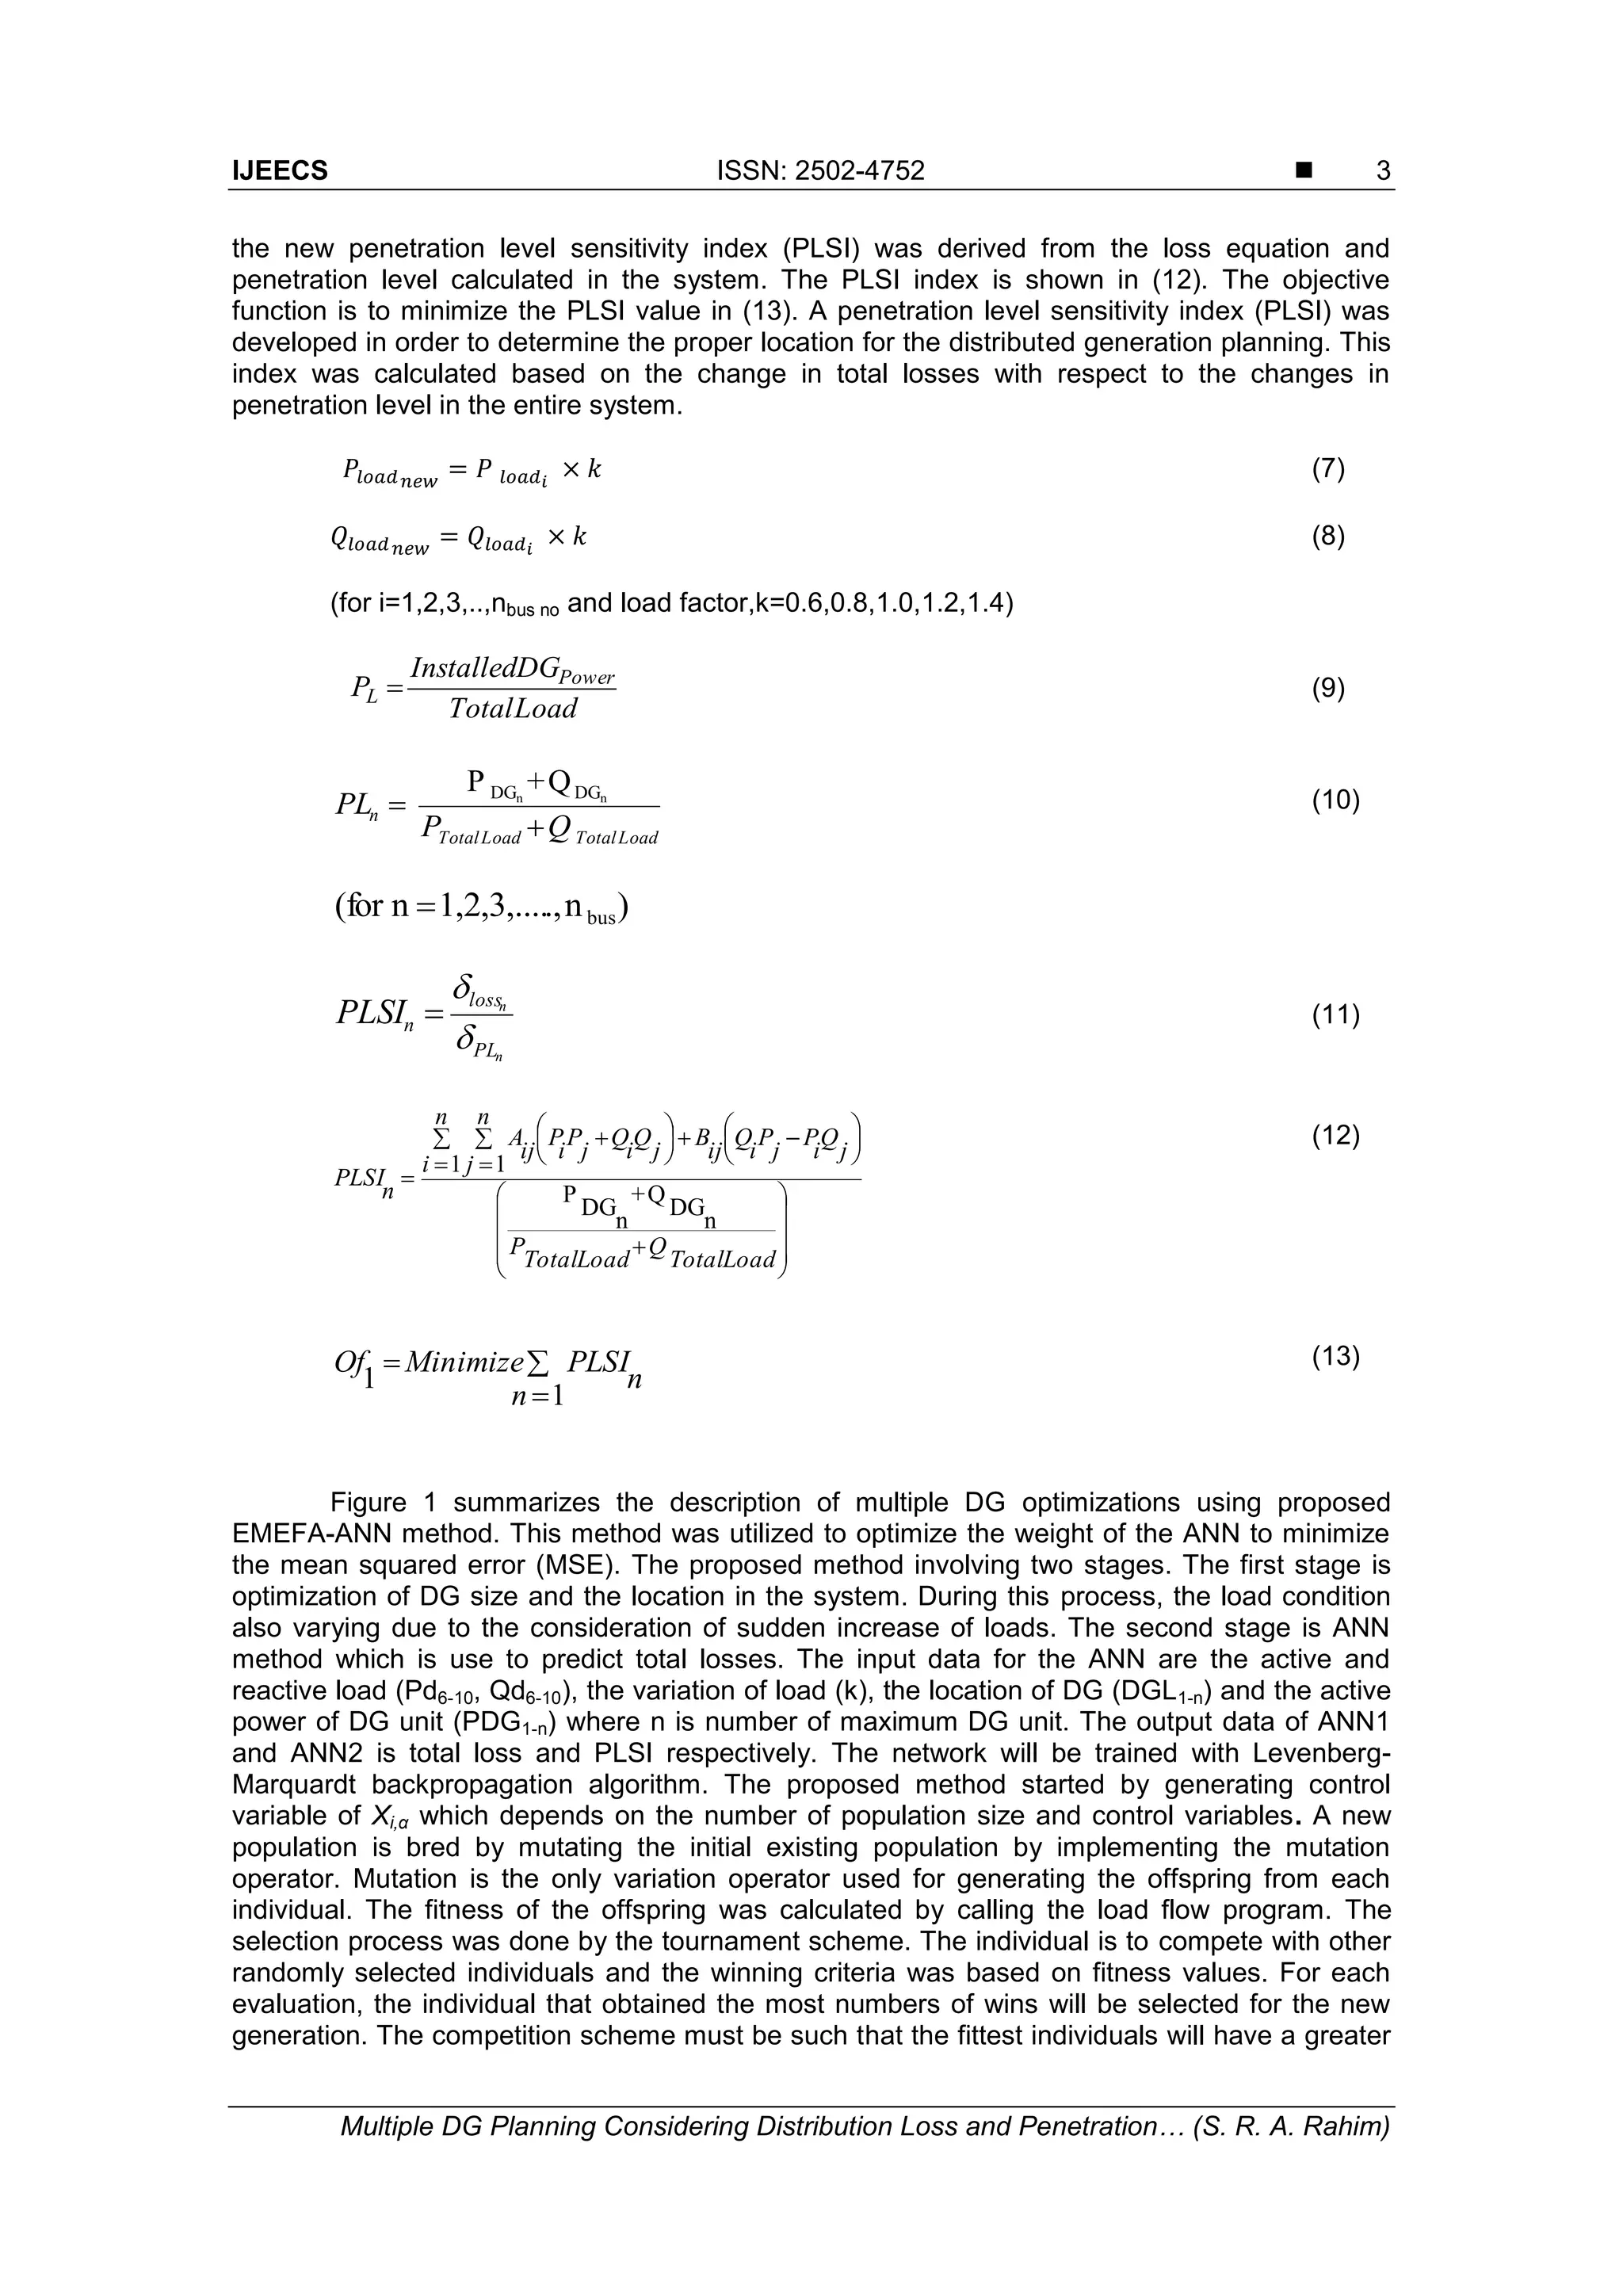
chance to survive, while weaker individuals will be eliminated. Through this, the population
evolves towards the global optimal solution. Based on the sorted fitness value, the current best
value is selected from the first half value and set as the initial locations of fireflies.
Consequently, the FA operation was embedded in this method by comparing the initial location
of ith solution with its jth neighboring solution. The value of β0, γ and r are the predefined
attractiveness, light absorption coefficient, and distance respectively [14].
Set Max Load location
(Setmax_counter2=6)
Setpop_size=20
Initialization
Generate control variable
(parent),
DG_Size= X1,X2, ,XK
DG_Location=DGL1-n
Mutation
Calculate offspring Xm1, Xm2
Calculate new fitness, F2
Record mutation data
Combination
Combine=
[dataA ; dataB]
Selection
Sortpopulation and
rank fitness value
Converge ?
Select the 1st
best
population of DataFA
(Record data)
Counter=
Max_counter2?
End
Embedded Firefly
Algorithm
Datacollection,
DataFA
Setload condition
(K=0.6,0.8,1.0,1.2,1.4)
Counter2=0
Start
Counter1=
Max_counter1?
Yes
No
Counter2 =
Counter2 + 1
Yes
No
SetMax_counter1=n
Counter1=0
(n setof DG)
Setno of DG:
1 DG unit m
Max m=4
Store Data 1
Store Data 2
Yes
No
ANN 1Input
Pd6-10
Qd6-10
Load
DGL 1-n
X 1-n
Output
Total Loss
Output
PLSI
LOOP 1
LOOP 2
LOOP 3
ANN 2
Figure 1. Flowchart for Multiple DG optimization using EMEFA-ANN Method
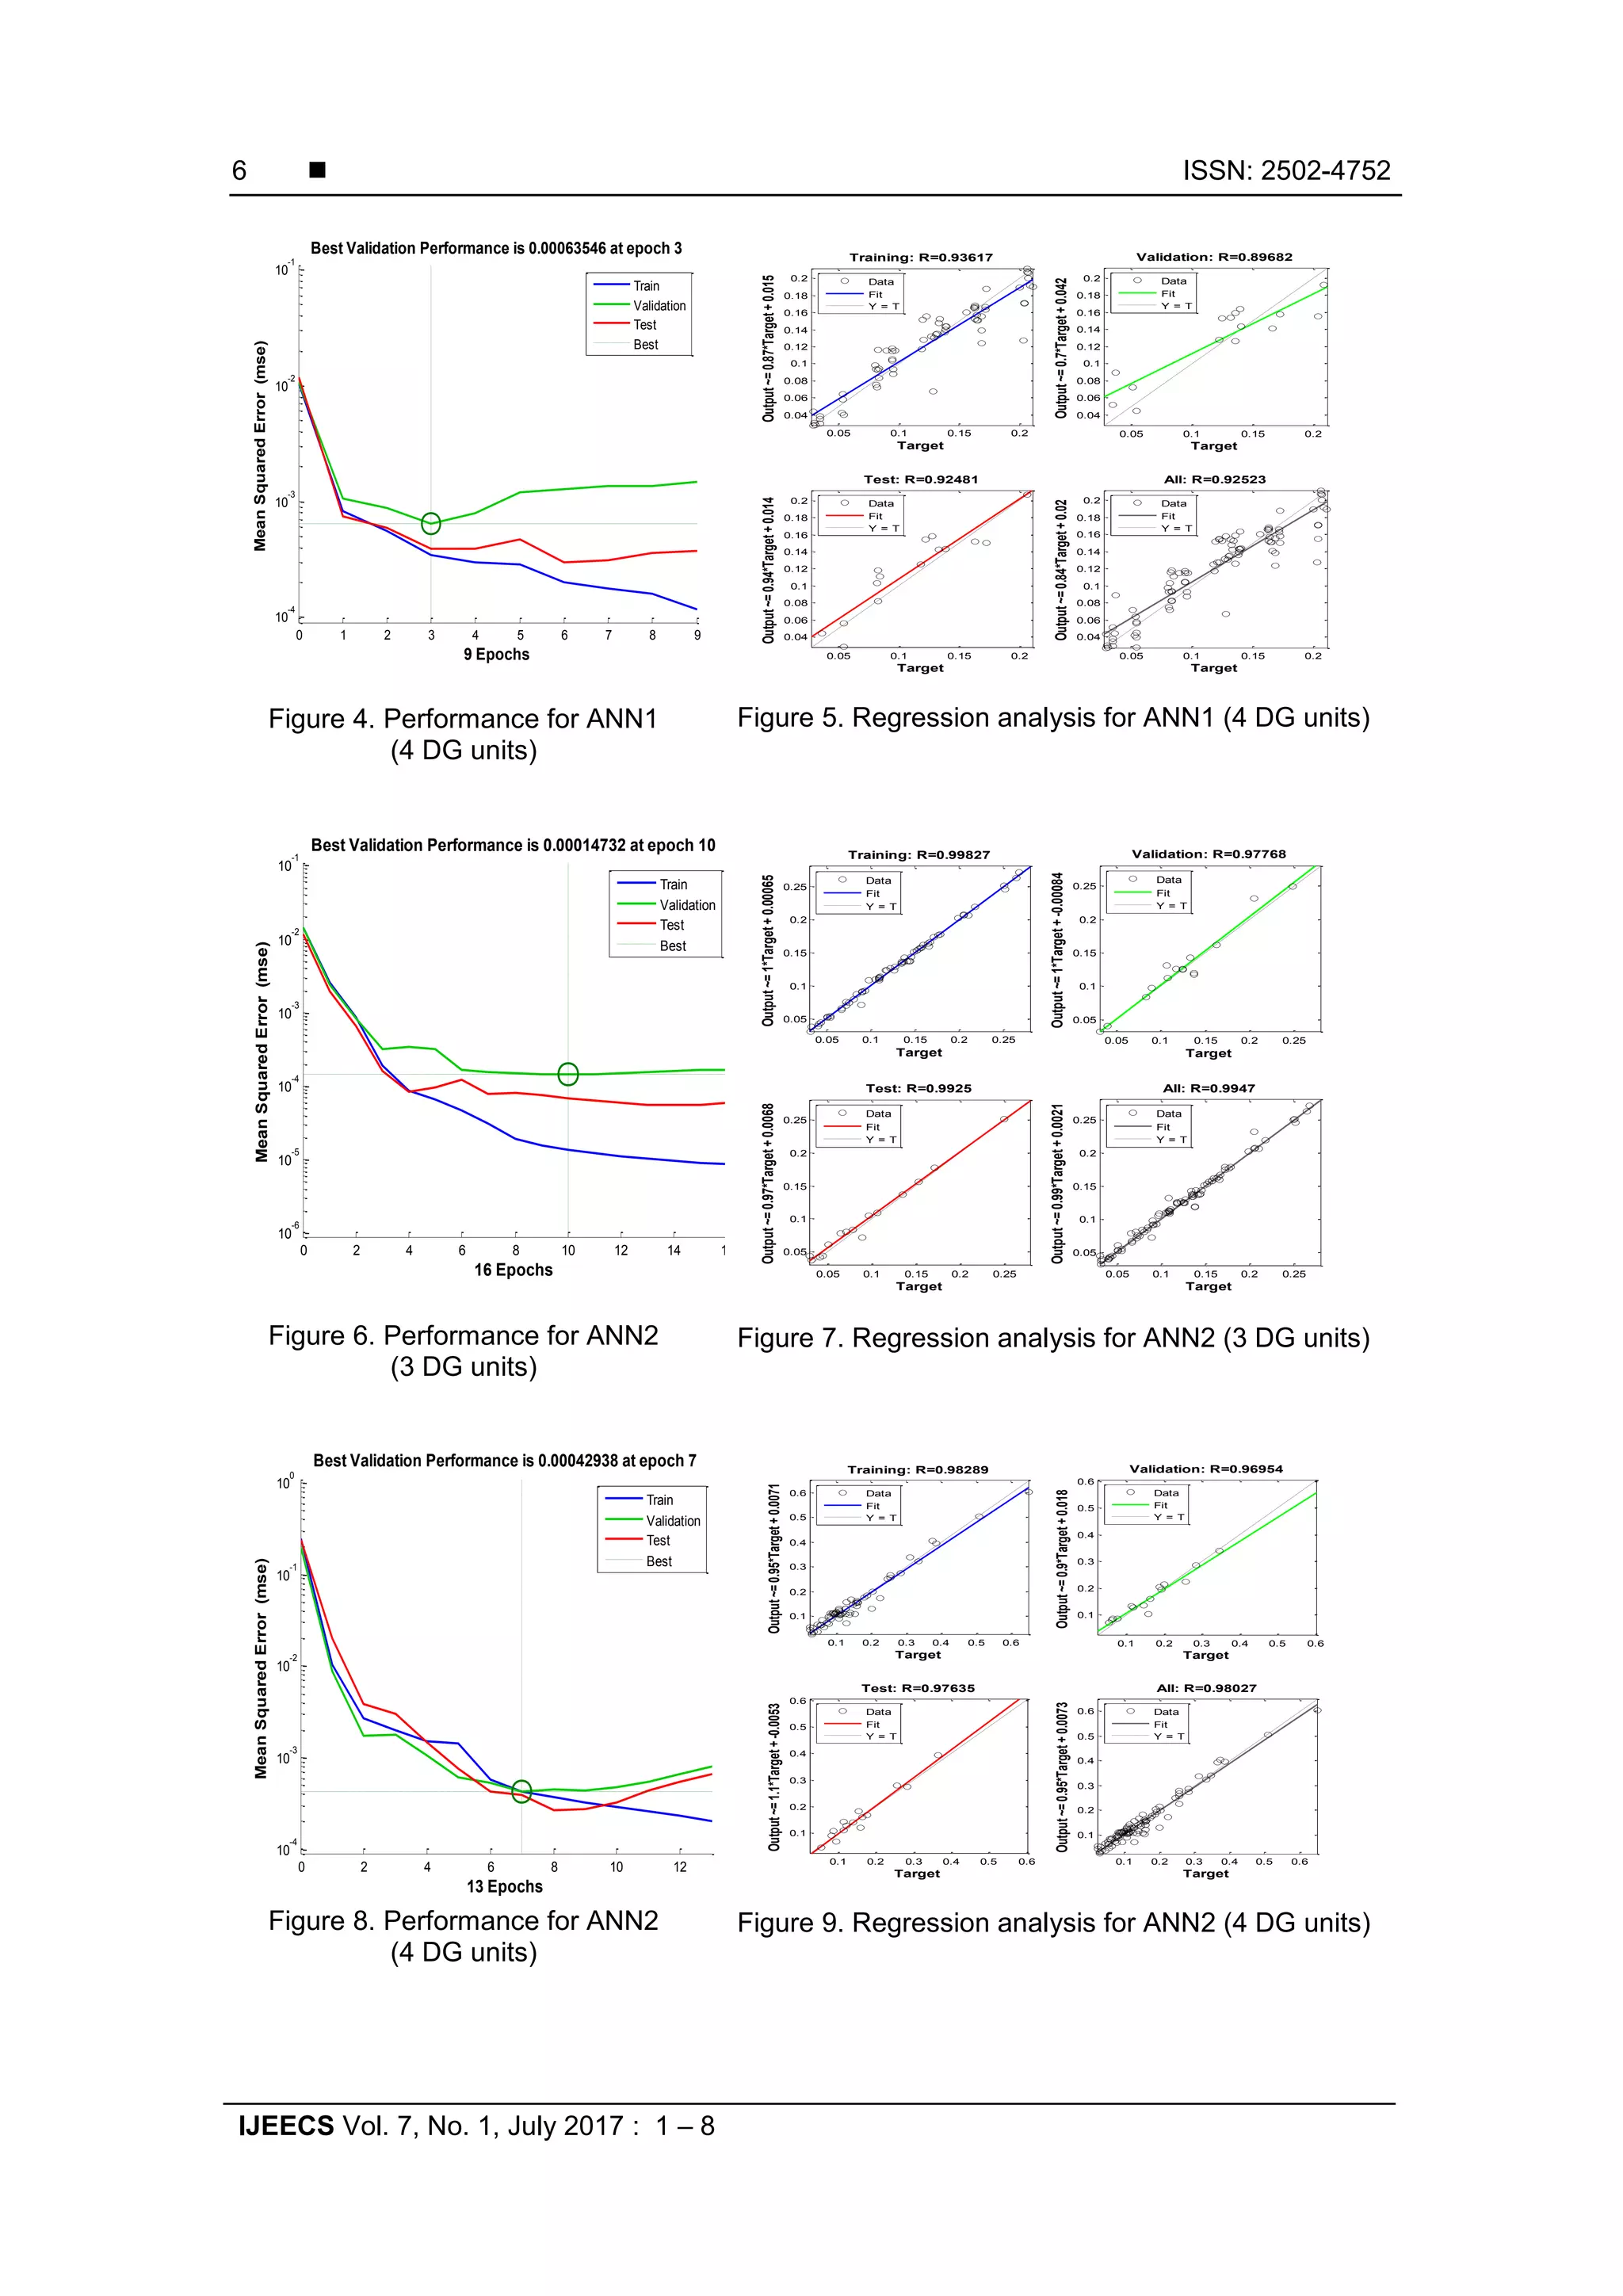
2. Results and Discussion
The proposed EMEFA-ANN technique was simulated and tested on the IEEE 69-bus
test system. Firstly, the effect of the multi-DG installation using different types of DG is observed
by setting the location for DG1 at bus 61. The location of DG2-DGn is dependent upon the
selected location from random number. The idea is to minimize distribution losses with the
proposed EMEFA. In the simulations, two conditions are addressed which are without DG and
with DG installed in the system. The analysis was conducted based on two cases which are
discussed below. The total losses before DG installation is tabulated in Table 2 for various
loading condition. Table 3 list the number of sample for training, validation and testing for the
study.](https://image.slidesharecdn.com/0116286-32182-1-smmultipleedit-201014042302/75/01-16286-32182-1-sm-multiple-edit-4-2048.jpg)
![ ISSN: 2502-4752
IJEECS Vol. 7, No. 1, July 2017 : 1 – 8
8
References
[1] P. Prakash and D. K. Khatod, “Optimal sizing and siting techniques for distributed
generation in distribution systems: A review,” Renew. Sustain. Energy Rev., vol. 57, pp.
111–130, 2016.
[2] K. Muthukumar and S. Jayalalitha, “Optimal placement and sizing of distributed generators
and shunt capacitors for power loss minimization in radial distribution networks using hybrid
heuristic search optimization technique,” Int. J. Electr. Power Energy Syst., vol. 78, pp. 299–
319, 2016.
[3] O. P. Mahela, A. G. Shaik, and N. Gupta, “A critical review of detection and classification of
power quality events,” Renew. Sustain. Energy Rev., vol. 41, pp. 495–505, Jan. 2015.
[4] M. N. Muhtazaruddin et al., “Distribution Power Loss Minimization via Distributed
Generation , Capacitor and Network Reconfiguration,” Int. Conf. Electr. Electron. Commun.
Control Eng., vol. 5, no. 3, pp. 1–7, 2016.
[5] S. Dorahaki, “Optimal DG placement with the aim of profits maximization,” Indones. J.
Electr. Eng. Comput. Sci., vol. 1, no. 2, pp. 249–254, 2016.
[6] W.-S. Tan, M. Y. Hassan, M. S. Majid, and H. Abdul Rahman, “Optimal distributed
renewable generation planning: A review of different approaches,” Renew. Sustain. Energy
Rev., vol. 18, pp. 626–645, Feb. 2013.
[7] M. Kotb and K. Sheb, “Genetic Algorithm for Optimum Siting and Sizing of Distributed
Generation,” 10th MEPCON, pp. 433–440, 2010.
[8] M. Bavafa and N. Branch, “A new Method of Evolutionary Programming in DG Planning,” in
International Conference on Energy, Automation, and Signal (ICEAS), 2011, no. x.
[9] A. Kaviani-Arani, “Optimal Placement and Sizing of Distributed Generation Units Using Co-
Evolutionary Particle Swarm Optimization Algorithms,” TELKOMNIKA Indones. J. Electr.
Eng., vol. 13, no. 2, 2015.
[10]M. M. Wazir, A. Omar, and A. S. Rafidah, “Optimal allocation and sizing of distributed
generation in distribution system via firefly algorithm,” no. June, pp. 6–7, 2012.
[11]T. J. Hashim and A. Mohamed, “Fuzzy Logic Based Coordinated Voltage Control for
Distribution Network with Distributed Generations,” World Acad. Sci. Eng. Technol., vol. 7,
no. 7, pp. 24–29, 2013.
[12]M. A. Alotaibi and M. M. A. Salama, “An efficient probabilistic-chronological matching
modeling for DG planning and reliability assessment in power distribution systems,” Renew.
Energy, vol. 99, pp. 158–169, 2016.
[13]A. Ellis et al., “Review of existing reactive power requirements for variable generation,”
IEEE Power Energy Soc. Gen. Meet., pp. 1–7, 2012.
[14]S. R. A. Rahim, I. Musirin, M. H. Hussain, and M. M. Othman, “EMEFA Approach for DG
Installation in Distribution System,” Int. Rev. Model. Simulations, vol. 5, no. 6, pp. 2546–
2553, 2012.](https://image.slidesharecdn.com/0116286-32182-1-smmultipleedit-201014042302/75/01-16286-32182-1-sm-multiple-edit-8-2048.jpg)


![[IJET-V1I4P9] Author :Su Hlaing Win](https://cdn.slidesharecdn.com/ss_thumbnails/ijet-v1i4p9-150824171458-lva1-app6891-thumbnail.jpg?width=640&height=640&fit=bounds)