
Recommended
More Related Content
What's hot
What's hot (15)
Viewers also liked
Viewers also liked (20)
Similar to קבר הצדיק
Similar to קבר הצדיק (20)
More from random13579
More from random13579 (20)
Recently uploaded
Recently uploaded (20)
קבר הצדיק
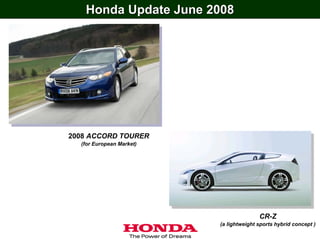
- 1. Honda Update June 2008 2008 ACCORD TOURER (for European Market) CR-Z (a lightweight sports hybrid concept )
- 2. Outline Highlights of Honda’s Business Growth Strategy • US Operations (Automobile) P 2- 8 • Brazil Operations (Automobile & Motorcycle) P 9- 11 • Asia Operations (Automobile & Motorcycle) P 12- 18 • Europe Operations (Automobile) P 19- 20 • Production Capacity (Automobile) P 21 • Growth Potential of Motorcycle Business P 22 • Hybrid Vehicle Business Strategy P 23 Financial Highlights • FY 08 Results • Outline P 24- 25 • Segment Information P 26- 32 • Profit Analysis P 33- 36 • FY 09 Forecasts P 37- 40 • Dividend per Share P 41- 42
- 3. Honda’s Business Growth Strategy Major Key Drivers US Operations : Automobile Brazil Operations : Automobile and Motorcycle Asia Operations : Automobile and Motorcycle Europe Operations : Automobile Growth Potential of Motorcycle Business Hybrid Vehicle Business Strategy 1
- 4. Operation in North America Operating income in North America compressed by higher yen and weak model mix Yen (billions) 150 12% 9.5% 10% 7.8% 7.7% 100 7.5% 8% 7.2% 7.3% 6.5% 6.7% 6.1% 5.8% 5.4% 6% 4.3% 50 4% 2% 72.7 68.5 106.7 105.8 114.4 95.7 118.2 128.4 97.0 116.0 156.3 63.1 0 0% FY06 1Q 2Q 3Q 4Q FY07 1Q 2Q 3Q 4Q FY08 1Q 2Q 3Q 4Q 2
- 5. Update on Honda’s U.S. Automobile Business Honda’s steady growth despite weak SAAR Industry Demand Honda’s Retail Unit Sales Unit Unit (thousands) (thousands) (aggregate numbers of Honda brand and Acura brand) 20,000 Passenger Cars Passenger Cars Light Trucks Light Trucks 1,570 1,552 16,884 16,965 1,509 16,556 1,500 1,462 16,149 1,394 15,300 15,000 1,000 10,000 500 5,000 0 0 CY 04 '05 '06 '07 08(P) CY 04 '05 '06 '07 08(E) Source: Honda 3
- 6. U.S. Light Vehicle Retail Sales YoY Changes by manufacturers January – April, 2008 vs 2007 Ho n da Sm ar t USA Mazda Me r c e de s- Be n z Vo lkswage n Su zu ki Kia BMW Nissan Mit su bish i Hyu n dai T o yo t a Fo r d C h r ysle r Ge n e r al M o t o r s T OTAL Unit -250 (thousands) -200 -400 -150 -100 -50 0 50 4
- 7. U.S. Passenger Car Retail Sales YoY Changes by manufacturers January – April, 2008 vs 2007 Honda Nissan Smart USA Kia Chrysler Volkswagen Hyundai Mercedes-Benz Mitsubishi BMW Mazda Toyota Suzuki TOTAL General Motors Ford Unit -25 (thousands) -20 -15 -10 -5 0 5 10 15 20 5
- 8. U.S. Light Truck Retail Sales YoY Changes by manufacturers January – April, 2008 vs 2007 Suzuki Mazda Mercedes-Benz BMW Volkswagen Mitsubishi Kia Hyundai Honda Nissan Toyota Ford General Motors Chrysler TOTAL Unit -200 (thousands) -150 -350 -100 -50 0 50 6
- 9. Update on Honda’s U.S. Automobile Business Honda’s fuel efficient vehicles are well received in the U.S. Unit demonstrates solid passenger car sales (thousands) Fit 1800 R dgeline 1600 Fit MDX 1400 Element 1200 CR-V CR-V 1000 Odyssey 800 Pilot 600 TSX 400 Civic RDX TL 200 Accord Legend/RL 0 Civic 1999 2000 2001 2002 2003 2004 2005 2006 2007 CY 1998 2008(P) Accord 7
- 10. Product pipeline and production flexibility in North America Total Annual Production Capacity: 1,420,000 (current) ⇒ 1,620,000 (fall of 2008) Passenger cars Light Trucks Annual location Capacity Small Middle Luxury Crossover Pickup Van Line 1 Line 1 Civic CSX 195 195 Canada Canada Ontario Ontario Alliston Alliston Line 2 Line 2 195 Civic MD-X Pilot Ridgeline Odyssey 195 Marysville Marysville 440 440 Accord TL RDX Ohio Ohio East East Liberty Liberty 240 240 Civic CR-V Element U.S. U.S. Indiana Indiana Greensburg Greensburg 200 200 Civic Line 1 Line 1 Ridgeline Odyssey 150 150 Alabama Alabama Lincoln Lincoln Line 2 Line 2 150 Pilot Odyssey 150 Mexico Mexico El Salto El Salto 50 50 Accord CR-V Import Import New model in 2008 from Japan from Japan Accord CR-V 8
- 11. Operation in South America Operating income in Other region centered in Brazil to grow Yen (billions) 50 13% 11.7% 40 11.4% 11.3% 11.2% 10.9% 10.3% 10.4% 11% 30 9.6% 8.6% 9% 8.3% 8.4% 20 7.2% 7% 10 13.6 15.1 16.6 11.6 15.2 21.4 16.0 19.5 21.7 30.1 31.7 32.7 0 5% FY06 1Q 2Q 3Q 4Q FY07 1Q 2Q 3Q 4Q FY08 1Q 2Q 3Q 4Q 9
- 12. Honda’s Automobile Business Growth in South America Industry Demand Honda’s Unit Sales (including commercial vehicles) Good sales of FFV models continue to Unit Unit (thousands) (thousands) contribute to growth in 2008. 5,000 160 Brazil Argentina Venezuela Chile 4,500 Flexible Fuel Vehicles (currently marketed in Brazil) Colombia Ecuador Peru 140 Petrol Engine Vehicles 4,000 3,500 120 108 South America 3,000 100 Brazil only 84 2,500 80 86 68 2,000 60 57 67 1,500 57 50 40 1,000 500 20 0 0 CY 04 05 06 07 08(E) CY 04 05 06 07 Source: Global Insight Source: Honda Honda’s Progress in South America Flexible Fuel Vehicles introduced in Brazil 1. Features of Honda FFV models in Brazil (Civic &Fit) Civic FFV Fit FFV - Adapt to ethanol-to-gasoline ratios of between 20% and 100% 2. Further acceleration of production capacity in Brazil 100,000→ 120,000 within 2008 3. New plant in Argentina Capacity:30,000 units, to start operation in 2009 Introduced in Nov. 2006 Introduced in Dec. 2006 10
- 13. Honda’s Motorcycle Business in Brazil Solid operation as the market leader in the growing Brazil market Industry: Other brands Further expansion of capacity is planned in 2009 Unit (thousands) (1,500 2,000 thousand units) Honda 2,000 1,800 1,600 1,400 1,200 1,000 800 600 400 Expansion of production capacity Dec.2007 (1,350 → 1,500 thousand units per year) 200 0 CY 04 05 06 07 08(E) Source: Principal models Honda CG 150 Titan CG 125 FAN Biz 125 11
- 14. Operation in Asia Operating income in Asia exceed 100 billion in FY08 with higher auto and motorcycle growth Yen (billions) 50 14% 12% 40 9.4% 9.3% 10% 8.3% 8.0% 30 8% 6.8% 6.9% 6.8% 6.7% 5.8% 6% 20 5.2% 5.3% 4.5% 4% 10 2% 19.1 15.8 17.2 12.7 19.4 18.2 20.2 19.2 36.9 33.4 38.3 21.9 0 0% 1Q 2Q 3Q FY06 4Q 1Q 2Q 3Q FY07 4Q 1Q 2Q 3Q FY08 4Q 12
- 15. Update on Honda’s Automobile Business in India Unit Industry Demand Unit Honda’s Unit Sales (thousands) (excluding commercial vehicles, (thousands) 1,400 80 SUV and MUV) Category 1,200 70 Premium 60 "A" 60 CR-V 1,000 55 800cc 50 Civic 800 40 40 35 600 30 400 City 20 200 10 Accord 0 0 CY 04 05 06 07 08(E) CY 04 05 06 07 Source: Global Insight Source: Honda Honda model line up in India Honda’s Progress in India 1. Enhancing dealer network - Number of Dealer outlets: 34 (Mar. 2003) → 80 (Mar. 2008) 2. Further Accelerating production capacity expansion Civic (July 2006-) City (Oct 2003-) Existing Plant Second Plant 50,000 →100,000 units 60,000 units (2008 Jan. completed) (Operation starts toward the end of 2009 to 2010) CR-V (Nov 2006-) Accord (May 2008-) 13
- 16. Honda’s Motorcycle Business in India Solid business foundation with 2 companies in rapidly growing market Industry: Unit (thousands) Expansion of annual production capacity HHML 500 thou. Increase from April 2008 10,000 Other brands (India total 4,900 → 5,400 thousand units) Hero Honda Honda Motorcycle & Scooter India 8,000 6,000 4,000 2,000 0 Source : CY 04 05 06 07 08(E) Honda Principal models of Principal models of Hero Honda Motors Limited Honda Motorcycle & Scooter India Splendor+ CD Deluxe Passion+ Activa Shine 14
- 17. Growth of HMSI in India Steady Growth of Honda Motorcycle & Scooter India, subsidiary of Honda Industry: Expansion of production capacity by the end of 2010 Unit (thousands) 1,000 (1,000 → 1,200 thousand units per year) 800 600 400 200 0 Source : CY 04 05 06 07 Honda Principal models of Honda Motorcycle & Scooter India HMSI Dealer Activa Shine Unicorn (Sep 2004-) Aviator (Mar 2008-) 15
- 18. Honda’s Motorcycle Business in Vietnam Honda to enhance product pipeline for growing market, Further expansion of production capacity Industry: Expansion of production capacity in Aug 2008 Unit (thousands) Other brands (1,000 → 1,500 thousand units per year) Honda 3,000 2,500 2,000 1,500 1,000 500 0 CY 04 05 06 07 08(E) Source: Principal models Honda Wave S Future Neo FI Click* (Oct 2006-) Air Blade* (Apr 2007-) (May 2007-) (Apr 2007-) * AT model: Motorcycles equipped with automatic transmission 16
- 19. Honda’s Motorcycle Business in Indonesia Honda to enhance product pipeline to go with the momentum of the market Industry: Other brands Unit (thousands) Honda 6,000 5,000 4,000 3,000 2,000 1,000 Added annual production capacity in Sep. 2005 (2,000 → 3,000 thousand units) 0 CY 04 05 06 07 08(E) Source: Honda Principal models Coming in 2008 Revo Vario* Supra X 125 * AT model: Motorcycles equipped with automatic transmission 17
- 20. Update on Honda’s Automobile Business in China Industry Demand Honda’s Unit Sales Unit (thousands) (excluding commercial vehicles) Unit (thousands) 7,000 500 Over 490 450 6,000 424 WDHAC models 400 Civic 5,000 350 323 CR-V 4,000 300 257 Fit 250 3,000 214 200 City GHAC models 2,000 150 Odyssey 100 1,000 50 Accord 0 0 CY 04 05 06 07 CY 04 05 06 07 08(P) Source: CAAM Source: Honda Honda’s Progress in China GHAC model line up 1 Enhancing model lineup and dealer network - New Accord introduced in Jan. 2008, New Fit to be introduced within 2008 - Number of Dealer outlets: GHAC 361, WDHAC 189, Acura 8(Mar.2008) Total 700 outlets within a year Fit City Accord Odyssey - Introduction of Acura (RL/TL/MDX) WDHAC model line up 2 Progress in Manufacturing Operation GHAC*1 : Capacity 360 thou. units *1 GHAC: Guangzhou Honda Automobile Co., Ltd. WDHAC*2 : Capacity 120 thou. units--> 240 thou. units within 2yrs *2 WDHAC: Dongfeng Honda Automobile Co., Ltd. CHAC*3 : Added 2nd shift from Apr. 2007, capacity 50 thou. units *3 CHAC: Honda Automobile (China) Co., Ltd. 3 GHAC begin selling products under its own brand in 2010 Civic CR-V 18
- 21. Operation in Europe Operating income in Europe (including Russia) to grow, expecting higher sales in Russia Yen (billions) 30 5% 4.3% 4.3% 4.2% 4% 20 2.9% 2.9% 2.8% 2.6% 3% 2% 2.0% 10 1.6% 1.4% 1% 1.1% 12.7 0.3% 0.8 2.8 9.8 6.4 9.0 3.7 12.6 10.3 16.7 5.8 18.6 0 0% FY06 1Q 2Q 3Q 4Q FY07 1Q 2Q 3Q 4Q FY08 1Q 2Q 3Q 4Q 19
- 22. Update on Honda’s Automobile Business in Russia Unit Industry Demand Unit (thousands) Honda’s Unit Sales (thousands) (excluding commercial vehicles) 60 3,000 Foreign brands Domestic brands 2,500 2,000 40 38.6 Jazz CR-V 1,500 1,000 20 Civic 15.7 500 8.9 6.0 Accord 0 0 CY 04 05 06 07 CY 04 05 06 07 Source: AEB (The Association of European Businesses) Source: Honda Honda model line up in Russia Honda’s Progress in Russia 1 Starting business - Established subsidiary company (HMR) in Feb. 2004 Jazz Civic 5D Civic 4D 2 Enhancing dealer network - Number of Dealer outlets: 15 (2004 end) → 43 (Mar. 2008) expand mainly in large cities, total 70 outlets in a few years CR-V Accord Pilot (coming in 2008) 20
- 23. Expansion of Production Capacity (Automobiles) High value added model at Yorii Auto Plant Next generation high efficiency engine at Ogawa Engine Plant Unit (thousands) Yorii India Japan Argentina +60 Indiana +200 +30 +200 Thailand +120 Brazil +20 4,055 WDHAC China +120 within 2yrs Current 2008 2009 2010 21
- 24. Growth Potential of Motorcycle Business in Emerging Markets GDP per capita Penetration Rate (% of population) of Motorcycles (U.S.$) (JETRO 2006) 10% 20% 30% 40% 50% 60% $15,482 Taiwan 59.5% Population (millions) $5,718 Malaysia 28.3% Units in operation (millions) *Indonesia data as of 2004 $3,136 Thailand 23.8% *India data as 2004 provisional $723 Vietnam 20.5% $1,640 Indonesia* 10.8% $5,714 Brazil 5.1% $796 India* 4.6% 100 mil 200 mil 1,100 mil Motorcycle penetration is still low in Honda’s principal markets Industry: Vietnam ● Honda wholesales unit (thousands) 12,000 Honda wholesales: ( thousands ) Thailand ( thousands ) 20,000 Brazil Indonesia 10,000 India 8,000 6,000 10,000 4,000 2,000 Source: Honda 0 0 CY 04 05 06 07 08(E) Honda has strong position in such markets 22
- 25. Hybrid Vehicle Business Strategy Hybrid Car in the U.S. market Unit (thousands) Hybrid technology is about to hit the “growth” stage, 350 Honda aims wider market penetration with Other Brand 300 Honda new dedicated hybrid model 250 200 150 Introduction of Honda Insight 100 50 Insight, 2006 Civic Hybrid, 0 first hybrid vehicle in the U.S. won the “World Car of the Year Award” for Greenest Car CY99 00 01 02 03 04 05 06 07 -Compact Control Unit / Battery Cost down on Next Hybrid System -Thin Hybrid Motor -Efficient manufacturing processes Hybrid models with affordable price: 500,000 annual global sales beyond 2010 New Hybrid Model Compact, 5 door/5 passenger, to be marketed in early 2009 Hybrid Sports CR-Z, Concept model Honda annual global sales New Civic Hybrid beyond 2010 Fit Hybrid 23
- 26. Financial Highlights •FY 08 Results •Outline •Segment Information •Profit Analysis •FY 09 Forecasts •Dividend per Share
- 27. Outline of 4th Quarter Financial Results (Consolidated) 4Q Results Business environment Unit Sales US economy slow down, ongoing subprime loan impact FY07 FY08 Change Declining personal consumption in European economy Unit (thousands) Continued growth of Asian economy Motorcycles 2,408 2,368 - 1.7% Signs of weakness in Japan economy Continued high prices for crude oil and raw materials Automobiles 957 1,051 + 9.8% Yen appreciation against U.S. dollar, depreciation against other currencies Power Products 2,128 2,092 -1.7% Motorcycle Market Growth in Vietnam and Brazil continued Declining market in North America 4Q Results Automobile Market Growth of emerging markets such as BRICs Financial results Strong demand for fuel-efficient cars in the U.S. Yen (billions) FY07 FY08 Change Japan automobile market remain stagnant Net sales & other 3,087.8 3,055.5 - 1.0% Review of financial results operating revenue Operating margin decreased due to factors including Operating income 250.2 168.8 - 32.5% significant yen appreciation against U.S. dollar despite the increased automobile unit sales achieved in the toughening Income before business environment such as in the U.S. 239.0 146.8 - 38.6% income taxes Unit Sales Equity in income Motorcycles: Strong sales in South America, etc. 19.9 24.3 * + 22.1% Decreased unit sales of component parts for Asia of affiliates Automobiles: Unit sales increased in all regions Net income 176.1 25.4 - 85.6% Power Products:Increased unit sales in Europe, Asia, Other Regions Decreased unit sales in North America EPS (Yen) 96.70 14.01 - 82.69 Net sales & other operating revenue Increased unit sales in automobile segments Note : Shares which are based approx. approx. * Record high Net sales decreased due to currency translation effects on calculation of EPS 1,821,994,000 shares 1,814,587,000 shares for 4Q (weighted average number of shares outstanding ) Operating income <Increase Factors> Continuing cost reduction effects Average Rates (Yen) Increased profit from increased automobile unit sales stronger by <Decrease Factors> U.S. Dollar 120 106 14 yen Currency effect of yen appreciation against U.S. dollar weaker by Increase in sales incentives in North America Euro 157 158 Increased raw material costs 1 yen 24
- 28. Outline of 4th Quarter & Twelve Months Financial Results (Consolidated) 4Q Results Twelve Months Results Unit Sales FY07 FY08 Change FY07 FY08 Change Unit (thousands) Motorcycles 2,408 2,368 - 1.7% 10,369 9,320 - 10.1% Automobiles 957 1,051 + 9.8% 3,652 3,925 + 7.5% Power Products 2,128 2,092 -1.7% 6,421 6,057 - 5.7% 4Q Results Twelve Months Results Financial results Yen (billions) FY07 FY08 Change FY07 FY08 Change Net sales & other operating revenue 3,087.8 3,055.5 - 1.0% 11,087.1 12,002.8 * + 8.3% Operating income 250.2 168.8 - 32.5% 851.8 953.1 * + 11.9% Income before income taxes 239.0 146.8 - 38.6% 792.8 895.8 * + 13.0% Equity in income 19.9 24.3* + 22.1% 103.4 118.9* + 15.0% of affiliates Net income 176.1 25.4 - 85.6% 592.3 600.0 * + 1.3% EPS (Yen) 96.70 14.01 - 82.69 324.62 330.54* + 5.92 Note : Shares which are based approx. approx. * Record high approx. approx. * Record high for on calculation of EPS 1,821,994,000 shares 1,814,587,000 shares for 4Q 1,824,675,000 shares 1,815,356,000 shares twelve months (weighted average number of shares outstanding ) (weighted average number of shares outstanding ) Average Rates (Yen) stronger by stronger by U.S. Dollar 120 106 14 yen 117 114 3 yen weaker by weaker by Euro 157 158 1 yen 151 162 11 yen 25
- 29. Motorcycle Unit Sales (Motorcycles + All-Terrain Vehicles, etc.) Change - 1,049 Unit FY08 4Q from FY 07 4Q Major increase / decrease factors ( - 10.1% ) Approx.4,580 (thousands) Approx.2,860 13,000 13,000 Japan 66 - 13 ・Decrease of Dio etc. North ・Decrease of CBR600RR, VT750 150 -14 Wave S (Vietnam) 12,000 12,000 America ・ Decrease of ATV such as Four Trax Foreman 11,000 Europe 89 -8 ・Decrease of CBR600RR in Italy 11,000 ・Decrease of component parts for Indonesia 10,369 Asia 1,617 - 89 ・Increase of Wave S and AT models such as Air Blade in 10,000 10,000 Vietnam 1,305 Other ・Introduction of POP100 in Brazil CG125 FAN (Brazil) 9,320 Regions 446 + 84 ・Increase of CG125, NXR150 in Brazil 9,000 9,000 Unit sales of Honda-brand Other Total 2,368 - 40 motorcycle products that 1,610 Regions 8,000 8,000 are manufactured and sold by overseas affiliates accounted for under the 7,000 7,000 equity method, but do not use any parts supplied by Honda and its subsidiaries 6,000 - 40 6,000 ( - 1.7% ) 7,895 6,633 Asia 5,000 5,000 4,000 4,000 Approx.560 Approx.640 Approx.1,150 Approx.1,100 Approx.1,160 Approx.1,280 Approx.1,020 3,000 3,000 Approx.500 2,816 2,765 2,380 341 314 2,408 2,253 2,333 2,366 2,368 288 362 392 401 2,000 2,000 371 446 2,163 2,217 1,809 1,706 1,000 1,000 1,623 1,645 1,748 1,617 329 Europe 313 105 71 56 97 95 68 61 89 North 143 107 164 121 102 150 503 453 America 89 80 89 98 71 79 84 107 54 66 337 311 Japan 00 1Q 第1四半期 2Q 3Q 第2四半期 第3四半期 第3四半期 4Q 第4四半期 1Q 第1四半期 2Q 3Q 第2四半期 第3四半期 4Q 第3四半期 第4四半期 第4四半期 12ヶ月間通算 12ヶ月間通算 第1四半期 第2四半期 第4四半期 第1四半期 第2四半期 12ヶ月間通算 12ヶ月間通算 Twelve Months Twelve Months FY07 FY08 FY07 FY08 Unit sales is the total of sales of completed products of Honda and its consolidated subsidiaries and sales of parts for Honda’s affiliates accounted for under the equity method. 26
- 30. Motorcycle Business Net Sales/Operating Income/Operating Margin FY07 FY08 FY07 FY08 1Q 2Q 3Q 4Q 1Q 2Q 3Q 4Q Twelve Months Twelve Months Yen Net Sales 310.1 335.5 303.2 421.7 368.3 381.6 364.6 444.0 1,370.6 1,558.6 (billions) Yen (+ 5.3%) (+ 13.7%) (billions) Operating Income 160 Operating Margin 15% 140 11.9% 120 10.5% 9.6% 9.7% 9.7% 10% 100 8.5% 7.3% 8.3% 80 60 4.2% 5% 40 3.7% 20 13.1 32.0 11.1 44.2 31.1 37.0 30.3 52.7 100.6 151.2 0 0% FY07 1Q 2Q 3Q 4Q FY08 1Q 2Q 3Q 4Q FY07 FY08 27
- 31. Automobile Unit Sales Unit Change FY08 4Q from FY 07 4Q Major increase / decrease factors (thousands) + 273 ・Increase of FIT and Inspire ( + 7.5% ) Japan 191 +2 ・Decrease of That’s FIT (Japan) 4,000 North ・Increase of Accord and CR-V 3,925 America 459 +9 ・ Decrease of Pilot 3,652 314 Other Regions Europe 109 +7 ・Increase of Civic and CR-V in Russia, Ukraine 3,500 248 ・Increase of component parts for China (CR-V and Fit etc ) Civic (Russia) Asia 203 + 54 ・Increase of CR-V in ASEAN countries such as Indonesia 755 Asia 620 Other ・Increase of Civic FFV in Brazil 3,000 89 + 22 ・Increase of Accord in Middle East countries such as Regions Saudi Arabia and UAE Total 1,051 + 94 324 391 Europe 2,500 CR-V (Indonesia) 2,000 + 94 1,850 North ( + 9.8% ) 1,788 America 1,500 991 1,051 1,000 896 884 915 957 946 937 89 67 72 87 61 66 60 60 188 203 155 149 187 177 153 163 102 109 71 79 72 92 100 90 500 456 411 471 450 465 445 481 459 672 615 Japan 156 171 156 189 136 143 145 191 0 1Q 第1四半期 2Q 第2四半期 3Q 第3四半期 4Q 第4四半期 1Q 第1四半期 2Q 第2四半期 3Q 第3四半期 4Q 第4四半期 累計 累計 Twelve Months Twelve Months FY07 FY08 FY07 FY08 Unit sales is the total of sales of completed products of Honda and its consolidated subsidiaries and sales of parts for Honda’s affiliates accounted for under the equity method. 28
- 32. Automobile Business Net Sales/Operating Income/Operating Margin FY07 FY08 FY07 FY08 1Q 2Q 3Q 4Q 1Q 2Q 3Q 4Q Twelve Months Twelve Months Yen Net Sales 2,095.6 2,098.8 2,263.8 2,430.7 2,327.2 2,356.4 2,449.0 2,356.6 8,889.0 9,489.3 (billions) Yen (- 3.0%) (+ 6.8%) (billions) Operating Income Operating Margin 750 700 12% 650 600 10% 550 9.0% 9.0% 500 450 8% 7.2% 7.1% 7.0% 6.7% 400 6.5% 6.4% 6.2% 350 6% 300 250 4% 200 3.4% 150 2% 100 50 150.0 130.8 160.7 157.7 148.3 213.0 220.7 79.5 599.5 661.6 0 0% FY07 1Q 2Q 3Q 4Q FY08 1Q 2Q 3Q 4Q FY07 FY08 29
- 33. Power Products Unit Sales Change Unit FY08 4Q Major increase / decrease factors (thousands) from FY 07 4Q - 364 (- 5.7%) Japan 151 + 12 ・Increase of general purpose engines for OEM GX35T (general purpose engine) 6,421 6,500 North ・Decrease of general purpose engines for OEM, generators in America 888 -135 the U.S. 406 6,057 6,000 Europe 671 + 47 ・Increase of general purpose engines for OEM Other 484 Regions ・Increase of general purpose engines for OEM, water pumps in GCV160 760 5,500 Asia 251 + 21 Thailand, Indonesia (general purpose engine) ・Decrease of general purpose engines ・Increase of lawn mowers in Australia 915 Asia 5,000 Other Regions 131 + 19 ・Increase of generators in South Africa 4,500 1,625 Total 2,092 - 36 4,000 HRU19D1 Buffalo Buck 1,693 Europe (lawn mower) 3,500 - 36 (- 1.7%) 3,000 2,500 2,128 2,092 112 3,103 2,000 131 1,724 230 251 2,415 North 72 1,529 America 1,500 162 1,382 624 97 1,187 117 220 1,258 1,178 671 382 105 161 116 140 1,000 207 365 390 242 202 254 1,023 280 971 352 888 500 494 615 687 479 361 527 550 Japan 137 127 124 139 135 141 123 151 0 1Q 第1四半期 2Q 第2四半期 3Q 第3四半期 4Q 第4四半期 1Q 第1四半期 2Q 第2四半期 3Q 第3四半期 4Q 第4四半期 Twelve累計 累計 Months Twelve Months FY07 FY08 FY07 FY08 Unit sales is the total of sales of completed products of Honda and its consolidated subsidiaries and sales of parts for Honda’s affiliates accounted for under the equity method. 30
- 34. Power Products & Other Businesses Net Sales/Operating Income/Operating Margin FY07 FY08 FY07 FY08 1Q 2Q 3Q 4Q 1Q 2Q 3Q 4Q Twelve Months Twelve Months Yen Net Sales 108.4 100.0 105.0 125.3 115.2 105.0 100.2 122.3 438.9 442.7 (billions) Yen (- 2.4%) (+ 0.9%) (billions) Operating Income 40 Operating Margin 14% 35 12% 30 10.2% 9.9% 10% 25 8.2% 7.5% 8% 6.9% 20 6.6% 5.0% 6% 15 5.8% 4.2% 4% 10 2.3% 2% 5 11.0 7.4 10.4 7.2 7.9 6.9 2.2 5.1 36.1 22.3 0 0% FY07 1Q 2Q 3Q 4Q FY08 1Q 2Q 3Q 4Q FY07 FY08 31
- 35. Financial Services Business Net Sales/Operating Income/Operating Margin FY07 FY08 FY07 FY08 1Q 2Q 3Q 4Q 1Q 2Q 3Q 4Q Twelve Months Twelve Months * * * * * * Yen Net Sales 90.8 98.9 105.0 118.4 129.8 137.8 139.6 141.7 413.3 549.0 (billions) Yen (+ 19.6%) (+ 32.8%) (billions) Operating Income * Including increased net sales due to start of operating lease transaction Operating Margin 120 34.6% 110 32.2% 100 28.0% 30% 26.4% 90 80 21.3% 22.1% 21.5% 70 22.8% 21.7% 20% 60 50 16.4% 40 10% 30 20 10 29.2 22.6 22.7 40.9 34.2 29.3 22.9 31.3 115.5 117.7 0 0% FY07 1Q 2Q 3Q 4Q FY08 1Q 2Q 3Q 4Q FY07 FY08 32
- 36. Change in Income Before Income Taxes < FY08 4th Quarter > Income before Income taxes Yen (billions) - 92.2 bn. yen ( - 38.6 % ) Other Income Operating Income - 81.3 bn. yen ( - 32.5 %) & Expenses - 10.8 bn. yen <Increase Factors> <Decrease Factors> - Continuing cost reduction effects, etc. - Increase in provision for the allowance for <Decrease Factors> credit losses - Increased raw material costs - Increase in quality related expenses - Increase in depreciation expenses, etc. - Increased logistics expenses due to the increase in unit sales, etc. - 28.3 + 31.6 - 46.2 Revenue, + 4.4 Cost Reduction, model mix, the effect of raw Increase Decrease etc. material cost in SG&A - 42.8 fluctuations, etc. in R&D Currency - 27.0 + 16.1 Effect <Decrease Factors> Fair value of Others derivative - Increase in sales incentives in North America instruments - Change in model mix, etc. ( Exhibit 2) <Increase Factors> - Increased profit from increased automobile unit sales - Currency effect due to difference between average rates and transaction rates: + 28.1 bn. yen - Change in sales prices, etc. - Gain and loss from valuation of the balance of receivable and debt: - 12.0 bn. yen 239.0 146.8 FY07 4Q FY08 4Q 【Currency Effect 】 <Impact on Operating income> - 42.8 bn. yen (due to difference of average rates & translation effects) <Impact on Other income & expenses> + 28.1 bn. yen (due to difference between average rates and transaction rates) <Impact on Income before income taxes> - 14.6 bn. yen (see also Exhibit 1) 33
- 37. FY08 4th Quarter & Twelve Months Change in Income Before Income Taxes - Currency effects (effects associated with sales transactions and translation effects) - (Exhibit 1) Yen (billions) FY08 4Q Average Rates (Yen) FY08 Twelve months Effects in Yen Effects in Yen (billions) FY07 4Q FY08 4Q Change (billions) stronger JPY / USD - 44.5 120 106 by 14 yen - 34.5 weaker JPY / Euro + 0.5 157 158 by 1 yen + 15.2 JPY / Others - 0.2 ― ― ― + 23.6 between other currencies + 11.8 ― ― ― + 8.6 Due to difference of average rates *1: Impact of YOY difference of FOREX to be used for (Impact on Operating income) *1 - 32.3 booking revenue of foreign currency transactions + 13.0 Due to difference between average *2: Impact of YOY difference between average FOREX and *2 rates and transaction rates + 28.1 hedge rates during the period + 53.6 (Impact on Other income & expenses) Currency effect associated with sales transactions - 4.1 + 66.7 *3: Effect due to the difference of the rate used for Currency effect from translation translating Honda’s overseas subsidiaries’ financial of foreign financial statements *3 - 10.4 statements denominated in foreign currencies into + 24.6 Japanese yen with the corresponding period of the (Impact on Operating income) fiscal year Total - 14.6 + 91.3 34
- 38. FY08 4th Quarter & Twelve Months Change in Income Before Income Taxes - Gain and loss on derivative instruments - (Exhibit 2) Yen (billions) 4Q Twelve Months FY07 FY08 Change FY07 FY08 Change Gain and loss on fair value adjustments for foreign currency exchange contracts + 14.2 + 21.8 + 7.6 - 0.8 + 14.5 + 15.4 Interest rate swap - 6.6 - 41.0 - 34.3 - 28.7 - 84.2 - 55.5 Others - 0.7 - 1.0 - 0.3 - 27.2 - 0.5 + 26.6 Total + 6.7 - 20.2 - 27.0 - 56.8 - 70.2 - 13.4 Reference: (4Q) (Twelve Months) <Swap interest rate> <Swap interest rate> At the end of Dec, 2006 5.16% At the end of Dec, 2007 3.92% At the end of Mar, 2006 5.23% At the end of Mar, 2007 5.04% At the end of Mar, 2007 5.04% At the end of Mar, 2008 2.53% At the end of Mar, 2007 5.04% At the end of Mar, 2008 2.53% Difference (-0.12%) Difference (-1.39%) Difference (-0.19%) Difference (-2.51%) 35
- 39. Asia Equity in income of affiliates Yen + 7.6 + 13.4 (billions) ( + 114.3% ) ( + 18.5% ) 86.1 80 72.6 70 60 50 40 30 26.8 22.6 23.2 22.2 22.6 20.1 20 14.3 10 6.6 0 1Q 2Q 3Q 4Q 1Q 2Q 3Q 4Q Twelve Months Twelve Months FY07 FY08 FY07 FY08 Reference: Operating income & Net income of affiliates accounted for under the equity method in Asia Operating income 58.0 55.7 49.9 30.1 61.2 56.3 55.7 38.0 193.8 211.4 Net income 51.8 50.2 44.2 27.6 57.2 50.0 49.7 31.0 174.0 188.0 Affiliates accounted for under the equity method Motorcycle Business Automobile Business: China Sundiro Honda Motorcycle Co., Ltd.* China Guangzhou Honda Automobile Co., Ltd.* Wuyang-Honda Motors (Guangzhou) Co., Ltd.* Dongfeng Honda Engine Co., Ltd.* India Hero Honda Motors Ltd. Dongfeng Honda Automobile Co., Ltd.* Indonesia P.T. Astra Honda Motor* Malaysia Hicom-Honda MFG. Malaysia SDN. BHD. Pakistan Atlas Honda Limited* Others 37, Total 47 companies Thailand A.P. Honda Co., Ltd. As of the end of March, 2008 * Indicates fiscal term of companies differs from that of Honda Motor Co., Ltd. 36