Download to read offline

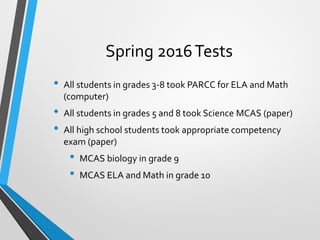
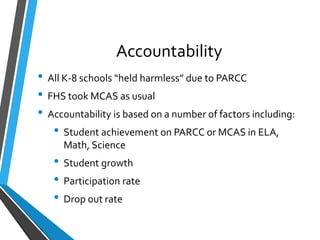
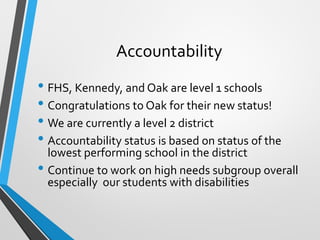
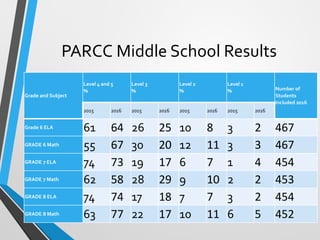
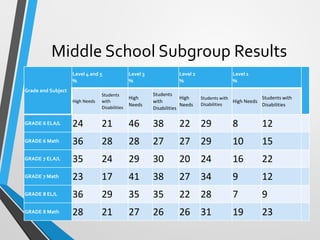
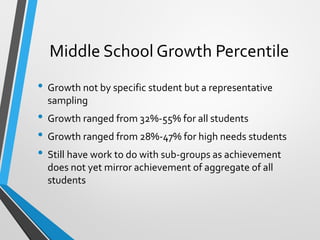
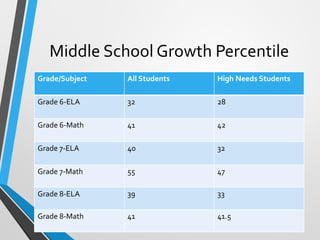
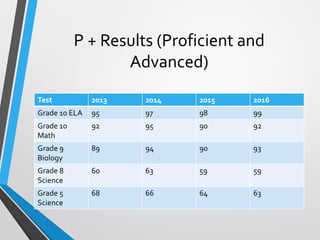
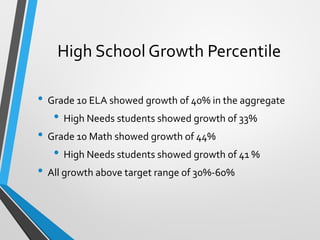
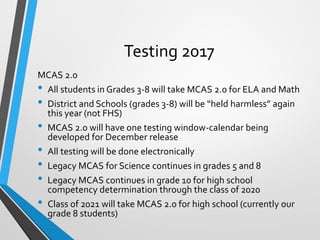


The document outlines the performance of Franklin Public Schools on the MCAS and PARCC assessments for Spring 2016, highlighting accountability statuses and achievement levels across various grades and subjects. Significant improvements were noted in student scores and growth percentiles, particularly for high needs students, though challenges remain in achieving equitable outcomes across subgroups. Looking ahead to 2017, all students in grades 3-8 will take the new MCAS 2.0 assessments, with the district being held harmless for accountability measures.


