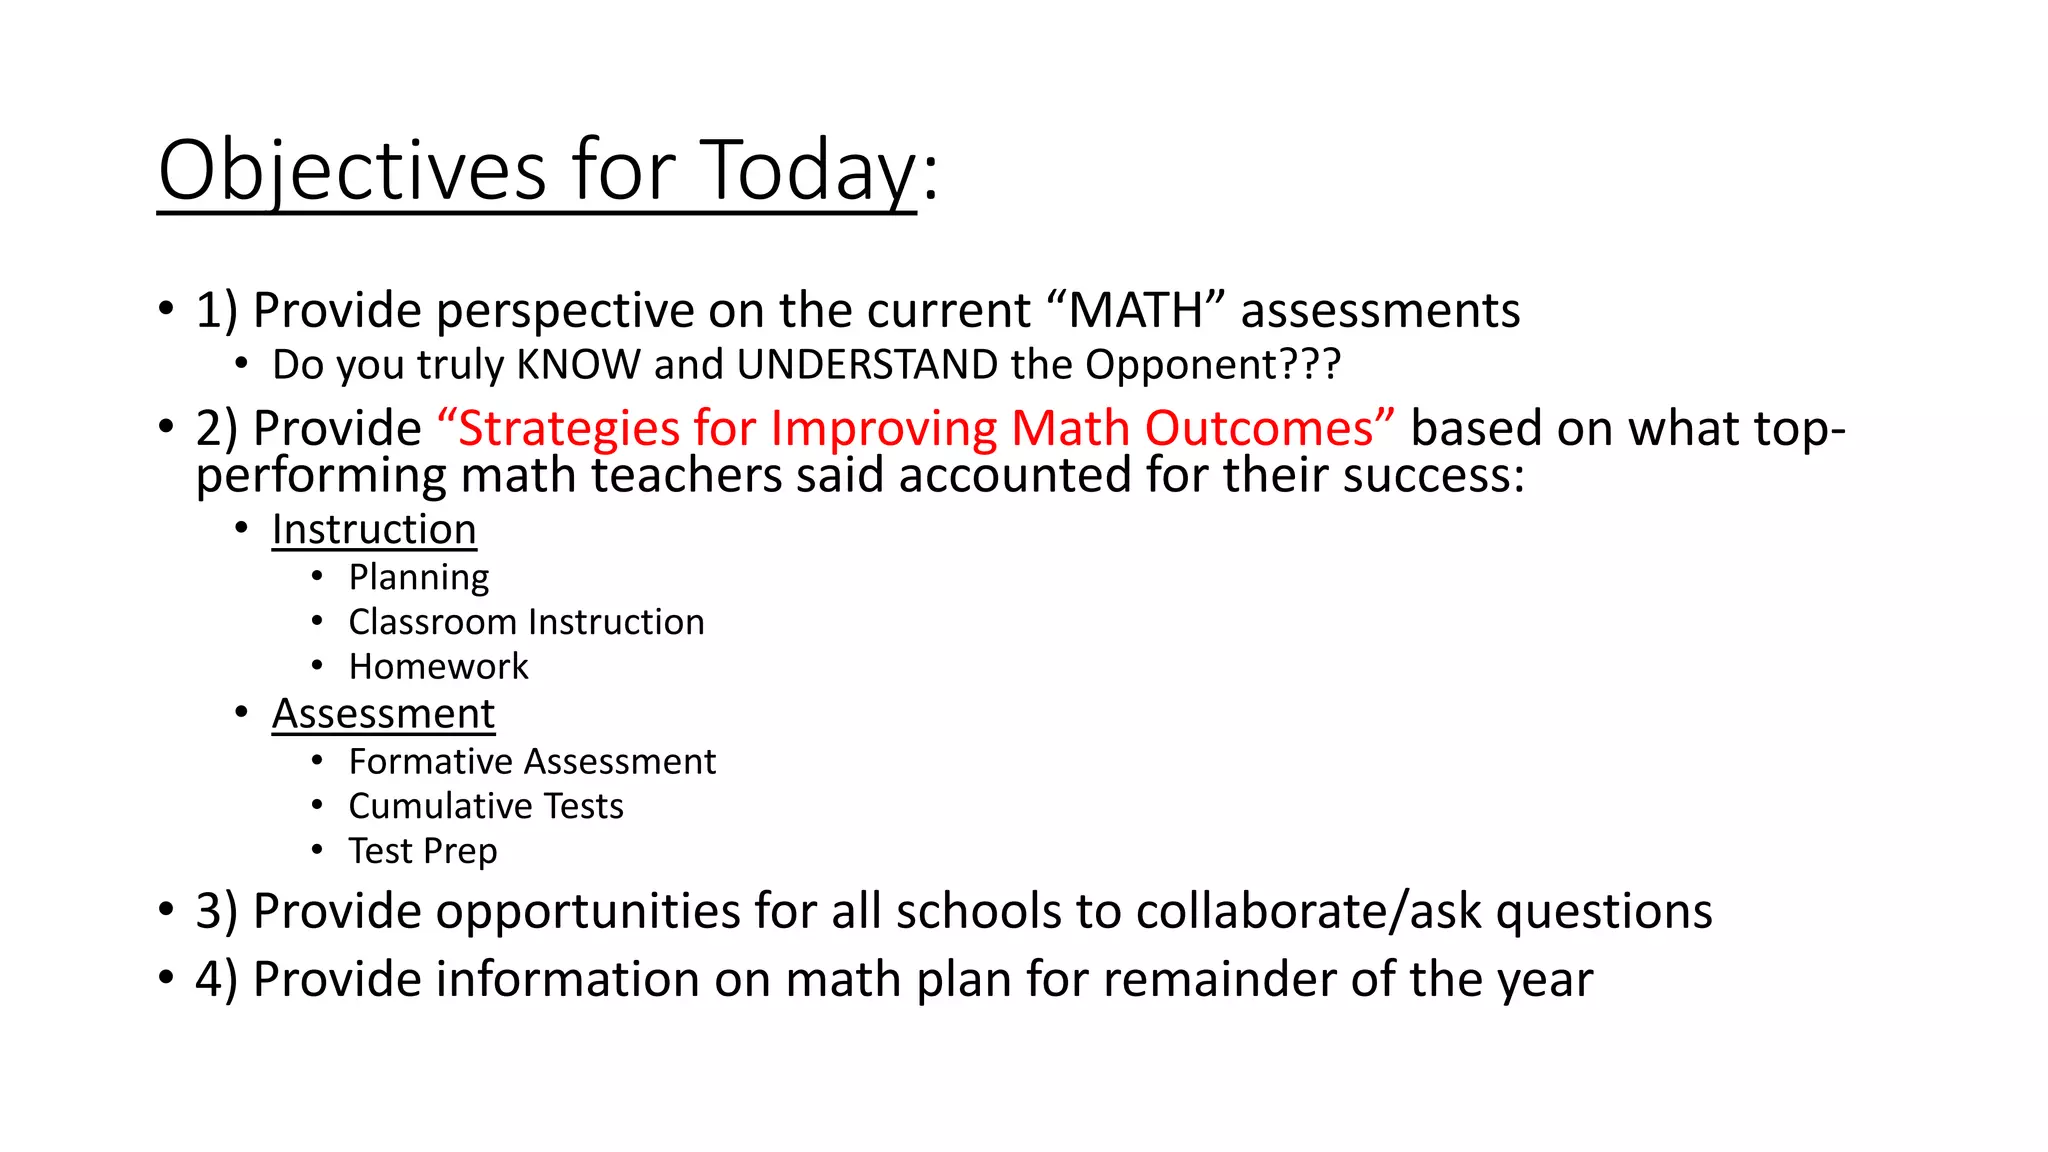
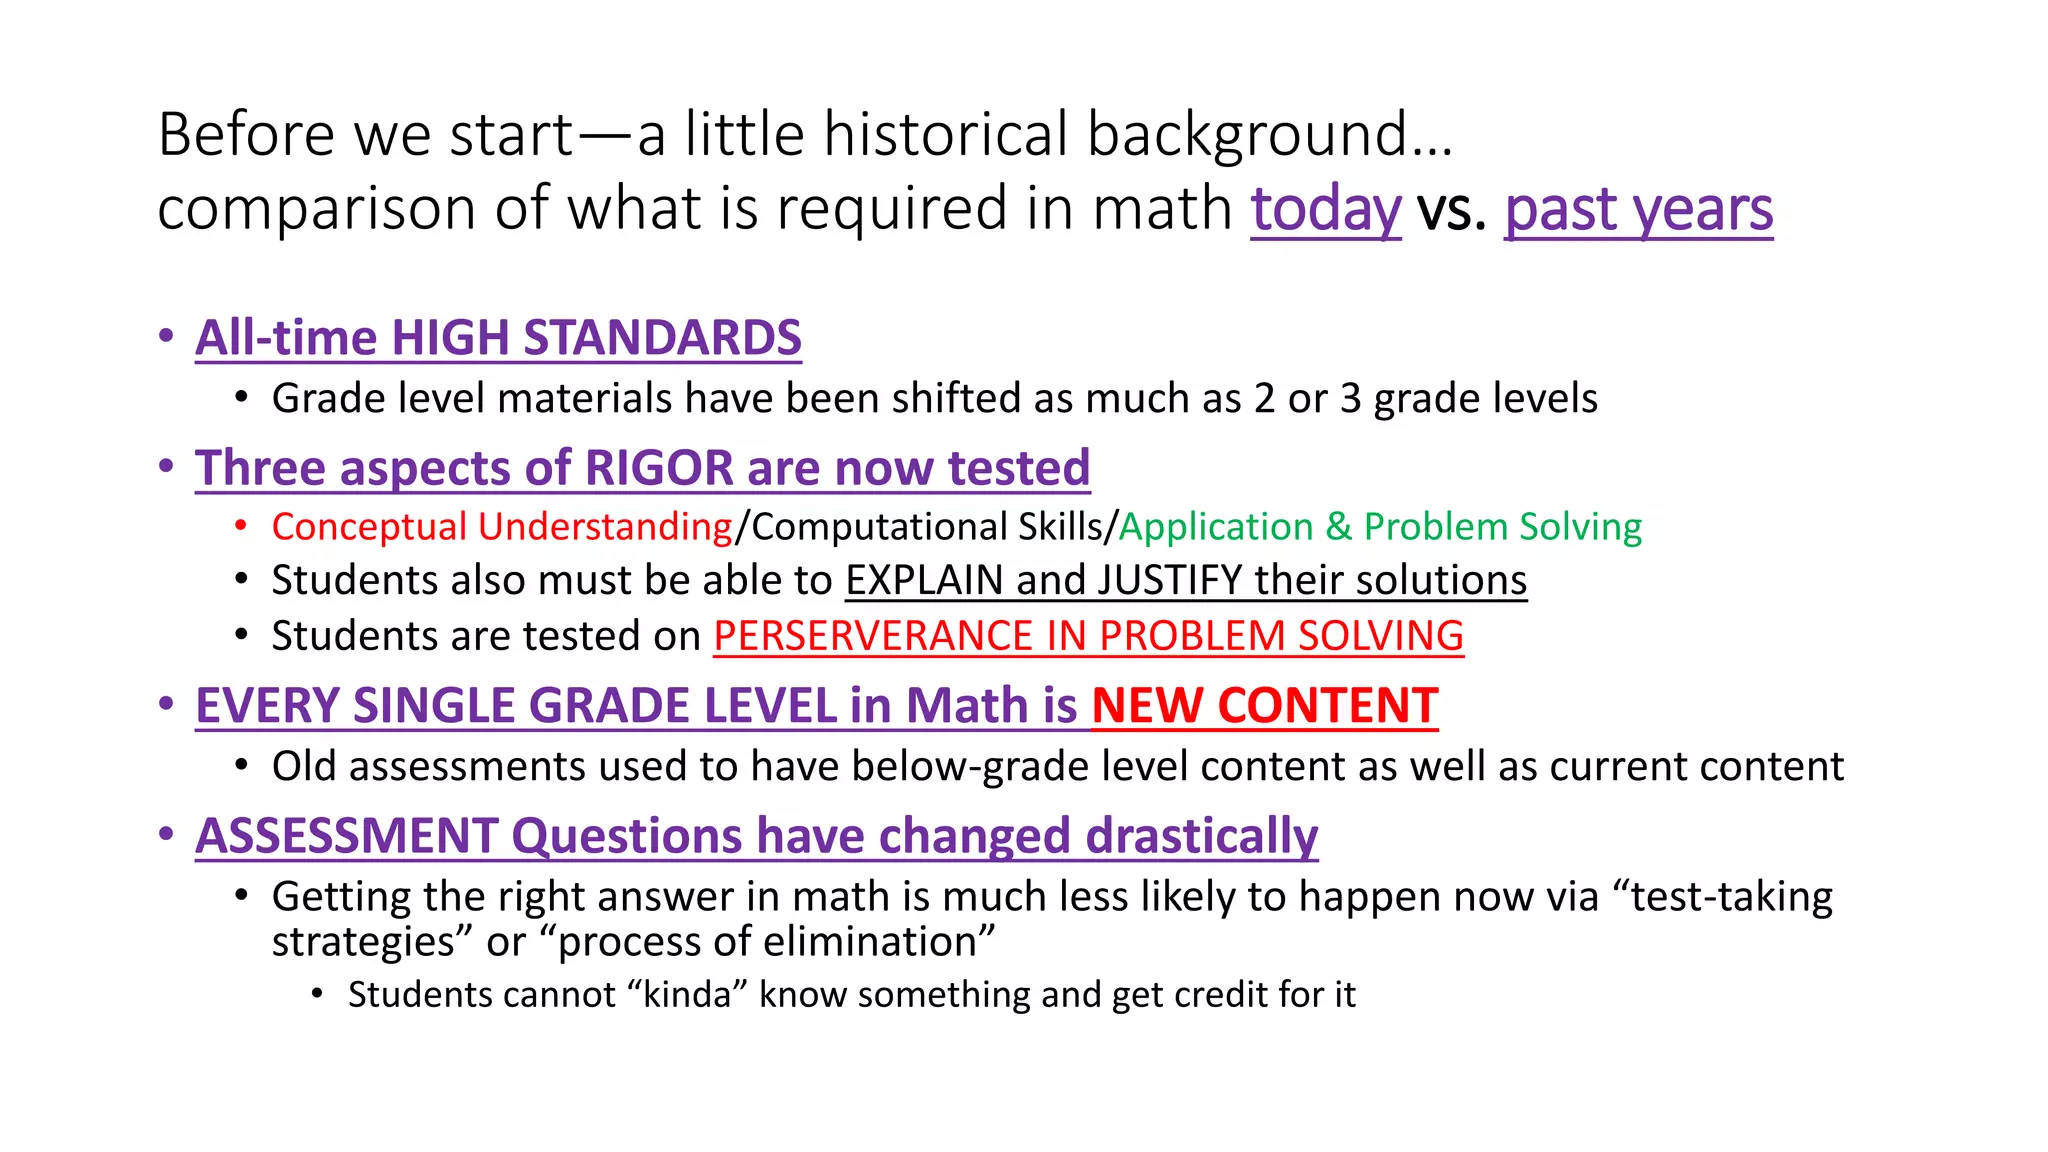
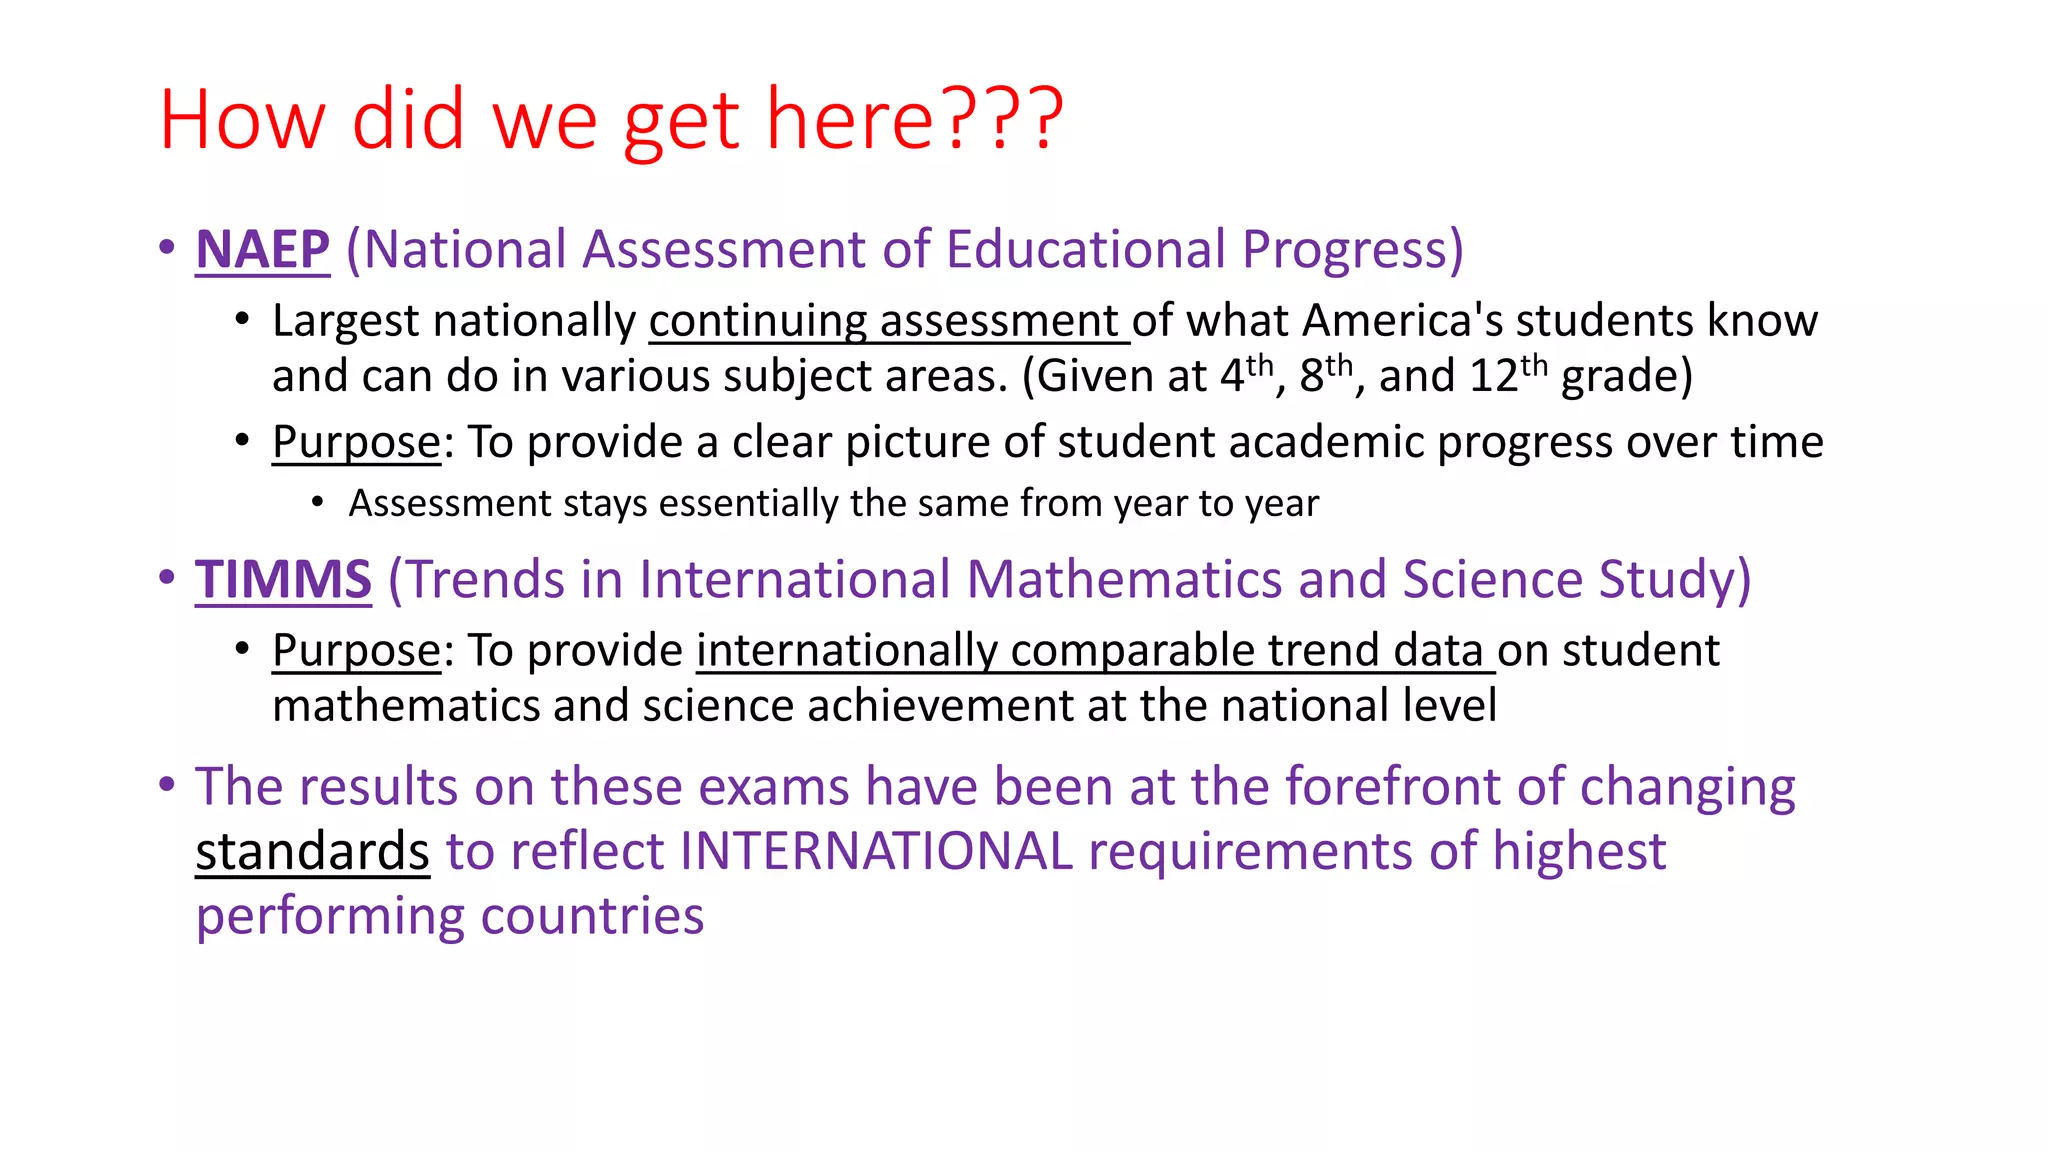
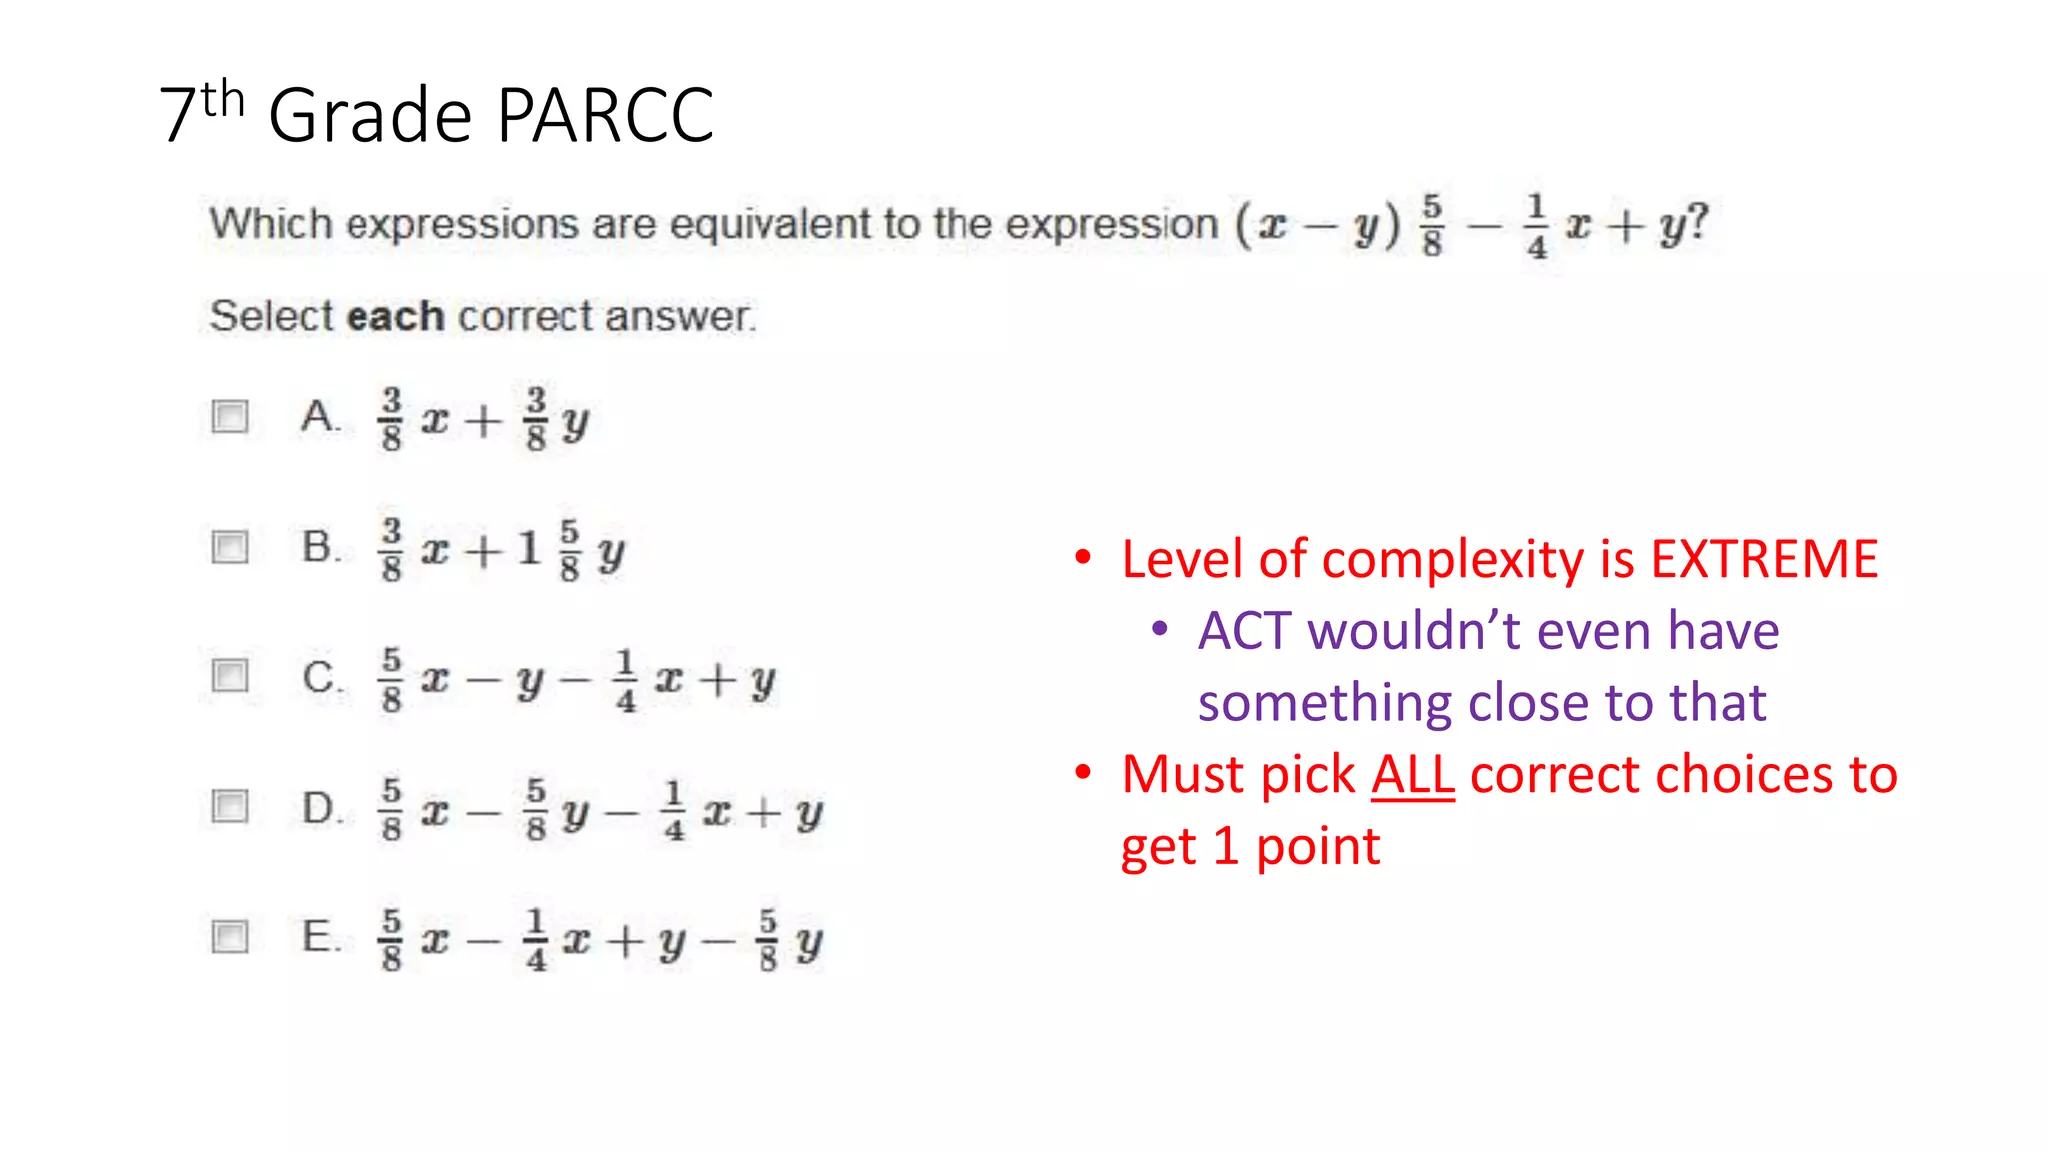
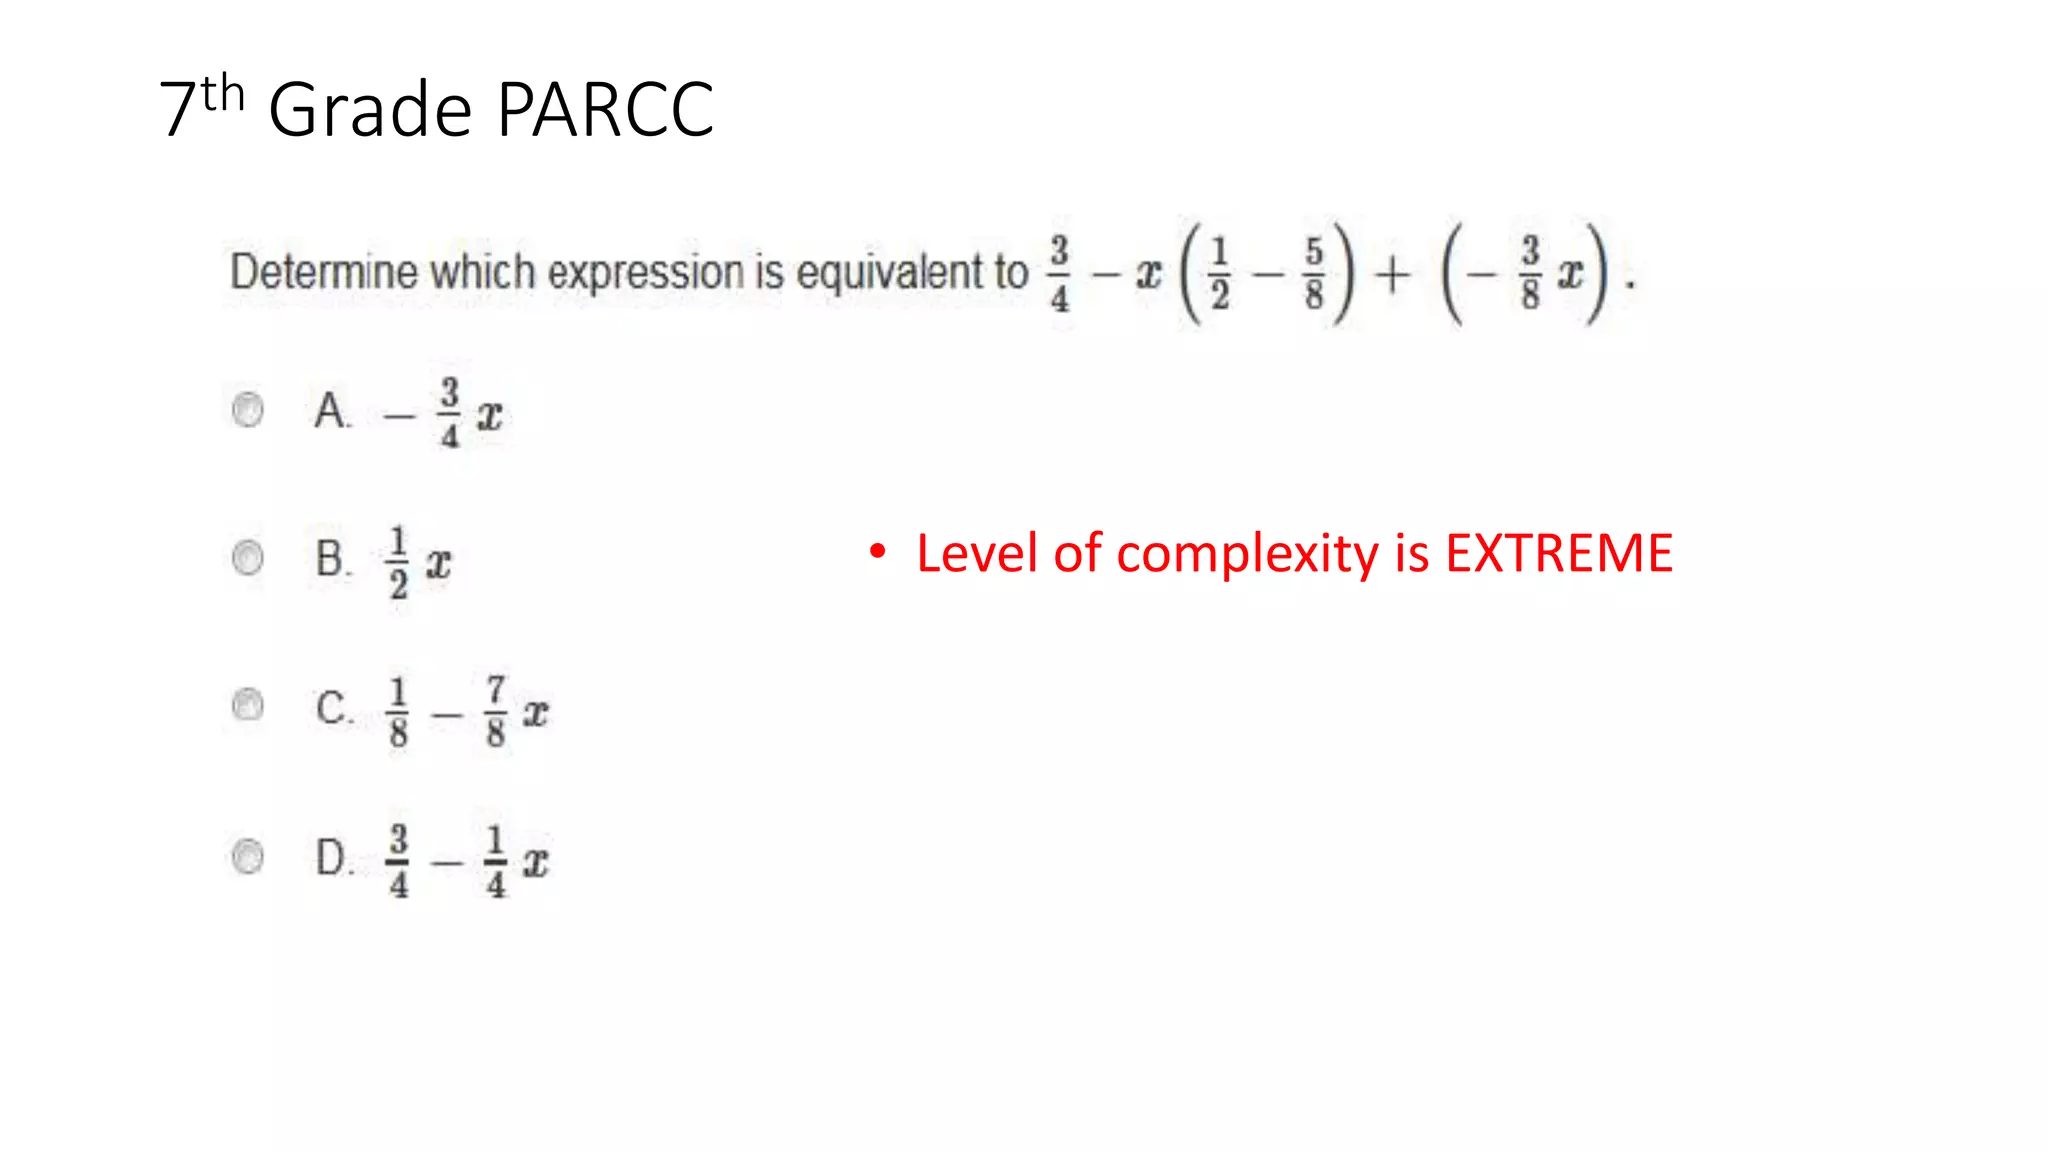
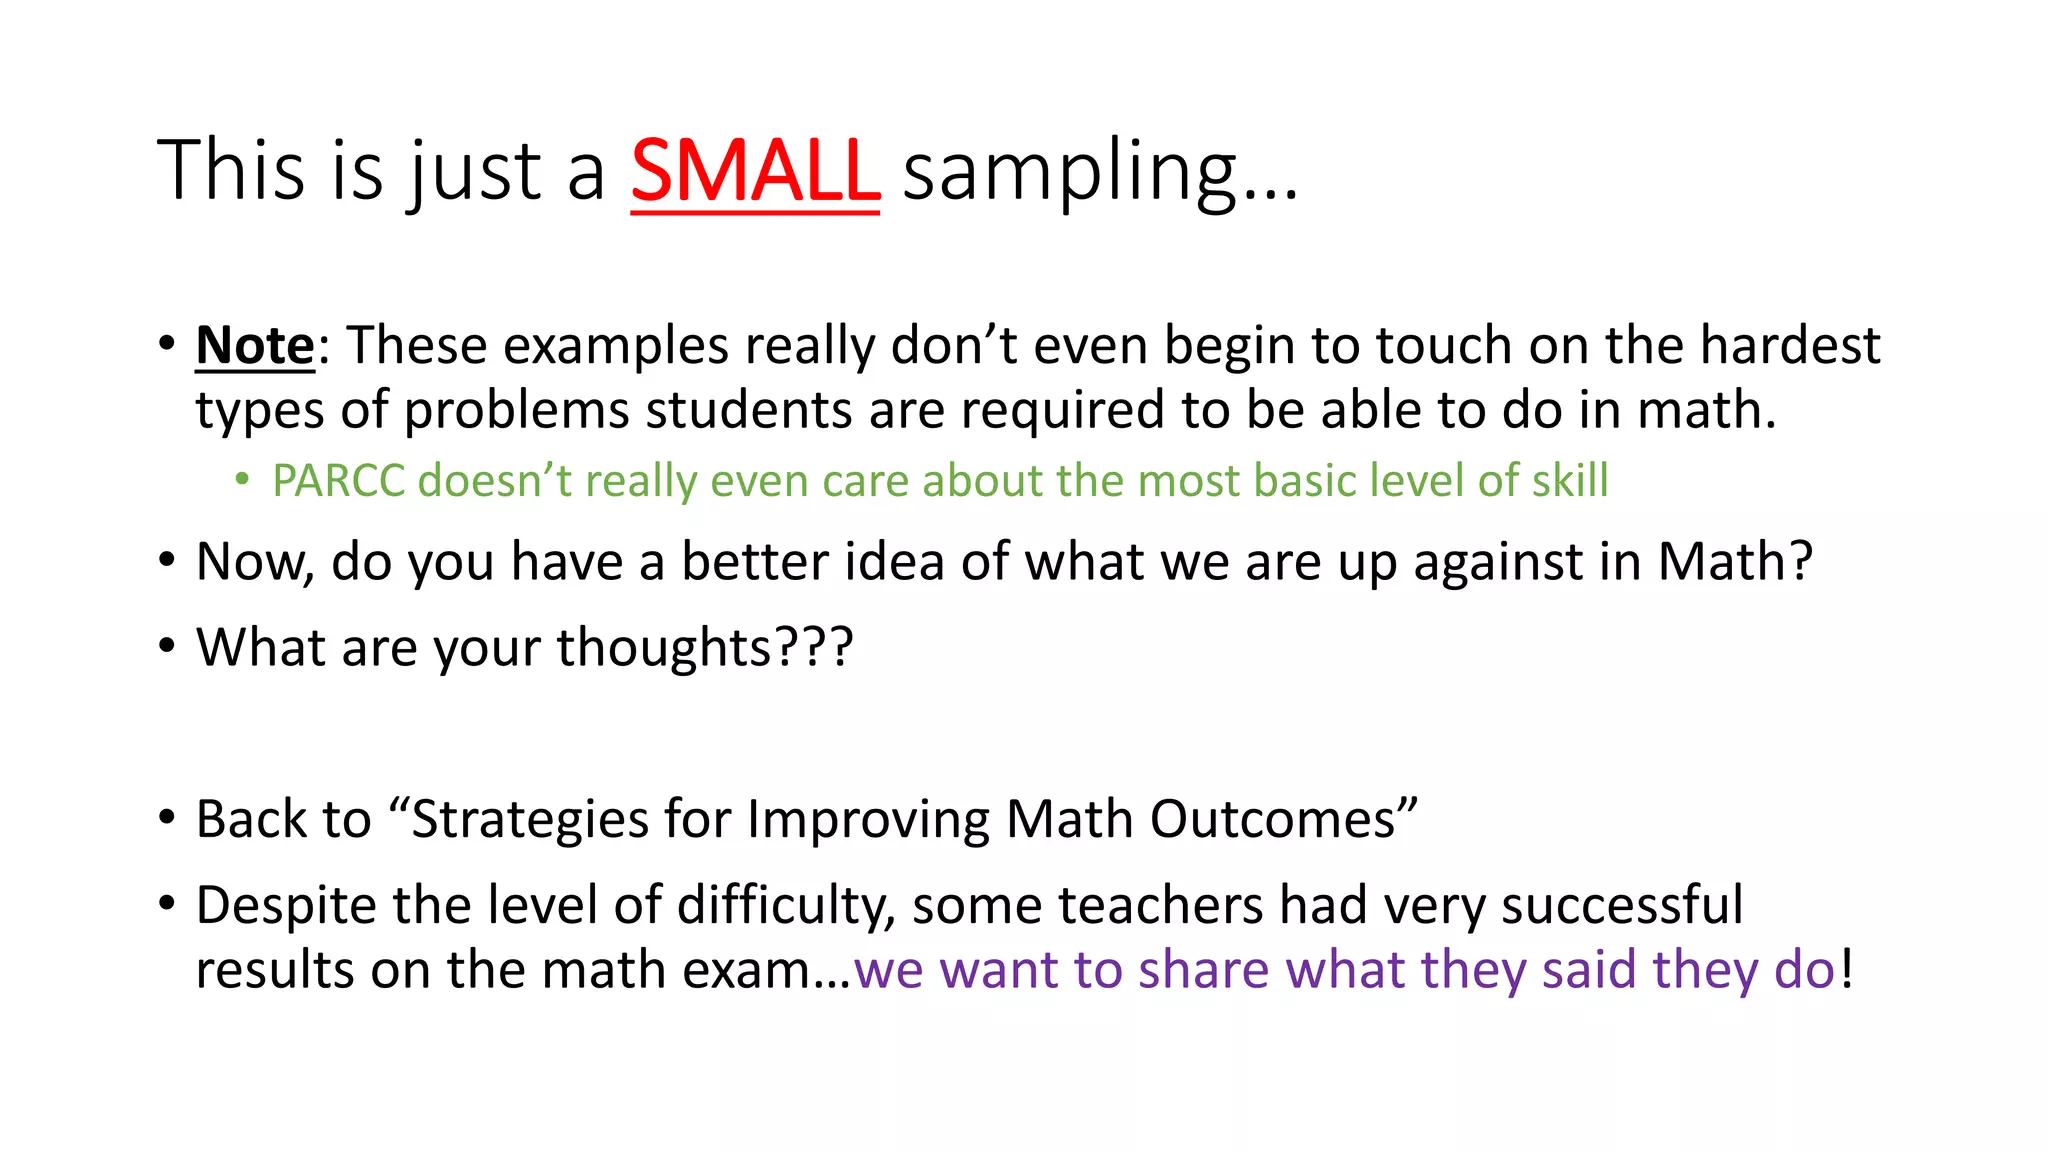
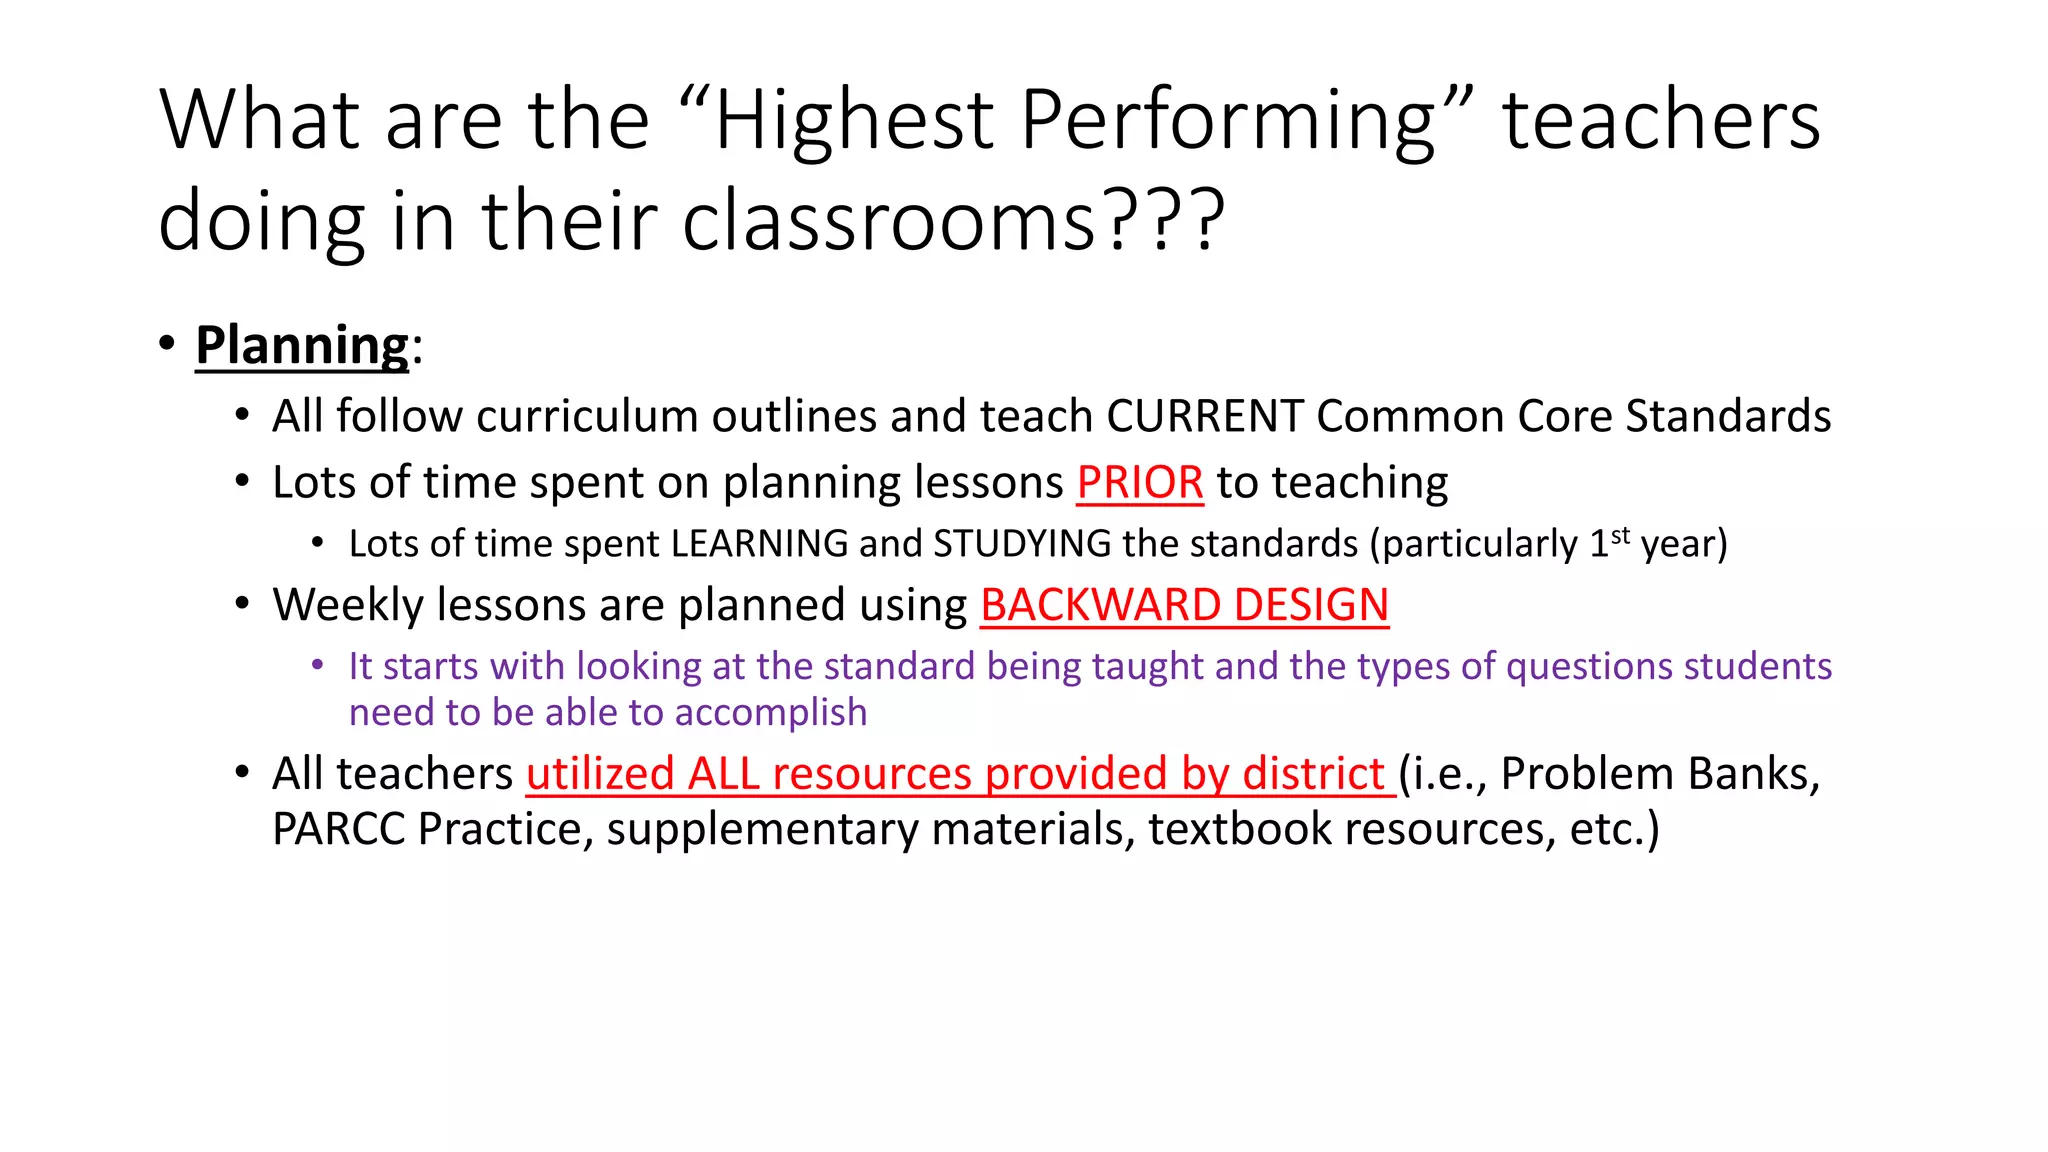
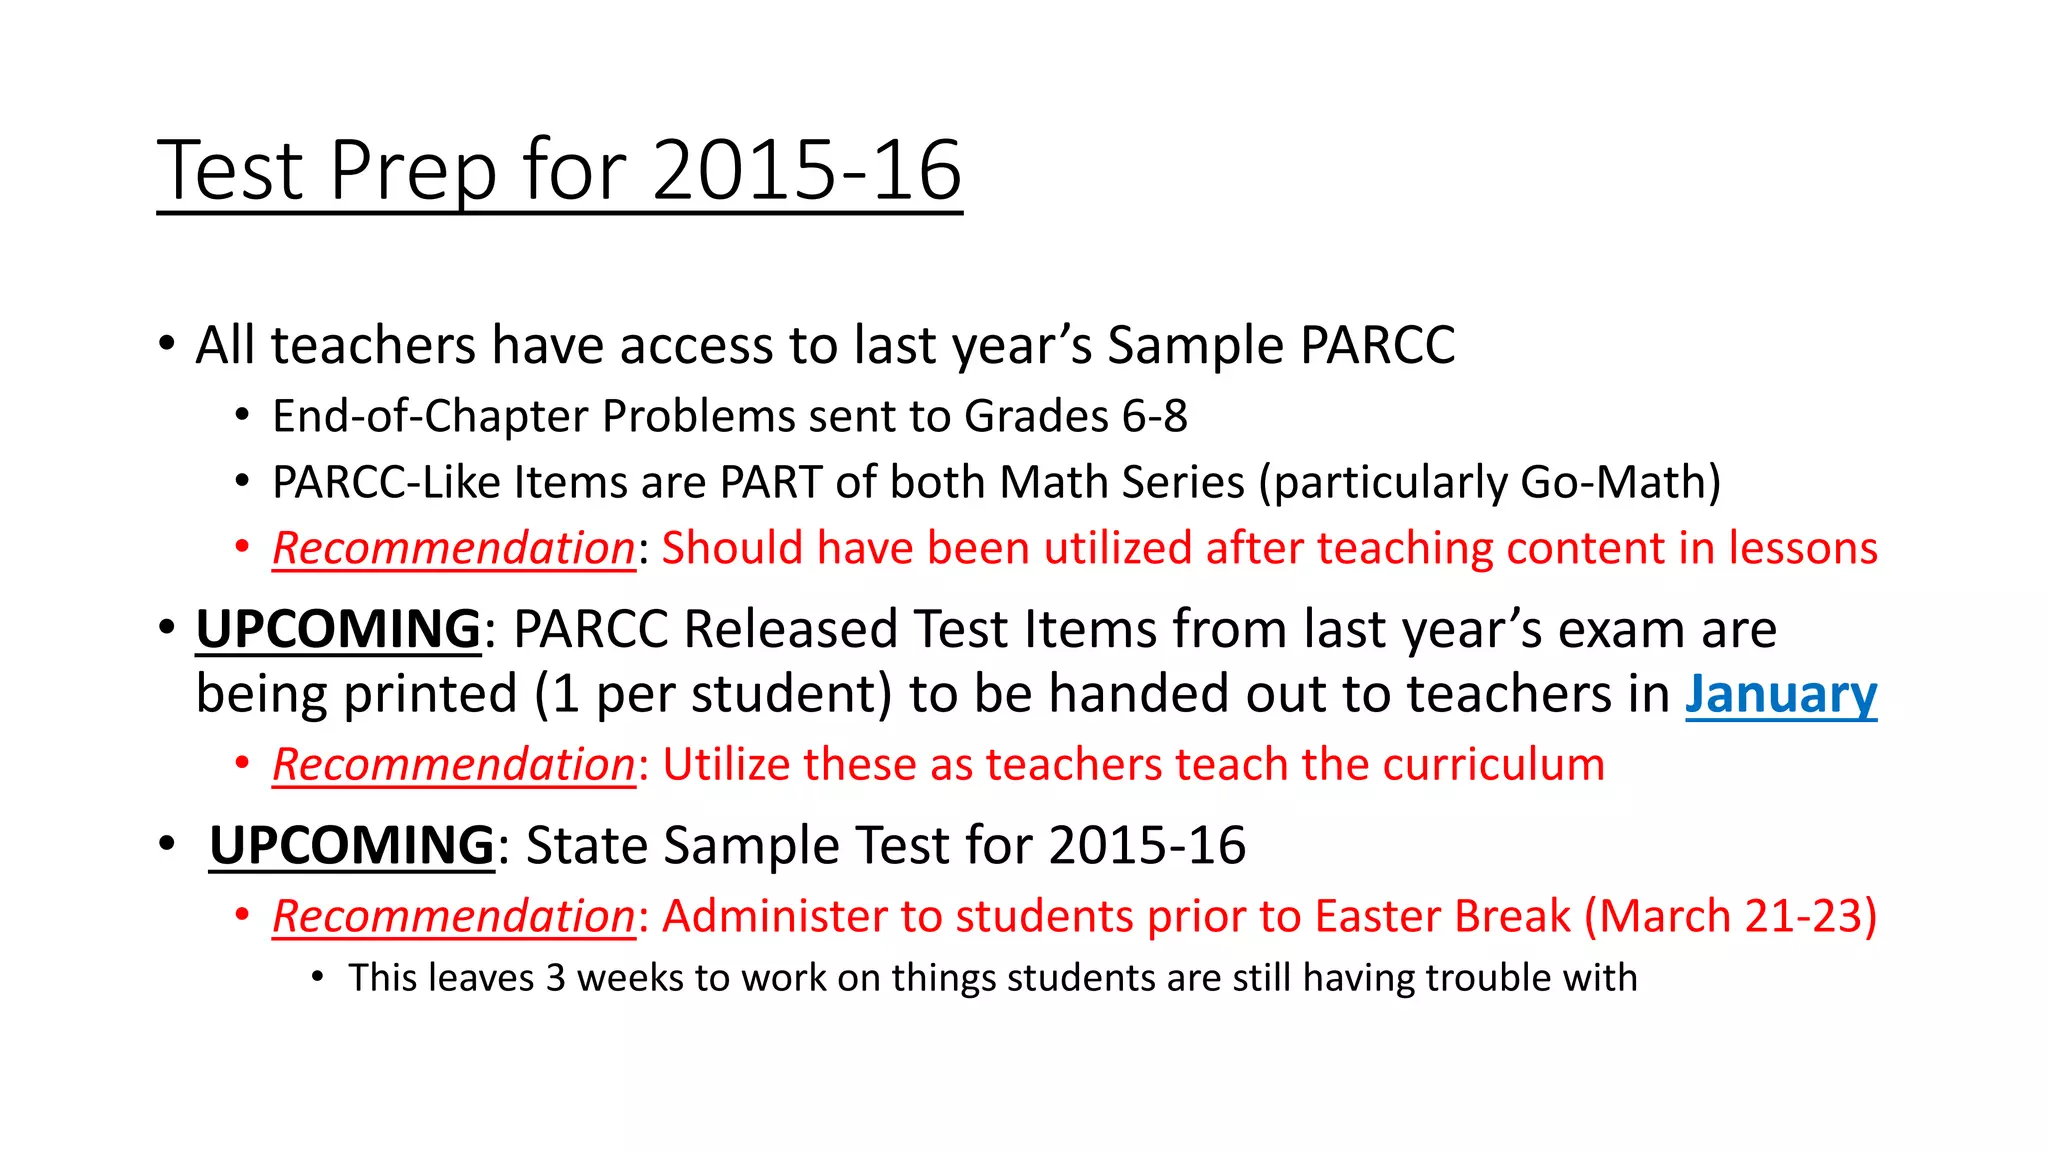
Math Summit
“Strategies for Improving Math Outcomes”
To Help You CLIMB to the TOP of the
MATH MOUNTAIN
Objectives for Today:
• 1) Provide perspective on the current “MATH” assessments
• Do you truly KNOW and UNDERSTAND the Opponent???
• 2) Provide “Strategies for Improving Math Outcomes” based on what top-
performing math teachers said accounted for their success:
• Instruction
• Planning
• Classroom Instruction
• Homework
• Assessment
• Formative Assessment
• Cumulative Tests
• Test Prep
• 3) Provide opportunities for all schools to collaborate/ask questions
• 4) Provide information on math plan for remainder of the year
Before we start—a little historical background…
comparison of what is required in math today vs. past years
• All-time HIGH STANDARDS
• Grade level materials have been shifted as much as 2 or 3 grade levels
• Three aspects of RIGOR are now tested
• Conceptual Understanding/Computational Skills/Application & Problem Solving
• Students also must be able to EXPLAIN and JUSTIFY their solutions
• Students are tested on PERSERVERANCE IN PROBLEM SOLVING
• EVERY SINGLE GRADE LEVEL in Math is NEW CONTENT
• Old assessments used to have below-grade level content as well as current content
• ASSESSMENT Questions have changed drastically
• Getting the right answer in math is much less likely to happen now via “test-taking
strategies” or “process of elimination”
• Students cannot “kinda” know something and get credit for it
Example:
5th Grade PARCC
To get 1 point, a student
must correctly answer all
“holes” correctly
To get 1 point, a student
must correctly solve the
problem (no choices to
choose from)
How did we get here???
• NAEP (National Assessment of Educational Progress)
• Largest nationally continuing assessment of what America's students know
and can do in various subject areas. (Given at 4th, 8th, and 12th grade)
• Purpose: To provide a clear picture of student academic progress over time
• Assessment stays essentially the same from year to year
• TIMMS (Trends in International Mathematics and Science Study)
• Purpose: To provide internationally comparable trend data on student
mathematics and science achievement at the national level
• The results on these exams have been at the forefront of changing
standards to reflect INTERNATIONAL requirements of highest
performing countries
Standards vs. Assessments
The big difference…
• Standards simply state what students should know and be able to do
• For the most part, we believe the current COMMON CORE standards are
attainable…IF every grade level does their part
• This is still a problem in our district (this is where school-level oversight is needed)
• ASSESSMENT: How students are tested to determine if they
understand the standards
• This is the REAL PROBLEM! It has become EXTREME!!!
• PARCC—it’s what they do with the standards and their testing protocols in
Math that makes the math requirements so hard to accomplish
• Example: Multiple select problems (scoring only rewards FULL correctness of multiple
elements)
• Example: EXTREME Problem solving which tests students PERSISTENCE as well as their
READING COMPREHENSION
• Students also have to respond with unique mathematical language and justify their
reasoning in sometimes very specific ways
PARCC Exam: The GOOD and the BAD
• GOOD: There are problems which are not extreme and rather traditional
• BAD: Problems are still 1 or 2 grade levels ahead of what used to be tested
• BAD: Test results (RAW DATA) across the nation show that this test in math is
not for the average tester
• Ex: Only 8% of the students (on average) in the top state (Massachusetts) can get 65% of
the test correct.
• Other things of note:
• We went from Grades 3-5 using calculators to them having no calculator
usage on the full exam so FLUENCY is even more important
• GOOD: New Textbook Series SHOULD help better prepare students
• GOOD: New Testing Time Frame SHOULD provide more time for LEARNING
prior to the assessment
A Closer look….
• How have the standards and assessments changed through the
years???
• PARCC (2014) vs NAEP (1990)
• A SMALL sampling—to give perspective on the drastic changes over the years
NAEP Question (1990)
20% Correct
5th Grade PARCC
To get 1 point, a
student must
correctly answer
B, C, and F
otherwise no
credit is given
5th Grade PARCC
Notice the level of
analysis required in
these problems in
comparison to what
once was a HARD
standard math question
for Grade 8 (much less
for Grade 5)
NAEP Question (1990)
30% Correct
Notice that they
only have to plot a
SINGLE point in the
first quadrant of the
coordinate plane
5th Grade PARCC
To get 1 point all of
the points must be
correctly placed.
If a single point is
placed in the wrong
spot, the entire
problem is wrong.
8th Grade PARCC
This is a
TYPE 1
problem
for 8th
grade. It’s
considered
an easy
problem.
NAEP Question (1990)
33% Correct
6th Grade PARCC
NO Calc
CALC Allowed
Again, notice the
complexity of the
numbers involved
and the grade level.
Also you can’t
GUESS the correct
choice.
NAEP Question (1990)
13% Correct
6th Grade PARCC
This is a TYPE 3 problem
for Grade 6
(modeling/application)
NAEP Question (1990)
14% Correct
7th Grade PARCC
• Level of complexity is EXTREME
• ACT wouldn’t even have
something close to that
• Must pick ALL correct choices to
get 1 point
7th Grade PARCC
• Level of complexity is EXTREME
This is just a SMALL sampling…
• Note: These examples really don’t even begin to touch on the hardest
types of problems students are required to be able to do in math.
• PARCC doesn’t really even care about the most basic level of skill
• Now, do you have a better idea of what we are up against in Math?
• What are your thoughts???
• Back to “Strategies for Improving Math Outcomes”
• Despite the level of difficulty, some teachers had very successful
results on the math exam…we want to share what they said they do!
What are the “Highest Performing” teachers
doing in their classrooms???
• Surveyed the following teachers:
• Dawn Peck & Andrea Vidrine(Grand Prairie 3rd Grade)
• Billie Cortez(Palmetto 3rd & 4th Grade)
• Tiffany Pedigo(Eunice Elementary 3rd & 4th Grade)
• Lana Duvall(Krotz Springs 6th Grade)
• Jamie Stelly(Leonville 7th & 8th Grade)
• Amy Lanclos(formerly Southwest Grade 5 now at Grolee)
• All were in the top two at their respective grade levels in scoring and
most were “A” or “B” in their overall student scores in math.
What are the “Highest Performing” teachers
doing in their classrooms???
• Planning:
• All follow curriculum outlines and teach CURRENT Common Core Standards
• Lots of time spent on planning lessons PRIOR to teaching
• Lots of time spent LEARNING and STUDYING the standards (particularly 1st year)
• Weekly lessons are planned using BACKWARD DESIGN
• It starts with looking at the standard being taught and the types of questions students
need to be able to accomplish
• All teachers utilized ALL resources provided by district (i.e., Problem Banks,
PARCC Practice, supplementary materials, textbook resources, etc.)
Classroom Instruction: (Jonel)
Instructional Time
• Varies from 1 hour to 2 hours
• Note: Most high performing districts spend 90 – 120 minutes on math at each grade
• All teachers agree that extended time helps tremendously to truly reach
the levels required by the common core math standards
• 1 school offers 90 minutes to weaker group and 60 minutes to the stronger group
• 1 school alternates the times they meet every six weeks
• All teachers teach bell-to-bell and fight constantly to protect instructional
time
• Computer lab is done in ADDITION TO regular classroom instruction (with
the exception of 1 teacher and that teacher would like lab to be in addition
as it sets her back in curriculum—20% of time spent in lab going once per
week).
Classroom Instruction:
What does instruction look like???
• All teachers have a BLEND of Direct Instruction & Pairing/Small Group work
• Direct Instruction has “Lots of Questioning” and Teacher/Student Interaction
• Group work has 2 or 3 people work together “each and every day” throughout lesson
• Sense-making of the math being taught is a HUGE part of the classroom for both teacher and student
• Connections made between what was learned before and also what will be learned later
• Problems are solved using drawings and approaches are developed when problem solving
• Students expected to explain orally or in writing their understanding of a concept via talking to partner
or as whole class
• Students must explain their work to one another, justify their work and approaches to solving
problems, critiquing one another’s work, etc.
• Group work is more than just students working on problem together
• Elementary Grades (K-4) use manipulatives each time a new concept is introduced to develop concrete
understanding of concepts
• High Level of Expectations with Differentiated Problems for Highest and Lowest learners are part of every
class
• High Learners given toughest problems
• Lower learners are pulled into small group with teacher to address shortcomings
Classroom Instruction:
What about Homework???
• Homework is given EVERY NIGHT (Monday – Thursday) to support
learning which was done during instructional time
• Average of 7 – 15 problems
• Homework is checked the next day and gone over thoroughly as a class
• All answers are reviewed but only particular problems that gave most students problems
were THOROUGHLY gone over as a class LED BY THE TEACHER!!!
• 1 teacher has students work together on previous night’s homework a small
amount of time to open class before going over as a class
Assessment: (Scott)
Formative Assessments
• All teachers utilize shorter quizzes to “check student understanding”
of skills being taught
• Some teachers require students to make corrections to any problems missed
• All teachers utilized exit slips at least 2 or 3 times a week to monitor
student understanding and to use this information when forming
small groups
• In some classes Dry erase boards are used for “quick checks” during
instruction after students work in the book
• If students don’t get problems right, teachers use this information to provide
additional instruction/work in this skill.
Assessment:
CUMULATIVE Tests
• ALL teachers believe this is a CRITICAL part of their success on end-of-year testing
• Most teachers give 2 or 3 CUMULATIVE TESTS per six weeks
• 2 teachers do as much as once per week
• Tests consists of approximately ½ review of previously taught material and ½ on the newest
material that has been taught
• Once per six weeks, in a few teachers classes, students are required to make corrections on
the problems they missed
• Spiral Review is an ONGOING part of instruction and assessment in all classes
• Fluency routines, practice, and assessment is a big part of the class
• Cumulative tests are at a HIGH COGNITIVE DEMAND and include the three
aspects of Rigor (conceptual understanding; computational skills; problem
solving/application)
• Grade distribution for all teachers was pretty consistent
• Very few A’s, lots of C’s and D’s and in some cases as much as 1/3 of the students have F’s.
• It was apparent that the level of expectation was very high in all classes for both instruction
and assessment
Assessment:
CUMULATIVE Tests
• ACTIVITY:
• Take time to really look at the Sample Cumulative Tests provided by
the teachers (15 minutes)
• Be prepared to ask questions regarding things you notice or have
questions about
Test Prep:
What did you do to prepare your students?
• ALL teachers utilized all of the resources provided by the district
(which includes state assessment materials)
• Test-Prep is not seen as a separate event, but an ONGOING part of
the classroom INSTRUCTION & ASSESSMENT
• There is no such thing as “STOP TEACHING AND JUST DO SAMPLE TESTS”
Test Prep for 2015-16
• All teachers have access to last year’s Sample PARCC
• End-of-Chapter Problems sent to Grades 6-8
• PARCC-Like Items are PART of both Math Series (particularly Go-Math)
• Recommendation: Should have been utilized after teaching content in lessons
• UPCOMING: PARCC Released Test Items from last year’s exam are
being printed (1 per student) to be handed out to teachers in January
• Recommendation: Utilize these as teachers teach the curriculum
• UPCOMING: State Sample Test for 2015-16
• Recommendation: Administer to students prior to Easter Break (March 21-23)
• This leaves 3 weeks to work on things students are still having trouble with
Latest Testing Information (Grades 3-5 Math)
• Three Sessions (1 per day): Total Points = 62
• Session 1: 14 items (60 – 90 minutes)
• Session 2: 14 items (60 – 90 minutes)
• Session 3: 14 items (60 – 90 minutes)
• Each session contains a balanced set of Type I, II, and III items
• Major Content: 84% of Test
• Type I—30 points or 48% of Test
• Type II—10 points or 16% of Test
• Type III—12 points or 19% of Test
• Additional & Supporting Content: 16% of Test
• Type I—10 points or 16% of Test
Latest Testing Information (Grades 6-8 Math)
• Three Sessions (1 per day): Total Points = 66
• Session 1: 18 items (60 – 90 minutes) TYPE 1 Problems Only (No Calculator)
• Session 2: 13 items (60 – 90 minutes) Calculator Allowed
• Session 3: 12 items (60 – 90 minutes) Calculator Allowed
• Sessions 2 & 3 contains a balanced set of Type I, II, and III items
• Major Content: 85% of Test
• Type I—30 points or 45% of Test
• Type II—14 points or 21% of Test
• Type III—12 points or 18% of Test
• Additional & Supporting Content: 15% of Test
• Type I—10 points or 15% of Test
Important PD Date to Plan For…
• Upcoming Math Inservice:
• Resource Center on Monday, January 11, 2016 for math teachers
• Grades 3 – 5 (½ day from 8:00 – 11:00)
• Grades 6 – 8 (½ day from 12:00 – 3:00)
• Subs will be paid for through Ms. Blanchard (if needed).
• For those math teachers who may teach at both grade intervals (such as a teacher who
teaches both Grades 5 & 6) they should plan to attend both sessions (all day).
• Please make plans for your math teachers to attend the appropriate
sessions on this date.
Final Thoughts/Comments/Questions
Special Thanks to the Teachers who shared their BEST
PRACTICES and SAMPLE TESTS to help all schools!!

Math Summit

  • 1.
    Math Summit “Strategies forImproving Math Outcomes” To Help You CLIMB to the TOP of the MATH MOUNTAIN
  • 2.
    Objectives for Today: •1) Provide perspective on the current “MATH” assessments • Do you truly KNOW and UNDERSTAND the Opponent??? • 2) Provide “Strategies for Improving Math Outcomes” based on what top- performing math teachers said accounted for their success: • Instruction • Planning • Classroom Instruction • Homework • Assessment • Formative Assessment • Cumulative Tests • Test Prep • 3) Provide opportunities for all schools to collaborate/ask questions • 4) Provide information on math plan for remainder of the year
  • 3.
    Before we start—alittle historical background… comparison of what is required in math today vs. past years • All-time HIGH STANDARDS • Grade level materials have been shifted as much as 2 or 3 grade levels • Three aspects of RIGOR are now tested • Conceptual Understanding/Computational Skills/Application & Problem Solving • Students also must be able to EXPLAIN and JUSTIFY their solutions • Students are tested on PERSERVERANCE IN PROBLEM SOLVING • EVERY SINGLE GRADE LEVEL in Math is NEW CONTENT • Old assessments used to have below-grade level content as well as current content • ASSESSMENT Questions have changed drastically • Getting the right answer in math is much less likely to happen now via “test-taking strategies” or “process of elimination” • Students cannot “kinda” know something and get credit for it
  • 4.
    Example: 5th Grade PARCC Toget 1 point, a student must correctly answer all “holes” correctly To get 1 point, a student must correctly solve the problem (no choices to choose from)
  • 5.
    How did weget here??? • NAEP (National Assessment of Educational Progress) • Largest nationally continuing assessment of what America's students know and can do in various subject areas. (Given at 4th, 8th, and 12th grade) • Purpose: To provide a clear picture of student academic progress over time • Assessment stays essentially the same from year to year • TIMMS (Trends in International Mathematics and Science Study) • Purpose: To provide internationally comparable trend data on student mathematics and science achievement at the national level • The results on these exams have been at the forefront of changing standards to reflect INTERNATIONAL requirements of highest performing countries
  • 6.
    Standards vs. Assessments Thebig difference… • Standards simply state what students should know and be able to do • For the most part, we believe the current COMMON CORE standards are attainable…IF every grade level does their part • This is still a problem in our district (this is where school-level oversight is needed) • ASSESSMENT: How students are tested to determine if they understand the standards • This is the REAL PROBLEM! It has become EXTREME!!! • PARCC—it’s what they do with the standards and their testing protocols in Math that makes the math requirements so hard to accomplish • Example: Multiple select problems (scoring only rewards FULL correctness of multiple elements) • Example: EXTREME Problem solving which tests students PERSISTENCE as well as their READING COMPREHENSION • Students also have to respond with unique mathematical language and justify their reasoning in sometimes very specific ways
  • 7.
    PARCC Exam: TheGOOD and the BAD • GOOD: There are problems which are not extreme and rather traditional • BAD: Problems are still 1 or 2 grade levels ahead of what used to be tested • BAD: Test results (RAW DATA) across the nation show that this test in math is not for the average tester • Ex: Only 8% of the students (on average) in the top state (Massachusetts) can get 65% of the test correct. • Other things of note: • We went from Grades 3-5 using calculators to them having no calculator usage on the full exam so FLUENCY is even more important • GOOD: New Textbook Series SHOULD help better prepare students • GOOD: New Testing Time Frame SHOULD provide more time for LEARNING prior to the assessment
  • 8.
    A Closer look…. •How have the standards and assessments changed through the years??? • PARCC (2014) vs NAEP (1990) • A SMALL sampling—to give perspective on the drastic changes over the years
  • 9.
  • 10.
    5th Grade PARCC Toget 1 point, a student must correctly answer B, C, and F otherwise no credit is given
  • 11.
    5th Grade PARCC Noticethe level of analysis required in these problems in comparison to what once was a HARD standard math question for Grade 8 (much less for Grade 5)
  • 12.
    NAEP Question (1990) 30%Correct Notice that they only have to plot a SINGLE point in the first quadrant of the coordinate plane
  • 13.
    5th Grade PARCC Toget 1 point all of the points must be correctly placed. If a single point is placed in the wrong spot, the entire problem is wrong.
  • 14.
    8th Grade PARCC Thisis a TYPE 1 problem for 8th grade. It’s considered an easy problem.
  • 15.
  • 16.
    6th Grade PARCC NOCalc CALC Allowed Again, notice the complexity of the numbers involved and the grade level. Also you can’t GUESS the correct choice.
  • 17.
  • 18.
    6th Grade PARCC Thisis a TYPE 3 problem for Grade 6 (modeling/application)
  • 19.
  • 20.
    7th Grade PARCC •Level of complexity is EXTREME • ACT wouldn’t even have something close to that • Must pick ALL correct choices to get 1 point
  • 21.
    7th Grade PARCC •Level of complexity is EXTREME
  • 22.
    This is justa SMALL sampling… • Note: These examples really don’t even begin to touch on the hardest types of problems students are required to be able to do in math. • PARCC doesn’t really even care about the most basic level of skill • Now, do you have a better idea of what we are up against in Math? • What are your thoughts??? • Back to “Strategies for Improving Math Outcomes” • Despite the level of difficulty, some teachers had very successful results on the math exam…we want to share what they said they do!
  • 23.
    What are the“Highest Performing” teachers doing in their classrooms??? • Surveyed the following teachers: • Dawn Peck & Andrea Vidrine(Grand Prairie 3rd Grade) • Billie Cortez(Palmetto 3rd & 4th Grade) • Tiffany Pedigo(Eunice Elementary 3rd & 4th Grade) • Lana Duvall(Krotz Springs 6th Grade) • Jamie Stelly(Leonville 7th & 8th Grade) • Amy Lanclos(formerly Southwest Grade 5 now at Grolee) • All were in the top two at their respective grade levels in scoring and most were “A” or “B” in their overall student scores in math.
  • 24.
    What are the“Highest Performing” teachers doing in their classrooms??? • Planning: • All follow curriculum outlines and teach CURRENT Common Core Standards • Lots of time spent on planning lessons PRIOR to teaching • Lots of time spent LEARNING and STUDYING the standards (particularly 1st year) • Weekly lessons are planned using BACKWARD DESIGN • It starts with looking at the standard being taught and the types of questions students need to be able to accomplish • All teachers utilized ALL resources provided by district (i.e., Problem Banks, PARCC Practice, supplementary materials, textbook resources, etc.)
  • 25.
    Classroom Instruction: (Jonel) InstructionalTime • Varies from 1 hour to 2 hours • Note: Most high performing districts spend 90 – 120 minutes on math at each grade • All teachers agree that extended time helps tremendously to truly reach the levels required by the common core math standards • 1 school offers 90 minutes to weaker group and 60 minutes to the stronger group • 1 school alternates the times they meet every six weeks • All teachers teach bell-to-bell and fight constantly to protect instructional time • Computer lab is done in ADDITION TO regular classroom instruction (with the exception of 1 teacher and that teacher would like lab to be in addition as it sets her back in curriculum—20% of time spent in lab going once per week).
  • 26.
    Classroom Instruction: What doesinstruction look like??? • All teachers have a BLEND of Direct Instruction & Pairing/Small Group work • Direct Instruction has “Lots of Questioning” and Teacher/Student Interaction • Group work has 2 or 3 people work together “each and every day” throughout lesson • Sense-making of the math being taught is a HUGE part of the classroom for both teacher and student • Connections made between what was learned before and also what will be learned later • Problems are solved using drawings and approaches are developed when problem solving • Students expected to explain orally or in writing their understanding of a concept via talking to partner or as whole class • Students must explain their work to one another, justify their work and approaches to solving problems, critiquing one another’s work, etc. • Group work is more than just students working on problem together • Elementary Grades (K-4) use manipulatives each time a new concept is introduced to develop concrete understanding of concepts • High Level of Expectations with Differentiated Problems for Highest and Lowest learners are part of every class • High Learners given toughest problems • Lower learners are pulled into small group with teacher to address shortcomings
  • 27.
    Classroom Instruction: What aboutHomework??? • Homework is given EVERY NIGHT (Monday – Thursday) to support learning which was done during instructional time • Average of 7 – 15 problems • Homework is checked the next day and gone over thoroughly as a class • All answers are reviewed but only particular problems that gave most students problems were THOROUGHLY gone over as a class LED BY THE TEACHER!!! • 1 teacher has students work together on previous night’s homework a small amount of time to open class before going over as a class
  • 28.
    Assessment: (Scott) Formative Assessments •All teachers utilize shorter quizzes to “check student understanding” of skills being taught • Some teachers require students to make corrections to any problems missed • All teachers utilized exit slips at least 2 or 3 times a week to monitor student understanding and to use this information when forming small groups • In some classes Dry erase boards are used for “quick checks” during instruction after students work in the book • If students don’t get problems right, teachers use this information to provide additional instruction/work in this skill.
  • 29.
    Assessment: CUMULATIVE Tests • ALLteachers believe this is a CRITICAL part of their success on end-of-year testing • Most teachers give 2 or 3 CUMULATIVE TESTS per six weeks • 2 teachers do as much as once per week • Tests consists of approximately ½ review of previously taught material and ½ on the newest material that has been taught • Once per six weeks, in a few teachers classes, students are required to make corrections on the problems they missed • Spiral Review is an ONGOING part of instruction and assessment in all classes • Fluency routines, practice, and assessment is a big part of the class • Cumulative tests are at a HIGH COGNITIVE DEMAND and include the three aspects of Rigor (conceptual understanding; computational skills; problem solving/application) • Grade distribution for all teachers was pretty consistent • Very few A’s, lots of C’s and D’s and in some cases as much as 1/3 of the students have F’s. • It was apparent that the level of expectation was very high in all classes for both instruction and assessment
  • 30.
    Assessment: CUMULATIVE Tests • ACTIVITY: •Take time to really look at the Sample Cumulative Tests provided by the teachers (15 minutes) • Be prepared to ask questions regarding things you notice or have questions about
  • 31.
    Test Prep: What didyou do to prepare your students? • ALL teachers utilized all of the resources provided by the district (which includes state assessment materials) • Test-Prep is not seen as a separate event, but an ONGOING part of the classroom INSTRUCTION & ASSESSMENT • There is no such thing as “STOP TEACHING AND JUST DO SAMPLE TESTS”
  • 32.
    Test Prep for2015-16 • All teachers have access to last year’s Sample PARCC • End-of-Chapter Problems sent to Grades 6-8 • PARCC-Like Items are PART of both Math Series (particularly Go-Math) • Recommendation: Should have been utilized after teaching content in lessons • UPCOMING: PARCC Released Test Items from last year’s exam are being printed (1 per student) to be handed out to teachers in January • Recommendation: Utilize these as teachers teach the curriculum • UPCOMING: State Sample Test for 2015-16 • Recommendation: Administer to students prior to Easter Break (March 21-23) • This leaves 3 weeks to work on things students are still having trouble with
  • 33.
    Latest Testing Information(Grades 3-5 Math) • Three Sessions (1 per day): Total Points = 62 • Session 1: 14 items (60 – 90 minutes) • Session 2: 14 items (60 – 90 minutes) • Session 3: 14 items (60 – 90 minutes) • Each session contains a balanced set of Type I, II, and III items • Major Content: 84% of Test • Type I—30 points or 48% of Test • Type II—10 points or 16% of Test • Type III—12 points or 19% of Test • Additional & Supporting Content: 16% of Test • Type I—10 points or 16% of Test
  • 34.
    Latest Testing Information(Grades 6-8 Math) • Three Sessions (1 per day): Total Points = 66 • Session 1: 18 items (60 – 90 minutes) TYPE 1 Problems Only (No Calculator) • Session 2: 13 items (60 – 90 minutes) Calculator Allowed • Session 3: 12 items (60 – 90 minutes) Calculator Allowed • Sessions 2 & 3 contains a balanced set of Type I, II, and III items • Major Content: 85% of Test • Type I—30 points or 45% of Test • Type II—14 points or 21% of Test • Type III—12 points or 18% of Test • Additional & Supporting Content: 15% of Test • Type I—10 points or 15% of Test
  • 35.
    Important PD Dateto Plan For… • Upcoming Math Inservice: • Resource Center on Monday, January 11, 2016 for math teachers • Grades 3 – 5 (½ day from 8:00 – 11:00) • Grades 6 – 8 (½ day from 12:00 – 3:00) • Subs will be paid for through Ms. Blanchard (if needed). • For those math teachers who may teach at both grade intervals (such as a teacher who teaches both Grades 5 & 6) they should plan to attend both sessions (all day). • Please make plans for your math teachers to attend the appropriate sessions on this date.
  • 36.
    Final Thoughts/Comments/Questions Special Thanksto the Teachers who shared their BEST PRACTICES and SAMPLE TESTS to help all schools!!