Lab report 7 networks
•Download as DOCX, PDF•
0 likes•68 views

This presentation focuses on networks such as pipelines in Arcgis of a particular area A geographic information system (GIS) is a system designed to capture, store, manipulate, analyze, manage, and present spatial or geographic data.

Recommended
Recommended
More Related Content
Similar to Lab report 7 networks
Similar to Lab report 7 networks (20)
More from Sharik Shamsudhien
More from Sharik Shamsudhien (15)
Recently uploaded
Recently uploaded (20)
Lab report 7 networks
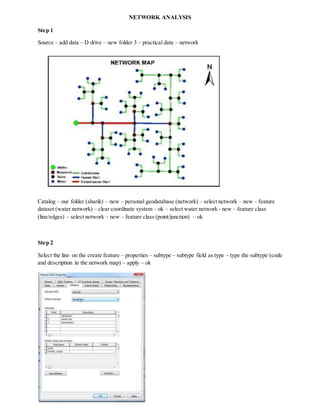
- 1. NETWORK ANALYSIS Step 1 Source – add data – D drive – new folder 3 – practical data – network Catalog – our folder (sharik) – new – personal geodatabase (network) – select network – new – feature dataset (water network) – clear coordinate system – ok – select water network - new – feature class (line/edges) – select network – new – feature class (point/junction) – ok Step 2 Select the line on the create feature – properties – subtype – subtype field as type – type the subtype (code and description in the network map) – apply – ok
- 2. Step 3 Select the point on the create feature – properties – subtype – subtype field as type – type the subtype (code and description) – apply – ok Step 4 Drag the water network in the catalog to the table contents
- 3. Step 5 Double click – symbol selector (select ESRI and color) – ok Change all the points and lines using symbol selector
- 4. Steps for digitalize Editor – start editing Select the intake in the create feature and click the corresponding point in the network map. All the lines and points were digitalize in the network map, Steps for run Catalog – water network (dataset) – new – geometric network – snap feature as no - give source – yes – point – give lines – complete edges. We get the catalog
- 5. Steps for flow Editor – start editing – Point - open attribute table – double click the ancillary role of intake ( source is taken as intake) – source Utility network analysis – flow – display arrows Output
- 6.