Lab report 10 hydrology
•Download as DOCX, PDF•
0 likes•135 views

This presentation report focuses on the creation of hydrology of an area A geographic information system (GIS) is a system designed to capture, store, manipulate, analyze, manage, and present spatial or geographic data.

Recommended
Recommended
More Related Content
Similar to Lab report 10 hydrology
Similar to Lab report 10 hydrology (20)
More from Sharik Shamsudhien
More from Sharik Shamsudhien (15)
Recently uploaded
Recently uploaded (20)
Lab report 10 hydrology
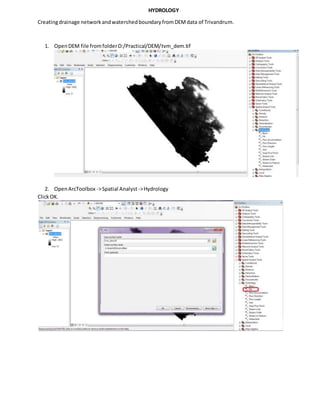
- 1. HYDROLOGY Creatingdrainage networkandwatershedboundaryfromDEMdata of Trivandrum. 1. OpenDEM file fromfolderD:/Practical/DEM/tvm_dem.tif 2. OpenArcToolbox ->Spatial Analyst->Hydrology ClickOK.
- 2. Select‘Flow Direction’fromHydrology.Giveinputas‘filled’andoutputas‘flow_dir’.ClickOK. 3. Select‘FlowAccumulation’fromHydrology.Give inputas‘flow_dir’andsetoutputas‘flow_acccu’. ClickOK
- 3. 4. To ensure thatyour map can show the firstorderstreamswithoutbeingtoocluttered,setthe flow accumulationtovalue asclose to that fromtoposheetaspossible. Here: Go to ‘Map Algebra’inSpatial Analysttoolsetandgive “Flow_acccu”> 500 (without spaces) Setoutputas flow_accu1
- 4. 5. Open‘Streamorder’tool from‘Hydrology’toolset. Give inputfile as‘Flow_Accu1’,inputflow directionas‘Flow_dir’and Setoutputfile as‘stream_order’. ClickOK.Nowwe get streamorderas a rasterfile 6. To convertthe ‘stream_order’ rasterto vectorfile: Open‘Streamto feature’,
- 5. Give inputas stream_order,inputflow directionas‘flow_dir’and Setoutputas ‘stream_order_v’. ClickOK. 7. To see the attribute fields,rightclickonthe vectorfile layerinTable of Contentspanel andselect ‘OpenAttribute table’.The Gridcode representsthe streamorder.Youcan categorize the map accordingto streamorder bygoingto Properties ->SymbologyandcategorizingbyGridCode.
- 6. 8. To generate the watershedbasin,Open‘Basin’tool fromHydrologytoolsetandgive inputas ‘flow_dir’.ClickOK.