
Recommended
Recommended
More Related Content
Similar to MICROSOFT CORPORATIONFinancialStatementFY20Q1BALANCE SHEETS.docx
Similar to MICROSOFT CORPORATIONFinancialStatementFY20Q1BALANCE SHEETS.docx (20)
More from roushhsiu
More from roushhsiu (20)
Recently uploaded
Recently uploaded (20)
MICROSOFT CORPORATIONFinancialStatementFY20Q1BALANCE SHEETS.docx
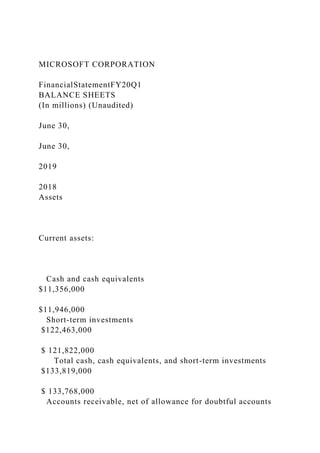
- 1. MICROSOFT CORPORATION FinancialStatementFY20Q1 BALANCE SHEETS (In millions) (Unaudited) June 30, June 30, 2019 2018 Assets Current assets: Cash and cash equivalents $11,356,000 $11,946,000 Short-term investments $122,463,000 $ 121,822,000 Total cash, cash equivalents, and short-term investments $133,819,000 $ 133,768,000 Accounts receivable, net of allowance for doubtful accounts
- 2. of $411 and $377 $ 29,524,000 $ 26,481,000 Inventories $ 2,063,000 $ 2,662,000 Other current assets $ 10,146,000 $ 6,751,000 Total current assets $175,552,000 $ 169,662,000 Long-term assets: Property and equipment, net of accumulated depreciation of $35,330 and $29,223 $ 36,477,000 $ 29,460,000 Operating lease right-of-use assets $ 7,379,000 $ 6,686,000 Equity investments $ 2,649,000
- 3. $ 1,862,000 Goodwill $ 42,026,000 $ 35,683,000 Intangible assets, net $ 7,750,000 $ 8,053,000 Other long-term assets $ 14,723,000 $ 7,442,000 Deferred asset charges $ - $ - Total assets $286,556,000 $258,848,000 Liabilities and stockholders' equity Current liabilities: Accounts payable $9,382,000 $8,617,000 Short-term Debt/Current portion of long-term debt
- 4. $ 5,516,000 $ 3,998,000 Accrued compensation $ 6,830,000 $ 6,103,000 Short-term income taxes $ 5,665,000 $ 2,121,000 Short-term unearned revenue $ 32,676,000 $ 28,905,000 Other current liabilities $ 9,351,000 $ 8,744,000 Total current liabilities $ 69,420,000 $ 58,488,000 Long-term debt $ 66,662,000 $ 72,242,000 Long-term income taxes $ 29,612,000 $ 30,265,000 Long-term unearned revenue $ 4,530,000 $ 3,815,000 Deferred income taxes
- 5. $ 233,000 $ 541,000 Operating lease liabilities $ 6,188,000 $ 5,568,000 Other long-term liabilities $ 7,581,000 $ 5,211,000 Misc. Stocks $ - $ - Minority interest $ - $ - Total liabilities $184,226,000 $176,130,000 Stockholders' equity: Common stock and paid-in capital - shares authorized 24,000; outstanding 7,643 and 7,677 $ 78,520,000 $ 71,223,000 Retained earnings $ 24,150,000
- 6. $ 13,682,000 Accumulated other comprehensive loss/Other equity $ (340,000) $ (2,187,000) Total stockholders' equity $102,330,000 $ 82,718,000 Total liabilities and stockholders' equity $286,556,000 $258,848,000 MICROSOFT CORPORATION INCOME STATEMENTS (In millions, except per share amounts) (Unaudited) Twelve Months Ended June 30, 2019
- 7. 2018 Sales: Product $66,069,000 $64,497,000 Service and other $ 59,774,000 $ 45,863,000 Net sales $125,843,000 $110,360,000 Cost of goods sold: Product $ 16,273,000 $ 15,420,000 Service and other $ 26,637,000 $ 22,933,000 Total cost of goods sold $ 42,910,000 $ 38,353,000 Gross profit $ 82,933,000 $ 72,007,000
- 8. Research and development $ 16,876,000 $ 14,726,000 Sales and marketing $ 18,213,000 $ 17,469,000 General and administrative $ 4,885,000 $ 4,754,000 Total operating expenses $ 42,959,000 $ 35,058,000 less: Interest expense $ 2,686,000 $ 2,733,000 Other income, net $ 3,415,000 $ 4,149,000 Earnings before income and taxes $ 43,688,000 $ 36,474,000 less: Provision for income taxes $ 4,448,000 $ 19,903,000 Net income $ 39,240,000 $ 16,571,000
- 9. Net income available to common shareholders $ 39,240,000 $16,571,000 Earnings per share: Basic $5.11 $2.15 Diluted $5.06 $2.13 Weighted average shares outstanding: Basic $ 7,673,000 $ 7,700,000 Diluted $ 7,753,000 $ 7,794,000 MICROSOFT CORPORATION CASH FLOWS STATEMENTS
- 10. (In millions) (Unaudited) Twelve Months Ended June 30, 2019 Operating Activities Net income $39,240,000 Non-cash adjustments Depreciation, amortization, and other $ 11,682,000 Stock-based compensation expense $ 4,652,000 Net recognized gains on investments and derivatives $ (792,000) Deferred income taxes $ (6,463,000) Changes in working capital Accounts receivable $ (2,812,000) Inventories $ 597,000 Other current assets $ (1,718,000) Other long-term assets $ (1,834,000) Accounts payable $ 232,000 Unearned revenue
- 11. $ 4,462,000 Income taxes $ 2,929,000 Other current liabilities $ 1,419,000 Other long-term liabilities $ 591,000 Net cash from operations $ 52,185,000 Financing Activities Repayments of short-term debt, maturities of 90 days or less, net $ - Proceeds from issuance of debt $ - Repayments of debt $ (4,000,000) Common stock issued $ 1,142,000 Common stock repurchased $ (19,543,000) Common stock cash dividends paid $ (13,811,000) Other, net $ (675,000) Net cash used in financing $ (36,887,000) Investing Activities Additions to property and equipment $ (13,925,000) Acquisition of companies, net of cash acquired, and purchases of intangible and other assets $ (2,388,000) Purchases of investments
- 12. $ (57,697,000) Maturities of investments $ 20,043,000 Sales of investments $ 38,194,000 Securities lending payable $ - Net cash used in investing $ (15,773,000) Effect of foreign exchange rates on cash and cash equivalents $ (115,000) Net change in cash and cash equivalents $ (590,000) Cash and cash equivalents, beginning of period $ 11,946,000 Cash and cash equivalents, end of period $11,356,000 Based on the company you selected in Part I, complete the following: 1. Based on formulas in your textbook, compute the following ratios for two years. You may use Excel to compute your ratios. 1. Debt ratio (for the year 2019) = Total Liabilities / Total Assets = $286,556,000 / $286,556,000 = 1
- 13. Debt Ratio (for the year 2018) = Total Liabilities / Total Assets = $258,848,000 / $258,848,000 = 1 2. Gross profit margin (for the year 2019) = [Net Sales – Cost of Goods Sold (COGS)]/Net Sales = [$125,843,000 – $42,910,000] / $125,843,000 = 0.66 = 66% Gross profit margin (for the year 2018) = [Net Sales – Cost of Goods Sold (COGS)]/Net Sales = [$110,360,000 – $38,353,000] / $110,360,000 = 0.65 = 65% 3. Free cash flow (for the year 2019) = Net Cash flow from Operations – Capital Expenditures = $52,185,000 – $13,925,000 = $38,260,000 4. Times interest earned (for the year 2019) = Earnings before Interest & Taxes (EBIT) / Interest Expense = $43,688,000 / $2,686,000 = 16.27 times the annual interest expense Times interest earned (for the year 2018) = Earnings before Interest & Taxes (EBIT) / Interest Expense = $36,474,000 / $2,733,000 = 13.35 times the annual interest expense 5. Accounts receivable turnover (for the year 2019) = Net Credit Sales / Accounts Receivables = $125,843,000 / $29,524,000 = 4.26 times Accounts receivable turnover (for the year 2018) = Net Credit Sales / Accounts Receivables = $110,360,000 / $26,481,000 = 4.17 times 6. Inventory turnover (for the year 2019) = Cost of Goods Sold (COGS) / Inventory = $42,910,000/ 2,063,000
- 14. = 20.8 Inventory turnover (for the year 2018) = Cost of Goods Sold (COS) / Inventory = $38,353,000 / $2,662,000 = 14.41 2. Prepare a DuPont Analysis of ROE for two years, including computations of 1. Return on Sales 2. Asset Turnover 3. Return on Assets 4. Financial Leverage 5. Return on Equity 1. Return on sales (for the year 2019) = Operating Profit before Tax / Net Sales = $42,959,000 / $125,843,000 = 0.34136 = 34.14% Return on sales (for the year 2018) = Operating Profit before Tax / Net Sales = $35,058,00 / $110,360,000 = 0.31766 = 32% 2. Asset turnover (for the year 2019) = Net Sales / Total Assets = $125,843,000 / $286,556,000 = 0.44 times Asset turnover (for the year 2018) = Net Sales / Total Assets = $110,360,000 / $169,662,000 = 0.65 times 3. Return on assets (for the year 2019) = Net Profit Margin X Total Asset Turnover = 31.18% / 0.44 = 13.69% Calculation: Net Profit Margin = Earnings Available for Common Stockholders / Net Sales
- 15. = $39,240,000 / $125,843,000 = 0.3118 = 31.18% Return on asset (for the year 2018) = Net Profit Margin X Total Asset Turnover = 15.02% / 0.65 = 0.0977 = 10% Calculation: Net Profit Margin = Earnings Available for Common Stockholders / Net Sales = $16,571,000 / $110,360,000 = 15.02% 4. Financial leverage (for the year 2019) = Total Assets / Common Stock Equity = $286,556,000 / $102,330,000 = 2.8 Financial leverage (for the year 2018) = Total Assets / Common Stock Equity = $258,848,000 / $82,718,000 = 3.13 5. Return on equity (for the year 2019) = Return on assets / Financial leverage = 13.69% / 2.8 = 38.35% Return on equity (for the year 2018) = Return on assets / Financial leverage = 10% / 3.13 = 30.56%