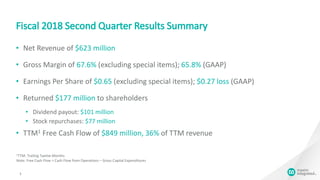
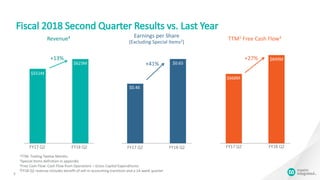
Fiscal 2018 Second Quarter Results
January 25, 2018
Safe Harbor
2
This presentation contains forward-looking statements within the meaning of Section 27A of the
Securities Act of 1933, as amended, and Section 21E of the Securities Exchange Act of 1934, as amended.
These forward-looking statements include, without limitation, the Company’s projections and statements
regarding revenue, gross margin, earnings per share, capital expenditures and other financial and business
metrics. These statements involve risks and uncertainties that could cause actual results to differ
materially from expectations. Please refer to the Company’s Annual Report on Form 10-K for the fiscal
year ended June 24, 2017 for a description of some of the risk factors that could cause actual results to
differ materially from such forward-looking statements.
All forward-looking statements included in this presentation are made as of the date hereof and based on
the information available to the Company as of the date hereof. The Company assumes no obligation to
update any forward-looking statement.
Fiscal 2018 Second Quarter Results Summary
• Net Revenue of $623 million
• Gross Margin of 67.6% (excluding special items); 65.8% (GAAP)
• Earnings Per Share of $0.65 (excluding special items); $0.27 loss (GAAP)
• Returned $177 million to shareholders
• Dividend payout: $101 million
• Stock repurchases: $77 million
• TTM1 Free Cash Flow of $849 million, 36% of TTM revenue
3
1TTM: Trailing Twelve Months
Note: Free Cash Flow = Cash Flow from Operations – Gross Capital Expenditures
Results and Guidance
4
$668M
$849M
Fiscal 2018 Second Quarter Results vs. Last Year
5
$551M
$623M
+13%
FY17 Q2 FY18 Q2
Revenue4 Earnings per Share
(Excluding Special Items2)
TTM1 Free Cash Flow3
1TTM: Trailing Twelve Months
2Special Items definition in appendix
3Free Cash Flow: Cash Flow from Operations – Gross Capital Expenditures
4FY18 Q2 revenue includes benefit of sell-in accounting transition and a 14-week quarter
FY17 Q2 FY18 Q2
+27%
$0.46
$0.65+41%
FY17 Q2 FY18 Q2
Automotive Industrial Comms &
Data Center
Consumer Computing
FY17 Q2 and FY18 Q2 Revenue*
Fiscal 2018 Second Quarter Results by End Market
6
21%
29%
20%
26%
4%
FY18 Q2 Revenue: $623M
Consumer
Automotive
Industrial
Communications & Data Center
Computing
Note: Due to nature of our general purpose products, estimates by Major Markets are imprecise
*FY18 Q2 revenue includes benefit of sell-in accounting transition and a 14-week quarter
+25%
+29%
+13%
-5%
+7%
Fiscal 2018 Third Quarter Guidance
Guidance
Revenue $620M – $660M
Gross Margin
66% – 68% GAAP excl. Special Items2
(64% – 66% GAAP)
Earnings Per
Share
$0.66 – $0.72 GAAP excl. Special Items2
($0.63 – $0.69 GAAP)
Gross Capital
Expenditures
Target range
of 1 – 3% of revenue
7
2Special Items definition in Appendix
3Excludes impact of FY18 Q2 revenue for transition to sell-in accounting and 14-week quarter
Note: Maxim Integrated’s business outlook does not include the potential impact of any restructuring activity, acquisitions, or other business
combinations that may be completed during the quarter.
FY18 Q3 End Market Guidance vs. FY18 Q23
â–Ş Automotive: Up
â–Ş Industrial: Strongly Up
â–Ş Comms & Data Center: Up
â–Ş Consumer: Strongly Up
â–Ş Computing: Strongly Down
Key Metrics
8
0%
10%
20%
30%
40%
0
250
500
750
1,000
FY13
Q2
FY14
Q2
FY15
Q2
FY16
Q2
FY17
Q2
FY18
Q2
TTM1 Free Cash Flow
9
1TTM: Trailing Twelve Months
Note: Free Cash Flow: Cash from Operations – Gross Capital Expenditures
$M As % of Revenue
36%
Gross CapEx
Target:
1 to 3%
of Revenue
0%
2%
4%
6%
8%
10%
12%
14%
16%
FY13
Q2
FY14
Q2
FY15
Q2
FY16
Q2
FY17
Q2
FY 18
Q2
Accelerated Depreciation
Depreciation
Gross Capital Expenditures
Capital Expenditures vs. Depreciation
10
% of Revenue
$0.18
$0.22
$0.26
$0.30
$0.34
$0.38
$0.42
FY12 Q3 FY14 Q3 FY16 Q3 FY18 Q3
Quarterly Cash Dividend Per Share
11
$0
$50
$100
$150
$200
$250
FY12 Q2 FY14 Q2 FY16 Q2 FY18Q2
Dividends & Share Repurchases
Dividend
Return of Cash to Shareholders
Buyback
+9%
+8%
+8%
Share repurchase increasing in FY18 Q3 to enable
100% of FCF returned to shareholders
+9%
+7%
+10%
Quarterly dividend increased to $0.42
per share in FY18 Q3
[$M] +17%
13
Appendix
2Special Items: intangible asset amortization; accelerated depreciation; acquisition-related inventory write-up; impairment of long-lived assets;
impairment of goodwill and intangible assets; severance and restructuring; acquisition-related costs; contingent consideration adjustments
relating to certain acquisitions; expected loss on rent expense for vacated office space; loss related to sale of land and buildings; impairment of
investments in privately-held companies; tax provision impacts due to fixed asset tax basis adjustment relating to prior year depreciation
expense.
Reconciliation of GAAP vs. GAAP Excluding Special Items (Unaudited)
14
December 30, September 23, December 24,
2017 2017 2016
Reconciliation of GAAP gross profit to GAAP gross profit excluding special items:
GAAP gross profit 409,676$ 373,831$ 340,178$
GAAP gross profit % 65.8% 64.9% 61.7%
Special items:
Intangible asset amortization 11,139 11,064 11,755
Accelerated depreciation (1) — — 1,178
Total special items 11,139 11,064 12,933
GAAP gross profit excluding special items 420,815$ 384,895$ 353,111$
GAAP gross profit % excluding special items 67.6% 66.9% 64.1%
Reconciliation of GAAP operating expenses to GAAP operating expenses excluding
special items:
GAAP operating expenses 208,628$ 188,665$ 191,104$
Special items:
Intangible asset amortization 995 1,752 2,348
Impairment of long-lived assets (2) 850 42 383
Severance and restructuring 6,523 5,433 864
Other operating expenses (income), net (959) (844) 1,909
Total special items 7,409 6,383 5,504
GAAP operating expenses excluding special items 201,219$ 182,282$ 185,600$
Reconciliation of GAAP net income (loss) to GAAP net income excluding special
items:
GAAP net income (loss) (75,015)$ 154,533$ 130,477$
Special items:
Intangible asset amortization 12,134 12,816 14,103
Accelerated depreciation (1) — — 1,178
Impairment of long-lived assets (2) 850 42 383
Severance and restructuring 6,523 5,433 864
Other operating expenses (income), net (959) (844) 1,909
Interest and other expense (income), net (119) (84) (5,052)
Pre-taxtotal special items 18,429 17,363 13,385
Other income taxeffects and adjustments (3) (897) (1,345) (11,167)
Impact of taxreform 243,550 — —
GAAP net income excluding special items 186,067$ 170,551$ 132,695$
GAAP net income per share excluding special items:
Basic 0.66$ 0.60$ 0.47$
Diluted 0.65$ 0.60$ 0.46$
Shares used in the calculation of earnings per share excluding special items:
Basic 281,560 282,170 283,294
Diluted (4) 286,356 286,437 288,106
(in thousands, except per share data)
Three Months Ended
GAAP gross profit excluding special items 420,815$ 384,895$ 353,111$
GAAP gross profit % excluding special items 67.6% 66.9% 64.1%
Reconciliation of GAAP operating expenses to GAAP operating expenses excluding
special items:
GAAP operating expenses 208,628$ 188,665$ 191,104$
Special items:
Intangible asset amortization 995 1,752 2,348
Impairment of long-lived assets (2) 850 42 383
Severance and restructuring 6,523 5,433 864
Other operating expenses (income), net (959) (844) 1,909
Total special items 7,409 6,383 5,504
GAAP operating expenses excluding special items 201,219$ 182,282$ 185,600$
Reconciliation of GAAP net income (loss) to GAAP net income excluding special
items:
GAAP net income (loss) (75,015)$ 154,533$ 130,477$
Special items:
Intangible asset amortization 12,134 12,816 14,103
Accelerated depreciation (1) — — 1,178
Impairment of long-lived assets (2) 850 42 383
Severance and restructuring 6,523 5,433 864
Other operating expenses (income), net (959) (844) 1,909
Interest and other expense (income), net (119) (84) (5,052)
Pre-taxtotal special items 18,429 17,363 13,385
Other income taxeffects and adjustments (3) (897) (1,345) (11,167)
Impact of taxreform 243,550 — —
GAAP net income excluding special items 186,067$ 170,551$ 132,695$
GAAP net income per share excluding special items:
Basic 0.66$ 0.60$ 0.47$
Diluted 0.65$ 0.60$ 0.46$
Shares used in the calculation of earnings per share excluding special items:
Basic 281,560 282,170 283,294
Diluted (4) 286,356 286,437 288,106
(1) Includes building and equipment accelerated depreciation related to the Dallas manufacturing facility during the second quarter of fiscal year 2017.
(2) Includes impairment of investments in privately-held companies and other equipment impairment charges.
(3) Includes taxeffect of pre-taxspecial items and miscellaneous taxadjustments.
(4) Shares used in diluted earnings per share excluding special items differs fromGAAP loss per share due to net income on a non-GAAP basis.

Q218 earnings presentation final

  • 1.
    Fiscal 2018 SecondQuarter Results January 25, 2018
  • 2.
    Safe Harbor 2 This presentationcontains forward-looking statements within the meaning of Section 27A of the Securities Act of 1933, as amended, and Section 21E of the Securities Exchange Act of 1934, as amended. These forward-looking statements include, without limitation, the Company’s projections and statements regarding revenue, gross margin, earnings per share, capital expenditures and other financial and business metrics. These statements involve risks and uncertainties that could cause actual results to differ materially from expectations. Please refer to the Company’s Annual Report on Form 10-K for the fiscal year ended June 24, 2017 for a description of some of the risk factors that could cause actual results to differ materially from such forward-looking statements. All forward-looking statements included in this presentation are made as of the date hereof and based on the information available to the Company as of the date hereof. The Company assumes no obligation to update any forward-looking statement.
  • 3.
    Fiscal 2018 SecondQuarter Results Summary • Net Revenue of $623 million • Gross Margin of 67.6% (excluding special items); 65.8% (GAAP) • Earnings Per Share of $0.65 (excluding special items); $0.27 loss (GAAP) • Returned $177 million to shareholders • Dividend payout: $101 million • Stock repurchases: $77 million • TTM1 Free Cash Flow of $849 million, 36% of TTM revenue 3 1TTM: Trailing Twelve Months Note: Free Cash Flow = Cash Flow from Operations – Gross Capital Expenditures
  • 4.
  • 5.
    $668M $849M Fiscal 2018 SecondQuarter Results vs. Last Year 5 $551M $623M +13% FY17 Q2 FY18 Q2 Revenue4 Earnings per Share (Excluding Special Items2) TTM1 Free Cash Flow3 1TTM: Trailing Twelve Months 2Special Items definition in appendix 3Free Cash Flow: Cash Flow from Operations – Gross Capital Expenditures 4FY18 Q2 revenue includes benefit of sell-in accounting transition and a 14-week quarter FY17 Q2 FY18 Q2 +27% $0.46 $0.65+41% FY17 Q2 FY18 Q2
  • 6.
    Automotive Industrial Comms& Data Center Consumer Computing FY17 Q2 and FY18 Q2 Revenue* Fiscal 2018 Second Quarter Results by End Market 6 21% 29% 20% 26% 4% FY18 Q2 Revenue: $623M Consumer Automotive Industrial Communications & Data Center Computing Note: Due to nature of our general purpose products, estimates by Major Markets are imprecise *FY18 Q2 revenue includes benefit of sell-in accounting transition and a 14-week quarter +25% +29% +13% -5% +7%
  • 7.
    Fiscal 2018 ThirdQuarter Guidance Guidance Revenue $620M – $660M Gross Margin 66% – 68% GAAP excl. Special Items2 (64% – 66% GAAP) Earnings Per Share $0.66 – $0.72 GAAP excl. Special Items2 ($0.63 – $0.69 GAAP) Gross Capital Expenditures Target range of 1 – 3% of revenue 7 2Special Items definition in Appendix 3Excludes impact of FY18 Q2 revenue for transition to sell-in accounting and 14-week quarter Note: Maxim Integrated’s business outlook does not include the potential impact of any restructuring activity, acquisitions, or other business combinations that may be completed during the quarter. FY18 Q3 End Market Guidance vs. FY18 Q23 ▪ Automotive: Up ▪ Industrial: Strongly Up ▪ Comms & Data Center: Up ▪ Consumer: Strongly Up ▪ Computing: Strongly Down
  • 8.
  • 9.
    0% 10% 20% 30% 40% 0 250 500 750 1,000 FY13 Q2 FY14 Q2 FY15 Q2 FY16 Q2 FY17 Q2 FY18 Q2 TTM1 Free CashFlow 9 1TTM: Trailing Twelve Months Note: Free Cash Flow: Cash from Operations – Gross Capital Expenditures $M As % of Revenue 36%
  • 10.
    Gross CapEx Target: 1 to3% of Revenue 0% 2% 4% 6% 8% 10% 12% 14% 16% FY13 Q2 FY14 Q2 FY15 Q2 FY16 Q2 FY17 Q2 FY 18 Q2 Accelerated Depreciation Depreciation Gross Capital Expenditures Capital Expenditures vs. Depreciation 10 % of Revenue
  • 11.
    $0.18 $0.22 $0.26 $0.30 $0.34 $0.38 $0.42 FY12 Q3 FY14Q3 FY16 Q3 FY18 Q3 Quarterly Cash Dividend Per Share 11 $0 $50 $100 $150 $200 $250 FY12 Q2 FY14 Q2 FY16 Q2 FY18Q2 Dividends & Share Repurchases Dividend Return of Cash to Shareholders Buyback +9% +8% +8% Share repurchase increasing in FY18 Q3 to enable 100% of FCF returned to shareholders +9% +7% +10% Quarterly dividend increased to $0.42 per share in FY18 Q3 [$M] +17%
  • 13.
    13 Appendix 2Special Items: intangibleasset amortization; accelerated depreciation; acquisition-related inventory write-up; impairment of long-lived assets; impairment of goodwill and intangible assets; severance and restructuring; acquisition-related costs; contingent consideration adjustments relating to certain acquisitions; expected loss on rent expense for vacated office space; loss related to sale of land and buildings; impairment of investments in privately-held companies; tax provision impacts due to fixed asset tax basis adjustment relating to prior year depreciation expense.
  • 14.
    Reconciliation of GAAPvs. GAAP Excluding Special Items (Unaudited) 14 December 30, September 23, December 24, 2017 2017 2016 Reconciliation of GAAP gross profit to GAAP gross profit excluding special items: GAAP gross profit 409,676$ 373,831$ 340,178$ GAAP gross profit % 65.8% 64.9% 61.7% Special items: Intangible asset amortization 11,139 11,064 11,755 Accelerated depreciation (1) — — 1,178 Total special items 11,139 11,064 12,933 GAAP gross profit excluding special items 420,815$ 384,895$ 353,111$ GAAP gross profit % excluding special items 67.6% 66.9% 64.1% Reconciliation of GAAP operating expenses to GAAP operating expenses excluding special items: GAAP operating expenses 208,628$ 188,665$ 191,104$ Special items: Intangible asset amortization 995 1,752 2,348 Impairment of long-lived assets (2) 850 42 383 Severance and restructuring 6,523 5,433 864 Other operating expenses (income), net (959) (844) 1,909 Total special items 7,409 6,383 5,504 GAAP operating expenses excluding special items 201,219$ 182,282$ 185,600$ Reconciliation of GAAP net income (loss) to GAAP net income excluding special items: GAAP net income (loss) (75,015)$ 154,533$ 130,477$ Special items: Intangible asset amortization 12,134 12,816 14,103 Accelerated depreciation (1) — — 1,178 Impairment of long-lived assets (2) 850 42 383 Severance and restructuring 6,523 5,433 864 Other operating expenses (income), net (959) (844) 1,909 Interest and other expense (income), net (119) (84) (5,052) Pre-taxtotal special items 18,429 17,363 13,385 Other income taxeffects and adjustments (3) (897) (1,345) (11,167) Impact of taxreform 243,550 — — GAAP net income excluding special items 186,067$ 170,551$ 132,695$ GAAP net income per share excluding special items: Basic 0.66$ 0.60$ 0.47$ Diluted 0.65$ 0.60$ 0.46$ Shares used in the calculation of earnings per share excluding special items: Basic 281,560 282,170 283,294 Diluted (4) 286,356 286,437 288,106 (in thousands, except per share data) Three Months Ended GAAP gross profit excluding special items 420,815$ 384,895$ 353,111$ GAAP gross profit % excluding special items 67.6% 66.9% 64.1% Reconciliation of GAAP operating expenses to GAAP operating expenses excluding special items: GAAP operating expenses 208,628$ 188,665$ 191,104$ Special items: Intangible asset amortization 995 1,752 2,348 Impairment of long-lived assets (2) 850 42 383 Severance and restructuring 6,523 5,433 864 Other operating expenses (income), net (959) (844) 1,909 Total special items 7,409 6,383 5,504 GAAP operating expenses excluding special items 201,219$ 182,282$ 185,600$ Reconciliation of GAAP net income (loss) to GAAP net income excluding special items: GAAP net income (loss) (75,015)$ 154,533$ 130,477$ Special items: Intangible asset amortization 12,134 12,816 14,103 Accelerated depreciation (1) — — 1,178 Impairment of long-lived assets (2) 850 42 383 Severance and restructuring 6,523 5,433 864 Other operating expenses (income), net (959) (844) 1,909 Interest and other expense (income), net (119) (84) (5,052) Pre-taxtotal special items 18,429 17,363 13,385 Other income taxeffects and adjustments (3) (897) (1,345) (11,167) Impact of taxreform 243,550 — — GAAP net income excluding special items 186,067$ 170,551$ 132,695$ GAAP net income per share excluding special items: Basic 0.66$ 0.60$ 0.47$ Diluted 0.65$ 0.60$ 0.46$ Shares used in the calculation of earnings per share excluding special items: Basic 281,560 282,170 283,294 Diluted (4) 286,356 286,437 288,106 (1) Includes building and equipment accelerated depreciation related to the Dallas manufacturing facility during the second quarter of fiscal year 2017. (2) Includes impairment of investments in privately-held companies and other equipment impairment charges. (3) Includes taxeffect of pre-taxspecial items and miscellaneous taxadjustments. (4) Shares used in diluted earnings per share excluding special items differs fromGAAP loss per share due to net income on a non-GAAP basis.