Download to read offline

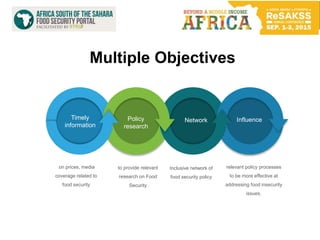
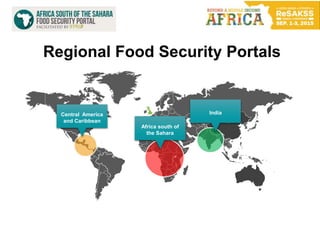
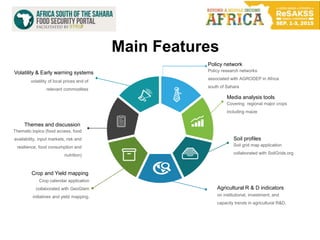
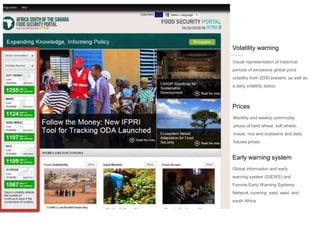
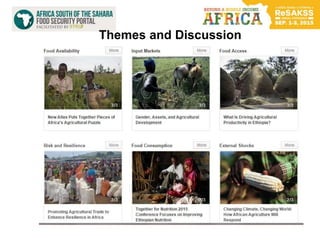
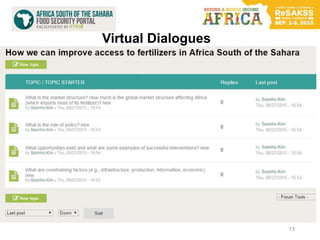
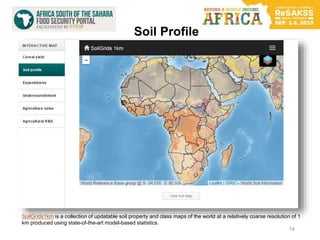
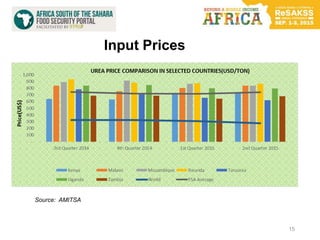
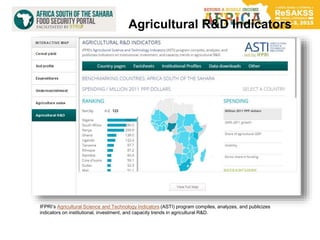
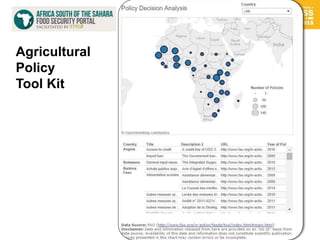
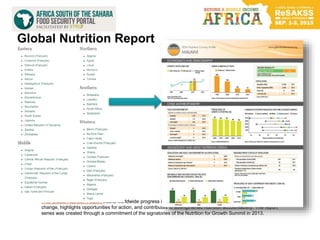
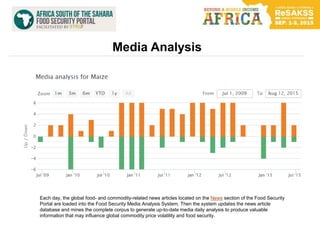
The document summarizes features of the Africa South of the Sahara Food Security Portal, including its policy research networks, media analysis tools, soil profiles, agricultural R&D indicators, themes and discussions, prices and early warning systems for food security monitoring in the region. The portal aims to provide timely policy-relevant research and influence food security policy processes through an inclusive network.