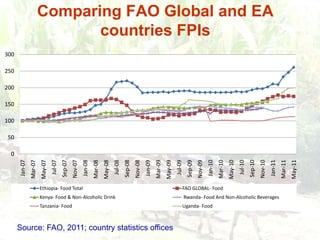
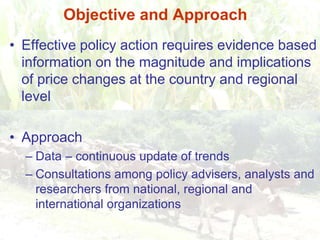
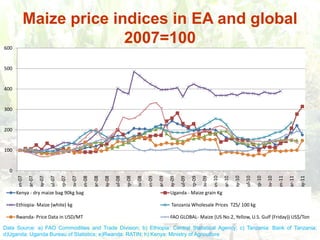
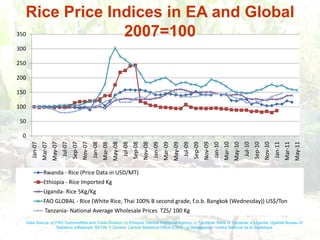
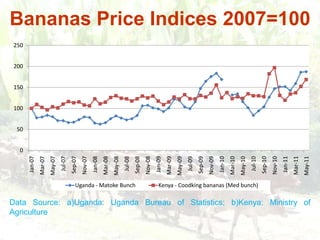
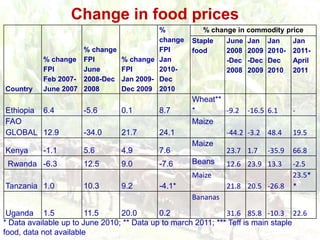
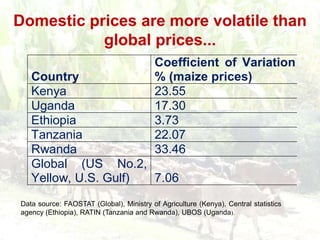
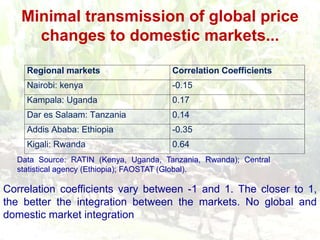
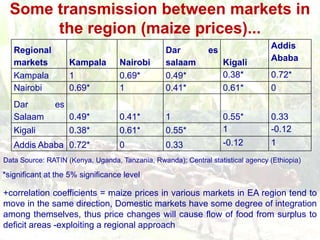
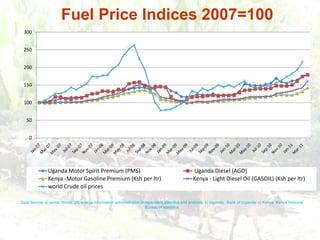
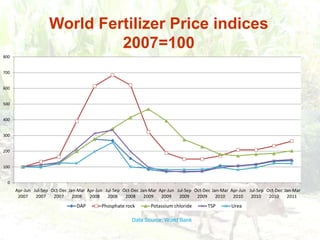
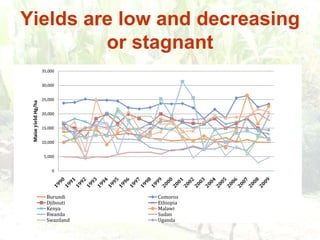
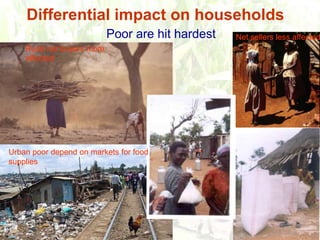
Persistence of high food prices in Eastern Africa: What role for policy?By Joseph Karugia, CoordinatorReSAKSS-ECA
OutlineIntroductionFood Price Situation in ESARegional Dimensions Recommended Policy Options
Introduction (1)Global food price index (FPI) embarked on a downward spiral by July 2008 and remained low and stable for some timeDomestic FPI in Eastern Africa (EA) region on the other hand continued to increase after food crisis, notably in Kenya, Tanzania, Uganda, Ethiopia and DjiboutiIn the first half of 2010, global and domestic food prices eased but remained higher than their historical trends
Introduction (2)The decline did not present any immediate relief to the food crises – largely influenced by good weather conditionsBoth global and domestic food prices have risen to historic highs beginning January 2011Significant challenge to reduction of poverty and hunger
Comparing FAO Global and EA countries FPIsSource: FAO, 2011; country statistics offices
Objective and ApproachEffective policy action requires evidence based information on the magnitude and implications of price changes at the country and regional level ApproachData – continuous update of trendsConsultations among policy advisers, analysts and researchers from national, regional and international organizations
Maize price indices in EA and global 2007=100Data Source: a) FAO Commodities and Trade Division; b) Ethiopia: Central Statistical Agency; c) Tanzania: Bank of Tanzania; d)Uganda: Uganda Bureau of Statistics; e)Rwanda: RATIN; h) Kenya: Ministry of Agriculture
Rice Price Indices in EA and Global 2007=100 Data Source: a) FAO Commodities and Trade Division; b) Ethiopia: Central Statistical Agency; c) Tanzania: Bank of Tanzania; d)Uganda: Uganda Bureau of Statistics; e)Rwanda: RATIN; f) Zambia: Central Statistical Office (CSO) ; g) Madagascar: Institut National de la Statistique
Wheat Price Indices 2007=100Data Source: a) FAO Commodities and Trade Division; b) Ethiopia: Central Statistical Agency; c) Zambia: Central Statistical Office; d) Kenya: Ministry of Agriculture
Bean Price Indices 2007 = 100Data Source: a) FAO Commodities and Trade Division; b) Ethiopia: Central Statistical Agency; c) Tanzania: Bank of Tanzania; d)Uganda: Uganda Bureau of Statistics; e)Rwanda: RATIN; f) Zambia: Central Statistical Office (CSO) ; g) Kenya: Ministry of Agriculture
Meat Price Indices 2007=100Data Source: a) FAO Commodities and Trade Division; b) Ethiopia: Central Statistical Agency; c) Zambia: Central Statistical Office; d) Rwanda: National Statistical Institute; e) Uganda: Uganda Bureau of Statistics
Milk Price Indices 2007=100Data Source: a) FAO Commodities and Trade Division; b) Ethiopia: Central Statistical Agency; c) Zambia: Central Statistical Office; d) Uganda: Uganda Bureau of Statistics
Sorghum Price Indices 2007=100Data Source: a) FAO Commodities and Trade Division; b) Tanzania: Bank of Tanzania; c)Uganda: Uganda Bureau of Statistics; d) Kenya: Ministry of Agriculture
Irish Potatoes Price Indices 2007=100Data Source: a)  Tanzania: Bank of Tanzania; b)Uganda: Uganda Bureau of Statistics; c)Zambia: Central Statistical Office (CSO) ; d) Kenya: Ministry of Agriculture
Sweet Potatoes Price Indices 2007=100Data Source: a)Uganda: Uganda Bureau of Statistics; b)Kenya: Ministry of Agriculture
Cassava Price Indices 2007=100Data Source: a)Uganda: Uganda Bureau of Statistics; b)Kenya: Ministry of Agriculture c) Malawi: National statistical office of Malawi
Bananas Price Indices 2007=100Data Source: a)Uganda: Uganda Bureau of Statistics; b)Kenya: Ministry of Agriculture
Pattern of price changes is mixedSeverity of the problem differs:across countries
across commodities
time of the yearChange in food prices* Data available up to June 2010; ** Data up to march 2011; *** Teff is main staple food, data not available
Domestic prices are more volatile than global prices...Data source: FAOSTAT (Global), Ministry of Agriculture (Kenya), Central statistics agency (Ethiopia), RATIN (Tanzania and Rwanda), UBOS (Uganda).
Minimal transmission of global price changes to domestic markets...Data Source: RATIN (Kenya, Uganda, Tanzania, Rwanda); Central statistical agency (Ethiopia); FAOSTAT (Global).Correlation coefficients vary between -1 and 1. The closer to 1, the better the integration between the markets. No global and domestic market integration
Some transmission between markets in the region (maize prices)...Data Source: RATIN (Kenya, Uganda, Tanzania, Rwanda); Central statistical agency (Ethiopia)*significant at the 5% significance level+correlation coefficients = maize prices in various markets in EA region tend to move in the same direction, Domestic markets have some degree of integration among themselves, thus price changes will cause flow of food from surplus to deficit areas -exploiting a regional approach
Factors affecting demand for food in EAPopulation growth, rising incomes (though inequalities in income distribution make the poor very vulnerable), urbanization However, demand factors change only slowly and may not be responsible for the recent spikes and volatility
Factors contributing to low supply of food in EALow investments in agriculture and rural developmentHigh prices of inputs – fertilizers, fuel, feedClimatic shocks Impacts of trade: inefficiencies, expensive imports, policies Disruption of supply – conflicts
Fuel Price Indices 2007=100Data Source: a) world: World: US energy information administration independent statistics and analysis; b) Uganda:  Bank of Uganda; c) Kenya: Kenya National Bureau of statistics
World Fertilizer Price indices 2007=100Data Source: World Bank
Yields are low and decreasing or stagnant
Differential impact on householdsPoor are hit hardestNet sellers less affectedRural net buyers more affectedUrban poor depend on markets for food supplies
What levers to pull?Increase production?Productivity decline, climatic factors,…Control demand?Population growth, income inequalities, ...Many slow to respond; >3 years?
Regional approach offers better prospectsExploit diversity in the region
Heterogeneity in productionESA harvesting timelineSource: Data: FEWSNET,2008
Most action is in domestic and regional markets… Busia -KenyaBusia -UgandaBut, there are serious barriers to trade: wasteful, high transaction costs
On going policy response measures to high food prices in EA region Sources; World Bank, 2008; FAO, 2008; Karugia et al, 2009; Okello, J.J, 2009; www.wfp.org; www.fao.orgDespite the various policy actions adopted in EA region to curb rising food prices, the region has continued to experience persistent high and volatile food prices
ConclusionsChanges in global food prices are not transmitted to domestic marketsRegional response offers opportunities to address the food price crisisFood price crisis offers opportunities for agricultural development through increased domestic production, regional trade and integration [Paul Romer: “A crisis is a terrible thing to waste”]
Recommended Policy Options
Protect the vulnerablePriority ActionsTargeted food subsidies and cash transfers where markets are workingTargeted food aid where markets are not workingReduce taxes on food grainsDesign and targeting –key to successFor rural poor, in addition provide production support – inputs, credit, technologies
Exploit regional diversity and facilitate regional tradePriority ActionsRemove export bansEliminate NTBs Simplify tradeUpgrade, maintain infrastructure and facilities on the main trade corridors
Enhance supply responsePriority ActionsMake agricultural inputs affordableBuild on best bet technologies Exploit economies of scale in input procurement and facilitate trade in inputs Pilot innovative risk management strategies – warehouse receipt system, index based insurance systems
Strengthen and use regional institutions for preparedness and responsePriority Actions:Strengthen market information & intelligence (e.g. RATIN,FEWSNET, EAGC)Institutional frameworks for preparedness, response, and learning

Ofab Kenya June-2011

  • 1.
    Persistence of highfood prices in Eastern Africa: What role for policy?By Joseph Karugia, CoordinatorReSAKSS-ECA
  • 2.
    OutlineIntroductionFood Price Situationin ESARegional Dimensions Recommended Policy Options
  • 3.
    Introduction (1)Global foodprice index (FPI) embarked on a downward spiral by July 2008 and remained low and stable for some timeDomestic FPI in Eastern Africa (EA) region on the other hand continued to increase after food crisis, notably in Kenya, Tanzania, Uganda, Ethiopia and DjiboutiIn the first half of 2010, global and domestic food prices eased but remained higher than their historical trends
  • 4.
    Introduction (2)The declinedid not present any immediate relief to the food crises – largely influenced by good weather conditionsBoth global and domestic food prices have risen to historic highs beginning January 2011Significant challenge to reduction of poverty and hunger
  • 5.
    Comparing FAO Globaland EA countries FPIsSource: FAO, 2011; country statistics offices
  • 6.
    Objective and ApproachEffectivepolicy action requires evidence based information on the magnitude and implications of price changes at the country and regional level ApproachData – continuous update of trendsConsultations among policy advisers, analysts and researchers from national, regional and international organizations
  • 7.
    Maize price indicesin EA and global 2007=100Data Source: a) FAO Commodities and Trade Division; b) Ethiopia: Central Statistical Agency; c) Tanzania: Bank of Tanzania; d)Uganda: Uganda Bureau of Statistics; e)Rwanda: RATIN; h) Kenya: Ministry of Agriculture
  • 8.
    Rice Price Indicesin EA and Global 2007=100 Data Source: a) FAO Commodities and Trade Division; b) Ethiopia: Central Statistical Agency; c) Tanzania: Bank of Tanzania; d)Uganda: Uganda Bureau of Statistics; e)Rwanda: RATIN; f) Zambia: Central Statistical Office (CSO) ; g) Madagascar: Institut National de la Statistique
  • 9.
    Wheat Price Indices2007=100Data Source: a) FAO Commodities and Trade Division; b) Ethiopia: Central Statistical Agency; c) Zambia: Central Statistical Office; d) Kenya: Ministry of Agriculture
  • 10.
    Bean Price Indices2007 = 100Data Source: a) FAO Commodities and Trade Division; b) Ethiopia: Central Statistical Agency; c) Tanzania: Bank of Tanzania; d)Uganda: Uganda Bureau of Statistics; e)Rwanda: RATIN; f) Zambia: Central Statistical Office (CSO) ; g) Kenya: Ministry of Agriculture
  • 11.
    Meat Price Indices2007=100Data Source: a) FAO Commodities and Trade Division; b) Ethiopia: Central Statistical Agency; c) Zambia: Central Statistical Office; d) Rwanda: National Statistical Institute; e) Uganda: Uganda Bureau of Statistics
  • 12.
    Milk Price Indices2007=100Data Source: a) FAO Commodities and Trade Division; b) Ethiopia: Central Statistical Agency; c) Zambia: Central Statistical Office; d) Uganda: Uganda Bureau of Statistics
  • 13.
    Sorghum Price Indices2007=100Data Source: a) FAO Commodities and Trade Division; b) Tanzania: Bank of Tanzania; c)Uganda: Uganda Bureau of Statistics; d) Kenya: Ministry of Agriculture
  • 14.
    Irish Potatoes PriceIndices 2007=100Data Source: a) Tanzania: Bank of Tanzania; b)Uganda: Uganda Bureau of Statistics; c)Zambia: Central Statistical Office (CSO) ; d) Kenya: Ministry of Agriculture
  • 15.
    Sweet Potatoes PriceIndices 2007=100Data Source: a)Uganda: Uganda Bureau of Statistics; b)Kenya: Ministry of Agriculture
  • 16.
    Cassava Price Indices2007=100Data Source: a)Uganda: Uganda Bureau of Statistics; b)Kenya: Ministry of Agriculture c) Malawi: National statistical office of Malawi
  • 17.
    Bananas Price Indices2007=100Data Source: a)Uganda: Uganda Bureau of Statistics; b)Kenya: Ministry of Agriculture
  • 18.
    Pattern of pricechanges is mixedSeverity of the problem differs:across countries
  • 19.
  • 20.
    time of theyearChange in food prices* Data available up to June 2010; ** Data up to march 2011; *** Teff is main staple food, data not available
  • 21.
    Domestic prices aremore volatile than global prices...Data source: FAOSTAT (Global), Ministry of Agriculture (Kenya), Central statistics agency (Ethiopia), RATIN (Tanzania and Rwanda), UBOS (Uganda).
  • 22.
    Minimal transmission ofglobal price changes to domestic markets...Data Source: RATIN (Kenya, Uganda, Tanzania, Rwanda); Central statistical agency (Ethiopia); FAOSTAT (Global).Correlation coefficients vary between -1 and 1. The closer to 1, the better the integration between the markets. No global and domestic market integration
  • 23.
    Some transmission betweenmarkets in the region (maize prices)...Data Source: RATIN (Kenya, Uganda, Tanzania, Rwanda); Central statistical agency (Ethiopia)*significant at the 5% significance level+correlation coefficients = maize prices in various markets in EA region tend to move in the same direction, Domestic markets have some degree of integration among themselves, thus price changes will cause flow of food from surplus to deficit areas -exploiting a regional approach
  • 24.
    Factors affecting demandfor food in EAPopulation growth, rising incomes (though inequalities in income distribution make the poor very vulnerable), urbanization However, demand factors change only slowly and may not be responsible for the recent spikes and volatility
  • 25.
    Factors contributing tolow supply of food in EALow investments in agriculture and rural developmentHigh prices of inputs – fertilizers, fuel, feedClimatic shocks Impacts of trade: inefficiencies, expensive imports, policies Disruption of supply – conflicts
  • 26.
    Fuel Price Indices2007=100Data Source: a) world: World: US energy information administration independent statistics and analysis; b) Uganda: Bank of Uganda; c) Kenya: Kenya National Bureau of statistics
  • 27.
    World Fertilizer Priceindices 2007=100Data Source: World Bank
  • 28.
    Yields are lowand decreasing or stagnant
  • 29.
    Differential impact onhouseholdsPoor are hit hardestNet sellers less affectedRural net buyers more affectedUrban poor depend on markets for food supplies
  • 30.
    What levers topull?Increase production?Productivity decline, climatic factors,…Control demand?Population growth, income inequalities, ...Many slow to respond; >3 years?
  • 31.
    Regional approach offersbetter prospectsExploit diversity in the region
  • 32.
    Heterogeneity in productionESAharvesting timelineSource: Data: FEWSNET,2008
  • 33.
    Most action isin domestic and regional markets… Busia -KenyaBusia -UgandaBut, there are serious barriers to trade: wasteful, high transaction costs
  • 34.
    On going policyresponse measures to high food prices in EA region Sources; World Bank, 2008; FAO, 2008; Karugia et al, 2009; Okello, J.J, 2009; www.wfp.org; www.fao.orgDespite the various policy actions adopted in EA region to curb rising food prices, the region has continued to experience persistent high and volatile food prices
  • 35.
    ConclusionsChanges in globalfood prices are not transmitted to domestic marketsRegional response offers opportunities to address the food price crisisFood price crisis offers opportunities for agricultural development through increased domestic production, regional trade and integration [Paul Romer: “A crisis is a terrible thing to waste”]
  • 36.
  • 37.
    Protect the vulnerablePriorityActionsTargeted food subsidies and cash transfers where markets are workingTargeted food aid where markets are not workingReduce taxes on food grainsDesign and targeting –key to successFor rural poor, in addition provide production support – inputs, credit, technologies
  • 38.
    Exploit regional diversityand facilitate regional tradePriority ActionsRemove export bansEliminate NTBs Simplify tradeUpgrade, maintain infrastructure and facilities on the main trade corridors
  • 39.
    Enhance supply responsePriorityActionsMake agricultural inputs affordableBuild on best bet technologies Exploit economies of scale in input procurement and facilitate trade in inputs Pilot innovative risk management strategies – warehouse receipt system, index based insurance systems
  • 40.
    Strengthen and useregional institutions for preparedness and responsePriority Actions:Strengthen market information & intelligence (e.g. RATIN,FEWSNET, EAGC)Institutional frameworks for preparedness, response, and learning