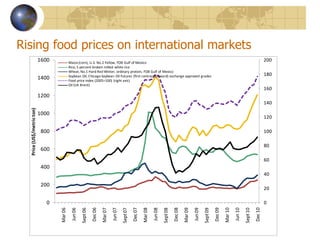
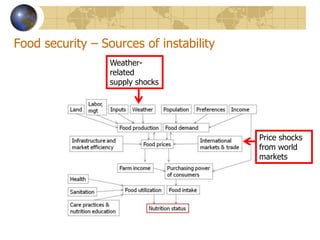
Rising global food prices and domestic food security in Uganda require ongoing monitoring and analysis of indicators to understand trends and impacts. Key information needs include:
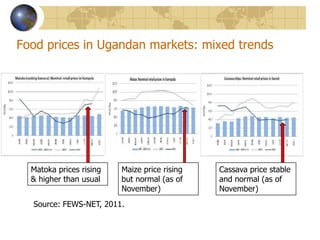
1) Monitoring domestic food prices, production, consumption and nutrition status to track food security.
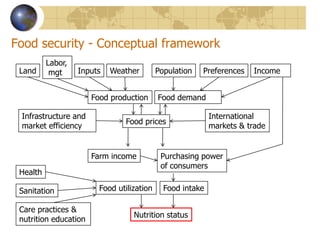
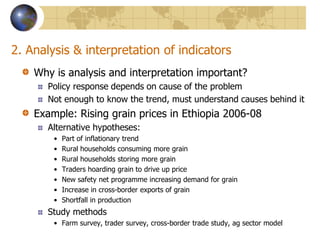
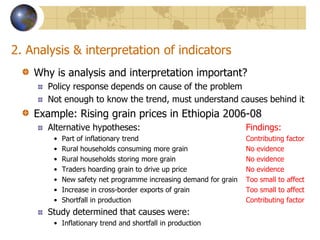
2) Analyzing indicators to identify causes of changes, such as whether rising prices stem from global markets, weather, or other factors.
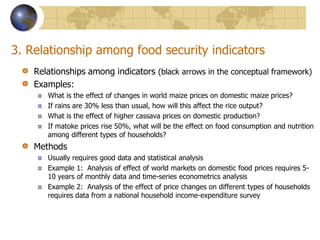
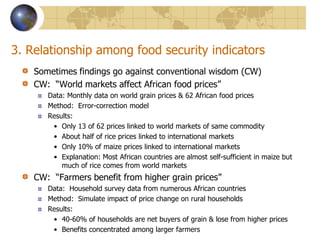
3) Assessing relationships between indicators like how crop failures or price hikes affect households.
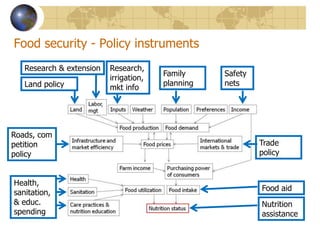
4) Evaluating impacts of policies on food security, which requires methods like randomized trials. Balancing data collection costs and accuracy is important for effective policy responses.