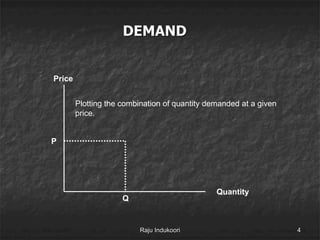
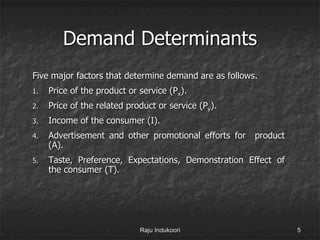
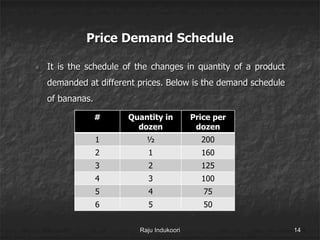
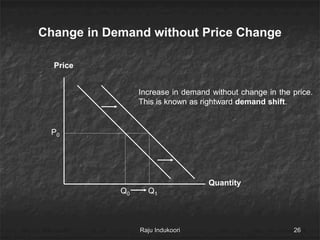
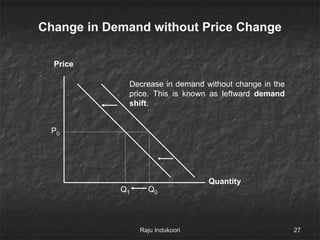
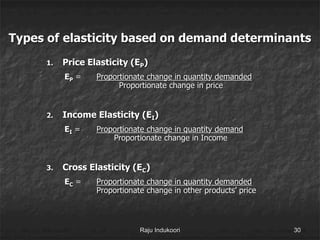
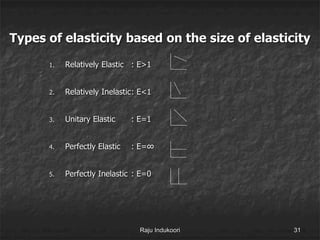
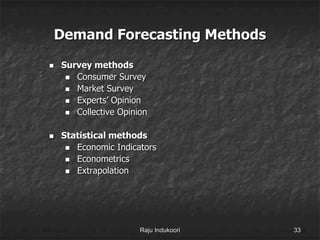
Demand Function
Raju Indukoori
Content
1. Demand
2. Demand determinants
3. Demand Function
4. Law of Demand
5. Law of diminishing marginal utility
6. Types of demand
7. Demand curve shift
8. Elasticity of demand
9. Demand Forecasting
Raju Indukoori 2
Demand
It is the quantity of a good purchased by consumer/s which
comes out of desire with willingness and ability for a given
price and at a given point of time. This makes the following
important ingredients of demand.
1. Desire through need or want
2. Ability to pay
3. Willingness to pay
Raju Indukoori 3
DEMAND
Quantity
Price
Plotting the combination of quantity demanded at a given
price.
Q
P
Raju Indukoori 4
Demand Determinants
Five major factors that determine demand are as follows.
1. Price of the product or service (Px).
2. Price of the related product or service (Py).
3. Income of the consumer (I).
4. Advertisement and other promotional efforts for product
(A).
5. Taste, Preference, Expectations, Demonstration Effect of
the consumer (T).
Raju Indukoori 5
Demand Function
The quantity demanded for a product depends on
various factors which make demand function. It can
expressed as follows.
D = f(Px, Py, I, A, T)
Where
Px = Price of the product or service X.
Py = Price of the substitute product or service Y.
I = Income of the consumer.
A = Advertisement and other promotional efforts for product x.
T = Taste, Preference, Demonstration Effect.
Raju Indukoori 6
Law of Demand
Law of demand was stated and documented by Alfred Marshall in 1892
and accepted by other economists
 Other things remaining the same, the amount demanded increases
with a fall in price and diminishes with a rise in price – Alfred
Marshall.
 Law of demand states that people will buy more at lower prices
and buy less at higher – Samuelson.
 Quantity demanded varies inversely with price – Ferguson.
Law of demand states that, for a given change in price of a product
there is a change in the quantity demanded for the same product in
proportion to the change in the price. Usually for a given decrease in
price quantity demanded would increase, vice versa which is know as
Law of demand. Change in price and change in quantity purchased are
inversely proportional.
Raju Indukoori 7
Law of diminishing marginal utility
 The law of diminishing marginal utility that, as the
consumer consumes more products the utility that he
derives from each additional or marginal product
diminishes. It diminishes to an extent that it becomes
zero or even negative.
 This is base for the law of demand.
 Utility is measured in cardinals or ordinal units.
Raju Indukoori 8
Utility Measure
No of Chocolates Marginal Utility Total Utility
1 50 50
2 30 80
3 10 90
4 5 95
5 0 95
6 -5 90
Raju Indukoori 9
Exceptions for law of demand
1) Giffen’s Paradox
1) Inferior and superior goods
2) Daily needs which cannot be avoidable
2) Veblen goods : Prestigious goods like diamonds, Premium
cars, footwear, smart phones, food items, etc.
3) Speculation: Anticipate future price rise and accumulate
now.
4) Consumer’s quality perception: High price is considered
as qualitative product and low priced product as of low
quality.
5) Irrational consumer: Basis to value a product and arrive at
a price is ignored.
Raju Indukoori 10
Types of Demand
Based on the demanding unit
1) Individual demand: Demand by an individual buyer.
2) Firm demand: It is the demand of an individual
company or firm which is determined by economic
conditions and competition.
3) Market demand /Total demand /industry demand:
It is the demand of all buyers or players in a market
including individuals, companies and government, which is
subject to general economic conditions.
Raju Indukoori 11
Types of Demand
Based on demand determinants
1) Price demand : Demand influenced buy changes in the
prices level of the product
2) Income demand: Change in income influences the
demand level. Even product switch from inferior products
to superior products happens.
3) Cross demand : Demand influenced by the changes in
the substitute or complementary product.
Raju Indukoori 12
1. PRICE DEMAND
1) It is the demand influenced buy changes in the prices
level.
 As the price increases, demand decreases
 As the price decreases, demand increase
Raju Indukoori 13
Price Demand Schedule
 It is the schedule of the changes in quantity of a product
demanded at different prices. Below is the demand schedule
of bananas.
# Quantity in
dozen
Price per
dozen
1 ½ 200
2 1 160
3 2 125
4 3 100
5 4 75
6 5 50
Raju Indukoori 14
Demand Curve
Demand curve shows the relationship between price
and quantity demanded at a given point of time
holding everything else constant. The movements
along demand curve are as follows.
 A rise in price causes upward movement along a
given demand curve.
 A price decline causes downward movement
along a given demand curve.
Raju Indukoori 15
Change in demand with price rise
Quantity
Price
P0
Q0
P1
Q1
Negative Slope: An increase in price causes a
decrease in quantity demanded.
Raju Indukoori 16
Change in Demand with Price Fall
Quantity
Price
P0
Q0
P1
Q1
Negative Slope: A decrease in price
causes an increase in quantity demanded.
Raju Indukoori 17
2. INCOME DEMAND
1) Change in income levels influences the demand level for a
product in two different ways as follows
2) 1) Increase in demand
3) 2) Decrease in demand
Raju Indukoori 18
Income increases – Demand increases
1) Change in income levels influences the demand level for a
product in two different ways as follows
2) 1) Increase in demand
3) 2) Decrease in demand
Raju Indukoori 19
Income increases – Demand increases
Quantity
Income
I0
Q0
I1
Q1
Positive Slope: An increase in
income causes an increase in
quantity demanded.
Raju Indukoori 20
Income increases – Demand Decreases
Quantity
Income
I0
Q0
I1
Q1
Negative Slope: An increase in income
causes a decrease in quantity demanded
due to the reason that the product becomes
inferior and the buyer partially or wholly
shifts to another product
Raju Indukoori 21
3. CROSS DEMAND
1) The quantity demanded is influenced by the price of other
goods related to the product demanded. They can be
classified as
2) 1) Supplementary goods : Substitute or alternative
consumables like tea – coffee.
3) 2) Complementary goods : Related consumables like
milk and tea.
Raju Indukoori 22
Cross Demand – Substitute goods
Tea Quantity
Price of Coffee
P0
Q0
P1
Q1
Positive Slope: An increase in
coffee price made coffee
consumers to switch wholly or
partially to tea consumption
leading to an increase in demand
for tea.
Raju Indukoori 23
Cross Demand – Complementary goods
Quantity of 2 wheelers
Fuel Price
P0
Q0
P1
Q1
Negative Slope: An increase in fuel price
causes a decrease in quantity demanded.
Raju Indukoori 24
DEMAND CURVE SHIFT
 Change in non-price variables will define a new demand
curve
 Demand increase: If a non-price change allows more
to be sold at every price.
 Demand decrease : If a non-price change causes less
to be sold at every price.
Raju Indukoori 25
Quantity
Price
P0
Q0 Q1
Increase in demand without change in the price.
This is known as rightward demand shift.
Change in Demand without Price Change
Raju Indukoori 26
Quantity
Price
P0
Q1 Q0
Decrease in demand without change in the
price. This is known as leftward demand
shift.
Change in Demand without Price Change
Raju Indukoori 27
Factors contributing to Shift in demand
1. Change in Buyers’ Tastes
2. Change in Buyers’ Incomes
1. Normal Goods
2. Inferior Goods
3. Change in the Number of Buyers
4. Change in the Price of Related Goods
1. Substitute Goods
2. Complementary Goods
Raju Indukoori 28
ELASTICITY OF DEMAND
 It is the measure of the degree of change in the demand for
a product, in response to a give change in the price, income
and change in price of other related products.
 Law of demand shows the direction of the demand in
response to price change whereas, elasticity of demand
gives the extent of change in demand for the given change
in the influencing factor.
 Elasticity of demand is measured by comparing
proportionate change in demand and Proportionate change
in price.
Raju Indukoori 29
Types of elasticity based on demand determinants
1. Price Elasticity (EP)
EP = Proportionate change in quantity demanded
Proportionate change in price
2. Income Elasticity (EI)
EI = Proportionate change in quantity demand
Proportionate change in Income
3. Cross Elasticity (EC)
EC = Proportionate change in quantity demanded
Proportionate change in other products’ price
Raju Indukoori 30
Types of elasticity based on the size of elasticity
1. Relatively Elastic : E>1
2. Relatively Inelastic: E<1
3. Unitary Elastic : E=1
4. Perfectly Elastic : E=∞
5. Perfectly Inelastic : E=0
Raju Indukoori 31
Business and demand
 All business entities rely on preparing demand schedules
and demand curves for their own products as well as their
competitors products to know where they stand in business
 Historic demand analysis is the base for future sales.
 Demand forecasting is done by all business houses to
accommodate themselves in terms of future product
readiness and distribution of the same.
Raju Indukoori 32
Demand Forecasting Methods
 Survey methods
 Consumer Survey
 Market Survey
 Experts’ Opinion
 Collective Opinion
 Statistical methods
 Economic Indicators
 Econometrics
 Extrapolation
Raju Indukoori 33
Popular forecasting approaches for a new product
 Evolutionary: The product is assumed to be new to the
market.
 Substitute: The product as a substitute for the existing
products in the market.
 Growth curve: Higher the growth of the market, more is
the demand expected.
 Opinion polling: Consumer polling with samples and
designing the product as per the feed back.
 Sales experience: Test the market in one distribution
channel or market.
 Vicarious: Indirect survey of consumers through dealers.
Raju Indukoori 34
Thank You
Raju Indukoori 35
Raju Indukoori
Questions?
36

Demand Function

  • 1.
  • 2.
    Content 1. Demand 2. Demanddeterminants 3. Demand Function 4. Law of Demand 5. Law of diminishing marginal utility 6. Types of demand 7. Demand curve shift 8. Elasticity of demand 9. Demand Forecasting Raju Indukoori 2
  • 3.
    Demand It is thequantity of a good purchased by consumer/s which comes out of desire with willingness and ability for a given price and at a given point of time. This makes the following important ingredients of demand. 1. Desire through need or want 2. Ability to pay 3. Willingness to pay Raju Indukoori 3
  • 4.
    DEMAND Quantity Price Plotting the combinationof quantity demanded at a given price. Q P Raju Indukoori 4
  • 5.
    Demand Determinants Five majorfactors that determine demand are as follows. 1. Price of the product or service (Px). 2. Price of the related product or service (Py). 3. Income of the consumer (I). 4. Advertisement and other promotional efforts for product (A). 5. Taste, Preference, Expectations, Demonstration Effect of the consumer (T). Raju Indukoori 5
  • 6.
    Demand Function The quantitydemanded for a product depends on various factors which make demand function. It can expressed as follows. D = f(Px, Py, I, A, T) Where Px = Price of the product or service X. Py = Price of the substitute product or service Y. I = Income of the consumer. A = Advertisement and other promotional efforts for product x. T = Taste, Preference, Demonstration Effect. Raju Indukoori 6
  • 7.
    Law of Demand Lawof demand was stated and documented by Alfred Marshall in 1892 and accepted by other economists  Other things remaining the same, the amount demanded increases with a fall in price and diminishes with a rise in price – Alfred Marshall.  Law of demand states that people will buy more at lower prices and buy less at higher – Samuelson.  Quantity demanded varies inversely with price – Ferguson. Law of demand states that, for a given change in price of a product there is a change in the quantity demanded for the same product in proportion to the change in the price. Usually for a given decrease in price quantity demanded would increase, vice versa which is know as Law of demand. Change in price and change in quantity purchased are inversely proportional. Raju Indukoori 7
  • 8.
    Law of diminishingmarginal utility  The law of diminishing marginal utility that, as the consumer consumes more products the utility that he derives from each additional or marginal product diminishes. It diminishes to an extent that it becomes zero or even negative.  This is base for the law of demand.  Utility is measured in cardinals or ordinal units. Raju Indukoori 8
  • 9.
    Utility Measure No ofChocolates Marginal Utility Total Utility 1 50 50 2 30 80 3 10 90 4 5 95 5 0 95 6 -5 90 Raju Indukoori 9
  • 10.
    Exceptions for lawof demand 1) Giffen’s Paradox 1) Inferior and superior goods 2) Daily needs which cannot be avoidable 2) Veblen goods : Prestigious goods like diamonds, Premium cars, footwear, smart phones, food items, etc. 3) Speculation: Anticipate future price rise and accumulate now. 4) Consumer’s quality perception: High price is considered as qualitative product and low priced product as of low quality. 5) Irrational consumer: Basis to value a product and arrive at a price is ignored. Raju Indukoori 10
  • 11.
    Types of Demand Basedon the demanding unit 1) Individual demand: Demand by an individual buyer. 2) Firm demand: It is the demand of an individual company or firm which is determined by economic conditions and competition. 3) Market demand /Total demand /industry demand: It is the demand of all buyers or players in a market including individuals, companies and government, which is subject to general economic conditions. Raju Indukoori 11
  • 12.
    Types of Demand Basedon demand determinants 1) Price demand : Demand influenced buy changes in the prices level of the product 2) Income demand: Change in income influences the demand level. Even product switch from inferior products to superior products happens. 3) Cross demand : Demand influenced by the changes in the substitute or complementary product. Raju Indukoori 12
  • 13.
    1. PRICE DEMAND 1)It is the demand influenced buy changes in the prices level.  As the price increases, demand decreases  As the price decreases, demand increase Raju Indukoori 13
  • 14.
    Price Demand Schedule It is the schedule of the changes in quantity of a product demanded at different prices. Below is the demand schedule of bananas. # Quantity in dozen Price per dozen 1 ½ 200 2 1 160 3 2 125 4 3 100 5 4 75 6 5 50 Raju Indukoori 14
  • 15.
    Demand Curve Demand curveshows the relationship between price and quantity demanded at a given point of time holding everything else constant. The movements along demand curve are as follows.  A rise in price causes upward movement along a given demand curve.  A price decline causes downward movement along a given demand curve. Raju Indukoori 15
  • 16.
    Change in demandwith price rise Quantity Price P0 Q0 P1 Q1 Negative Slope: An increase in price causes a decrease in quantity demanded. Raju Indukoori 16
  • 17.
    Change in Demandwith Price Fall Quantity Price P0 Q0 P1 Q1 Negative Slope: A decrease in price causes an increase in quantity demanded. Raju Indukoori 17
  • 18.
    2. INCOME DEMAND 1)Change in income levels influences the demand level for a product in two different ways as follows 2) 1) Increase in demand 3) 2) Decrease in demand Raju Indukoori 18
  • 19.
    Income increases –Demand increases 1) Change in income levels influences the demand level for a product in two different ways as follows 2) 1) Increase in demand 3) 2) Decrease in demand Raju Indukoori 19
  • 20.
    Income increases –Demand increases Quantity Income I0 Q0 I1 Q1 Positive Slope: An increase in income causes an increase in quantity demanded. Raju Indukoori 20
  • 21.
    Income increases –Demand Decreases Quantity Income I0 Q0 I1 Q1 Negative Slope: An increase in income causes a decrease in quantity demanded due to the reason that the product becomes inferior and the buyer partially or wholly shifts to another product Raju Indukoori 21
  • 22.
    3. CROSS DEMAND 1)The quantity demanded is influenced by the price of other goods related to the product demanded. They can be classified as 2) 1) Supplementary goods : Substitute or alternative consumables like tea – coffee. 3) 2) Complementary goods : Related consumables like milk and tea. Raju Indukoori 22
  • 23.
    Cross Demand –Substitute goods Tea Quantity Price of Coffee P0 Q0 P1 Q1 Positive Slope: An increase in coffee price made coffee consumers to switch wholly or partially to tea consumption leading to an increase in demand for tea. Raju Indukoori 23
  • 24.
    Cross Demand –Complementary goods Quantity of 2 wheelers Fuel Price P0 Q0 P1 Q1 Negative Slope: An increase in fuel price causes a decrease in quantity demanded. Raju Indukoori 24
  • 25.
    DEMAND CURVE SHIFT Change in non-price variables will define a new demand curve  Demand increase: If a non-price change allows more to be sold at every price.  Demand decrease : If a non-price change causes less to be sold at every price. Raju Indukoori 25
  • 26.
    Quantity Price P0 Q0 Q1 Increase indemand without change in the price. This is known as rightward demand shift. Change in Demand without Price Change Raju Indukoori 26
  • 27.
    Quantity Price P0 Q1 Q0 Decrease indemand without change in the price. This is known as leftward demand shift. Change in Demand without Price Change Raju Indukoori 27
  • 28.
    Factors contributing toShift in demand 1. Change in Buyers’ Tastes 2. Change in Buyers’ Incomes 1. Normal Goods 2. Inferior Goods 3. Change in the Number of Buyers 4. Change in the Price of Related Goods 1. Substitute Goods 2. Complementary Goods Raju Indukoori 28
  • 29.
    ELASTICITY OF DEMAND It is the measure of the degree of change in the demand for a product, in response to a give change in the price, income and change in price of other related products.  Law of demand shows the direction of the demand in response to price change whereas, elasticity of demand gives the extent of change in demand for the given change in the influencing factor.  Elasticity of demand is measured by comparing proportionate change in demand and Proportionate change in price. Raju Indukoori 29
  • 30.
    Types of elasticitybased on demand determinants 1. Price Elasticity (EP) EP = Proportionate change in quantity demanded Proportionate change in price 2. Income Elasticity (EI) EI = Proportionate change in quantity demand Proportionate change in Income 3. Cross Elasticity (EC) EC = Proportionate change in quantity demanded Proportionate change in other products’ price Raju Indukoori 30
  • 31.
    Types of elasticitybased on the size of elasticity 1. Relatively Elastic : E>1 2. Relatively Inelastic: E<1 3. Unitary Elastic : E=1 4. Perfectly Elastic : E=∞ 5. Perfectly Inelastic : E=0 Raju Indukoori 31
  • 32.
    Business and demand All business entities rely on preparing demand schedules and demand curves for their own products as well as their competitors products to know where they stand in business  Historic demand analysis is the base for future sales.  Demand forecasting is done by all business houses to accommodate themselves in terms of future product readiness and distribution of the same. Raju Indukoori 32
  • 33.
    Demand Forecasting Methods Survey methods  Consumer Survey  Market Survey  Experts’ Opinion  Collective Opinion  Statistical methods  Economic Indicators  Econometrics  Extrapolation Raju Indukoori 33
  • 34.
    Popular forecasting approachesfor a new product  Evolutionary: The product is assumed to be new to the market.  Substitute: The product as a substitute for the existing products in the market.  Growth curve: Higher the growth of the market, more is the demand expected.  Opinion polling: Consumer polling with samples and designing the product as per the feed back.  Sales experience: Test the market in one distribution channel or market.  Vicarious: Indirect survey of consumers through dealers. Raju Indukoori 34
  • 35.
  • 36.