Downloaded 395 times
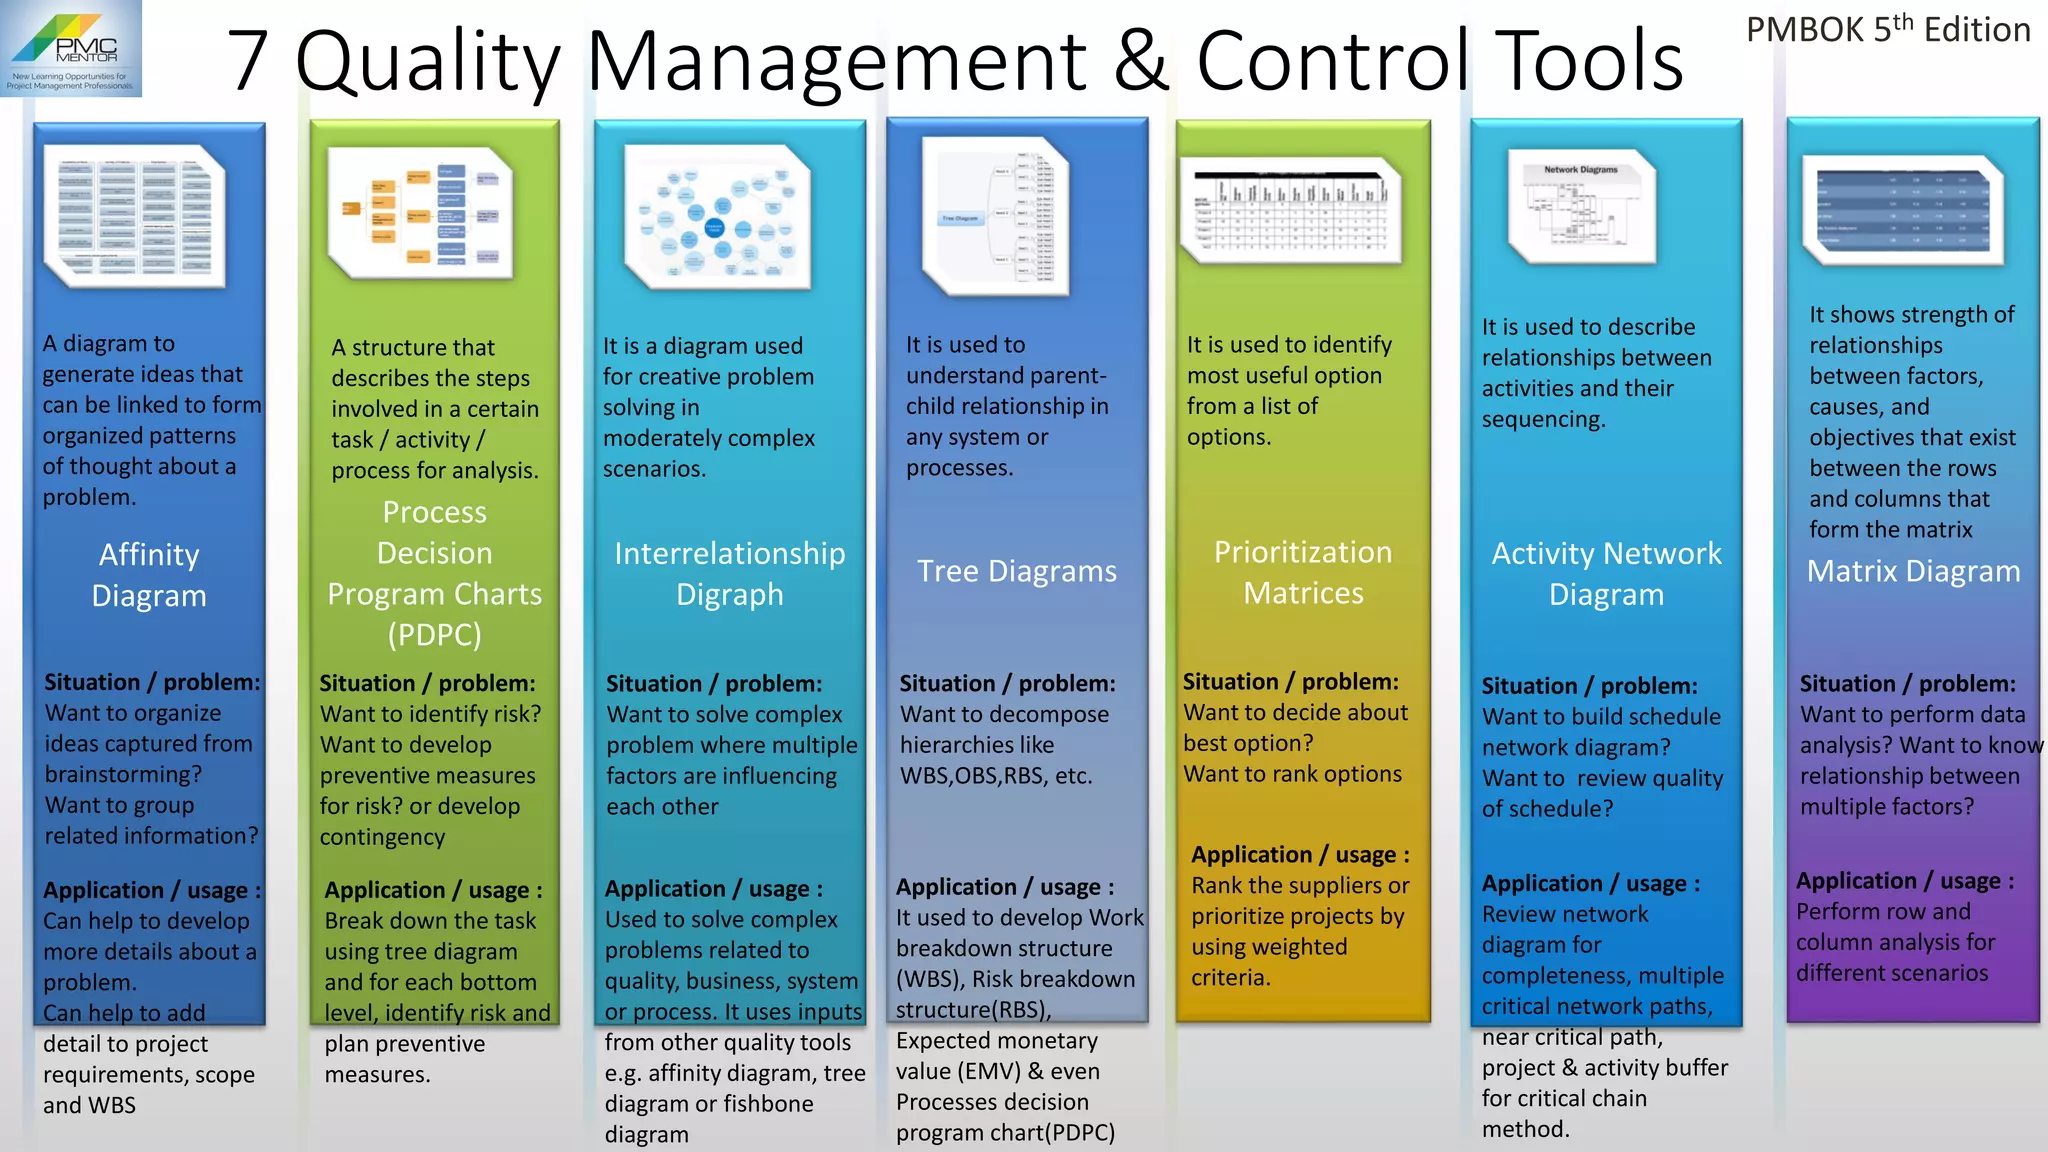

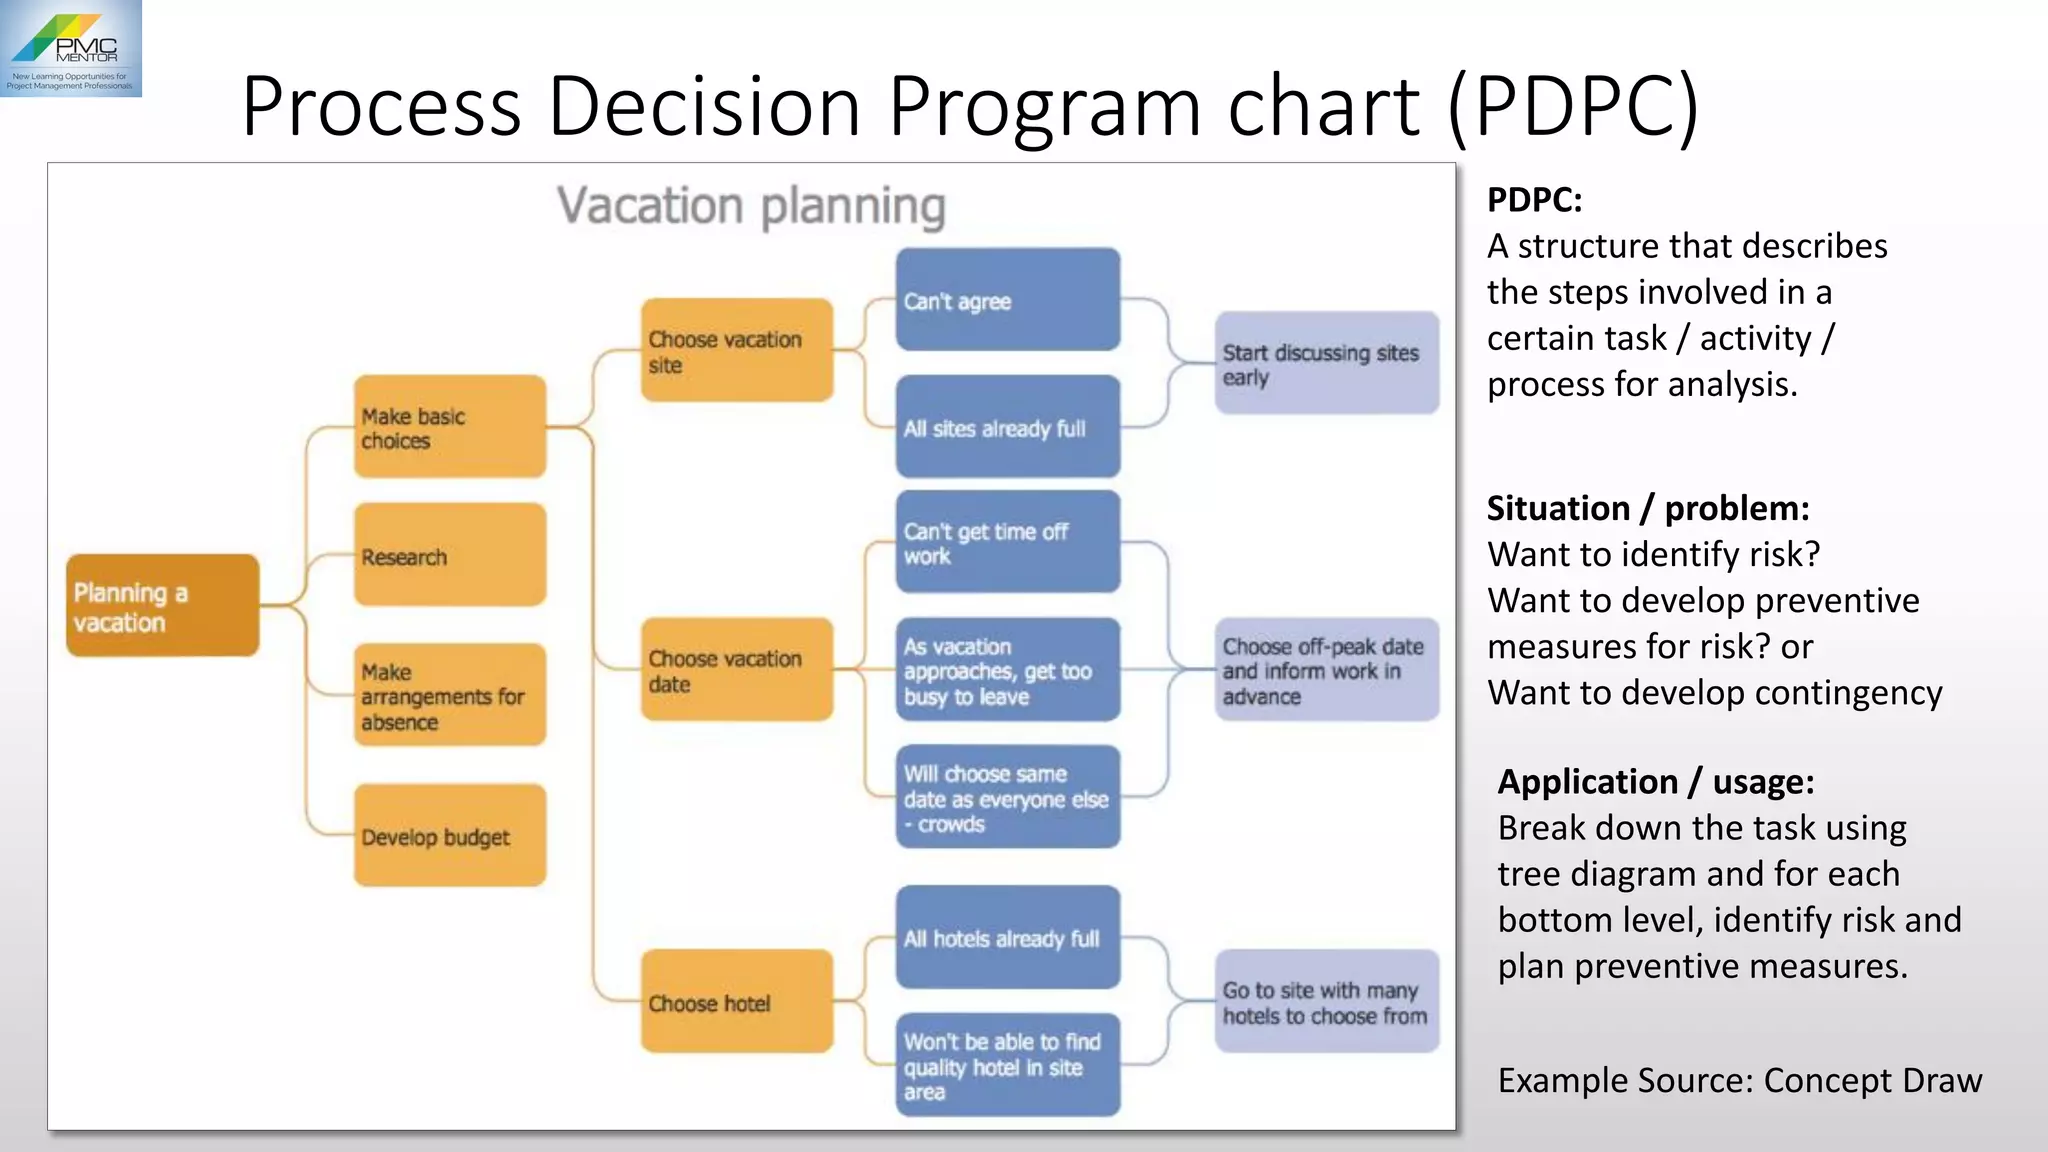


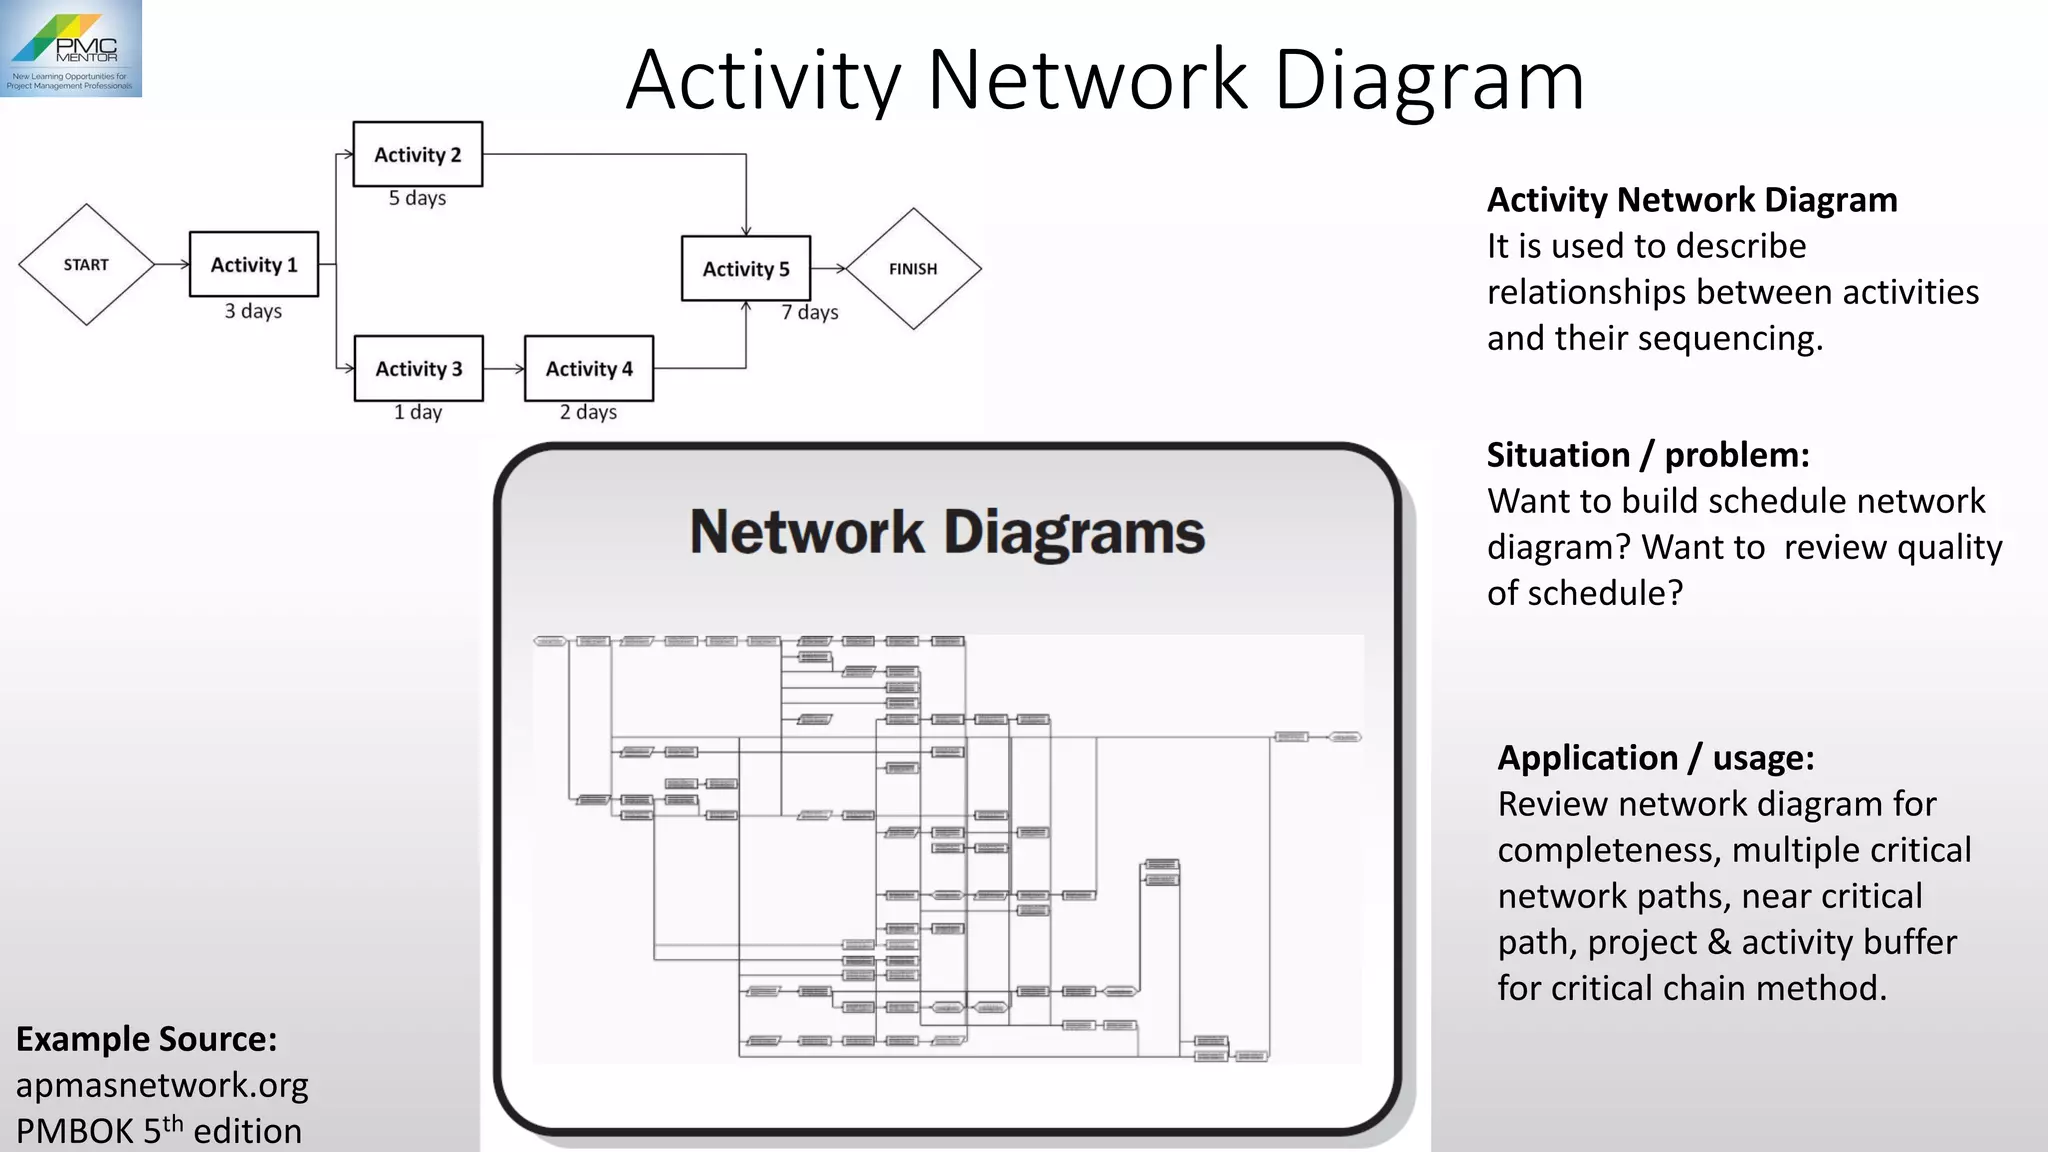


The document outlines various quality management and control tools, including affinity diagrams, decision program charts, and prioritization matrices, which are used for organizing thoughts, identifying risks, and analyzing relationships between factors. It describes their applications in problem-solving and project management, detailing specific situations where each tool can be beneficial. Additionally, it provides resources for PMP exam preparation.