Normal or skewed distributions (descriptive two samples)
•Download as PPTX, PDF•
2 likes•397 views

Normal or skewed distributions (descriptive two samples)

Recommended
Recommended
More Related Content
What's hot
What's hot (20)
Similar to Normal or skewed distributions (descriptive two samples)
Similar to Normal or skewed distributions (descriptive two samples) (20)
More from Ken Plummer
More from Ken Plummer (20)
Recently uploaded
Recently uploaded (20)
Normal or skewed distributions (descriptive two samples)
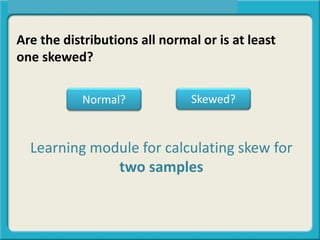
- 1. Are the distributions all normal or is at least one skewed? Normal? Skewed? Learning module for calculating skew for two samples
- 2. We will show you the answer to that question within the context of a problem.
- 3. Problem Is there a significant difference between drivers of old cars and drivers of new cars in terms of average freeway driving speed? First let’s determine if the old and new car distributions are normal or skewed.
- 4. Problem Is there a significant difference between drivers of old cars and drivers of new cars in terms of average freeway driving speed? First let’s determine if the old and new car distributions are normal or skewed.
- 5. Data Set Access the data set below: Link to data set
- 6. SPSS If necessary, copy and paste the data into SPSS by following the instructions at this link. Note – go to the 2nd page of the instructions
- 7. How to check for skew with two samples in SPSS.
- 9. Compare Means - Means Step 2
- 10. Select the Dependent Variable – click the arrow Step 3
- 11. Select the Dependent Variable – click the arrow Step 3
- 12. Select the Independent Variable – click the arrow Step 3
- 14. Bring Skew and Standard Error of the Skew over then click Continue Step 5
- 15. Click OK Step 5
- 16. Output
- 17. Let’s Interpret!
- 18. Let’s Interpret! First, we have to determine if this is a descriptive or inferential question.
- 19. Let’s Interpret! If descriptive, we look just at this value
- 20. Let’s Interpret! For the new car distribution the skewness is -.953.
- 21. Let’s Interpret! For the new car distribution the skewness is -.953. If the skewness is below -2.0 or above +2.0 then the distribution is considered skewed.
- 22. Because -.953 is between -2.0 and +2.0 then the distribution is considered normal.
- 23. Let’s Interpret! Therefore the new car distribution is considered Normal if we are dealing with descriptive statistics
- 24. Now the focus turns to the skewness of the old car distribution.
- 25. Let’s Interpret! For the old car distribution the skewness is -2.344.
- 26. Let’s Interpret! Because the old car distribution skewness is less than -2.0 it is considered negative or left skewed.
- 27. Let’s practice
- 28. Is the old car data set skewed or normal? Report speed new_old_car Mean N Std. Deviation Skewness Std. Error of Skewness New car 72.81 16 6.595 -.953 .564 Old car 79.94 17 18.081 3.344 .550 Total 76.48 33 14.034 -1.832 .409 Normal? Skewed?
- 29. Report speed new_old_car Mean N Std. Deviation Skewness Std. Error of Skewness New car 72.81 16 6.595 -.953 .564 Old car 79.94 17 18.081 3.344 .550 Total 76.48 33 14.034 -1.832 .409 Is the old car data set skewed or normal? Normal? Skewed?
- 30. Report speed new_old_car Mean N Std. Deviation Skewness Std. Error of Skewness New car 72.81 16 6.595 -.953 .564 Old car 79.94 17 18.081 3.344 .550 Total 76.48 33 14.034 -1.832 .409 Is the old car data set skewed or normal? Normal? Skewed? Because +3.344 is greater than +2.0 then the distribution is considered positively or right skewed.
- 31. Is the new car data set skewed or normal? Normal? Skewed?
- 32. Is the new car data set skewed or normal? Normal? Skewed? Report speed new_old_car Mean N Std. Deviation Skewness Std. Error of Skewness New car 72.81 16 6.595 1.813 .993 Old car 79.94 17 18.081 -2.344 .550 Total 76.48 33 14.034 -1.832 .409
- 33. Report speed new_old_car Mean N Std. Deviation Skewness Std. Error of Skewness New car 72.81 16 6.595 1.813 .993 Old car 79.94 17 18.081 -2.344 .550 Total 76.48 33 14.034 -1.832 .409 Is the new car data set skewed or normal? Normal? Skewed?
- 34. Report speed new_old_car Mean N Std. Deviation Skewness Std. Error of Skewness New car 72.81 16 6.595 1.813 .993 Old car 79.94 17 18.081 -2.344 .550 Total 76.48 33 14.034 -1.832 .409 Is the new car data set skewed or normal? Normal? Skewed?
- 35. Report speed new_old_car Mean N Std. Deviation Skewness Std. Error of Skewness New car 72.81 16 6.595 1.813 .993 Old car 79.94 17 18.081 -2.344 .550 Total 76.48 33 14.034 -1.832 .409 Is the new car data set skewed or normal? Normal? Skewed? Because 1.81 is between -2.0 and +2.0 then the distribution is considered normal.
- 36. After calculating the skew for the data set in your original problem, determine if the distributions are all normal or is there at least one that is skewed? Normal? Skewed?