SlideShare a Scribd company logo
1 of 39
What category of method is appropriate for the
research question? Methods dealing with …
Central Tendency? Spread? Symmetry?
Central Tendency Tells you about where the data are
clustering or centered in the
distribution (e.g., average, center, middle).
Spread Tells you about how spread out the
data are from the middle. (e.g., spread,
difference, deviation, range, variation, vary
etc.)
Symmetry Tells you about the shape of the
distribution.
Note – if before going on you would like to
brush up on what a distribution is – click the link
below:
Link to instruction on distributions
Return to this slide when you are done.
Central Tendency
Central Tendency, Spread, or Distribution Shape?
Central Tendency
Central Tendency, Spread, or Distribution Shape?
Tells you about where the data are
clustering or centering.
Look for words like, average, mean,
median, most common, center point
etc.
Note – to review what a distribution is go to slide 44 and then return to this slide.
Central Tendency
Central Tendency, Spread, or Distribution Shape?
Tells you about where the data are
clustering or centering.
Look for words like, average, mean,
median, most common, center point
etc.
Note – to review what a distribution is go to slide 44 and then return to this slide.
Central Tendency
Central Tendency, Spread, or Distribution Shape?
Tells you about where the data are
clustering or centering.
Look for words like, average, mean,
median, most common, center point
etc.
Examples:
What is the average test score?
What is the most frequent score?
What is the median income?
Central Tendency, Spread, or Distribution Shape?
Spread
Central Tendency, Spread, or Distribution Shape?
Spread Tells you about how spread out the
data are from one another.
Look for words like spread,
difference, deviation, range,
variation, vary, etc.
Central Tendency, Spread, or Distribution Shape?
Examples:
How spread out are the test results?
How much does income vary in community X?
What is the difference between the highest and lowest scores?
Spread Tells you about how spread out the
data are from one another.
Look for words like spread,
difference, deviation, range,
variation, vary, etc.
Central Tendency, Spread, or Distribution Shape?
Symmetry
Central Tendency, Spread, or Distribution Shape?
Symmetry Tells you about the shape of the
distribution.
Look for words like shape or
expressions like
• Most of the data in the center.
• A few data points to the left or right.
• All data evenly distributed.
• Shape of the distribution is very
peaked.
Central Tendency, Spread, or Distribution Shape?
Example:
Are the lab results mostly on the high or low end?
Symmetry Tells you about the shape of the
distribution.
Look for words like shape or
expressions like
• Most of the data in the center.
• A few data points to the left or right.
• All data evenly distributed.
• Shape of the distribution is very
peaked.
Important Note
Every data set has central tendency, spread,
and symmetry.
Student Test Score
Anne 35
Bob 31
Carla 43
Daniel 29
Eva 30
Important Note
Every data set has central tendency, spread, and
symmetry.
Student Test Score
Anne 35
Bob 31
Carla 43
Daniel 29
Eva 30
In the practices that follow, you
will be directed to focus on one
of these at a time.
In summary
Central Tendency Tells you about where the data are
clustering or centered in the
distribution (e.g., average, center, middle).
Spread Tells you about how spread out the
data are from the middle. (e.g., spread,
difference, deviation, range, variation, vary
etc.)
Symmetry Tells you about the shape of the
distribution.
Let’s Practice
Problem #1
Question: What is the average number of cyberbullying incidents
among freshmen, sophomores, juniors, and seniors?
Problem #1
Question: What is the average number of cyberbullying incidents
among freshmen, sophomores, juniors, and seniors?
Instructions: Which type of description of the distribution
(below) is most relevant to the question (above)?
Central Tendency Spread Symmetry
Problem #1
Question: What is the average number of cyberbullying incidents
among freshmen, sophomores, juniors, and seniors?
Central Tendency Spread Symmetry
Problem #1
Question: What is the average number of cyberbullying incidents
among freshmen, sophomores, juniors, and seniors?
Central Tendency Spread Symmetry
Tells you about where the data are clustering or centering.
Look for words like, average, mean, median, most common, center point etc.
Problem #1
Question: What is the average number of cyberbullying
incidents among freshmen, sophomores, juniors, and seniors?
Central Tendency Spread Symmetry
Tells you about where the data are clustering or centering.
Look for words like, average, mean, median, most common, center point etc.
Problem #2
Question: What is the difference between the lowest and
highest score on a survey designed to test the impact of a new
therapy?
Problem #2
Question: What is the difference between the lowest and
highest score on a survey designed to test the impact of a new
therapy?
Instructions: Which type of description of the distribution
(below) is most relevant to the question (above)?
Central Tendency Spread Symmetry
Problem #2
Question: What is the difference between the lowest and
highest score on a survey designed to test the impact of a new
therapy?
Central Tendency Spread Symmetry
Problem #2
Question: What is the difference between the lowest and
highest score on a survey designed to test the impact of a new
therapy?
Central Tendency Spread Symmetry
Tells you about how spread out the data are from one another.
Look for words like spread, difference, deviation, range, variation, etc.
Problem #3
Question: The director of a health clinic has asked you to help
her analyze data from the results of patient systolic blood
pressure readings. You decide to compute the mean systolic
pressure to see where the patient results cluster.
Problem #3
Question: The director of a health clinic has asked you to help
her analyze data from the results of patient systolic blood
pressure readings. You decide to compute the mean systolic
pressure to see where the patient results cluster.
Instructions: Which type of description of the distribution
(below) is most relevant to the question (above)?
Central Tendency Spread Symmetry
Problem #3
Question: The director of a health clinic has asked you to help
her analyze data from the results of patient systolic blood
pressure readings. You decide to compute the mean systolic
pressure to see where the patient results cluster.
Central Tendency Spread Symmetry
Problem #3
Question: The director of a health clinic has asked you to help
her analyze data from the results of patient systolic blood
pressure readings. You decide to compute the mean systolic
pressure to see where the patient results cluster.
Central Tendency Spread Symmetry
Tells you about where the data are clustering or centering.
Look for words like, average, mean, median, most common, center point etc.
Problem #3
Question: The director of a health clinic has asked you to help
her analyze data from the results of patient systolic blood
pressure readings. You decide to compute the mean systolic
pressure to see where the patient results cluster.
Central Tendency Spread Symmetry
Tells you about where the data are clustering or centering
Look for words like, average, mean, median, most common, center point etc.
Problem #4
Question: An entrance exam for mechanical engineers is very
difficult. If it is very difficult you would expect most of the scores
to bunched up on the lower end of the score distribution with a
few high scores. What is the shape of this distribution?
Problem #4
Question: An entrance exam for mechanical engineers is very
difficult. If it is very difficult you would expect most of the scores
to bunched up on the lower end of the score distribution with a
few high scores. What is the shape of this distribution?
Instructions: Which type of description of the distribution
(below) is most relevant to the question (above)?
Central Tendency Spread Symmetry
Problem #4
Question: An entrance exam for mechanical engineers is very
difficult. If it is very difficult you would expect most of the scores
to bunched up on the lower end of the score distribution with a
few high scores. What is the shape of this distribution?
Central Tendency Spread Symmetry
Problem #4
Question: An entrance exam for mechanical engineers is very
difficult. If it is very difficult you would expect most of the scores
to bunched up on the lower end of the score distribution with a
few high scores. What is the shape of this distribution?
Tells you about the shape of the distribution.
Look for words like shape or expressions like
• Most of the data in the center.
• A few data points to the left or right.
• All data evenly distributed.
• Shape of the distribution is very peaked.
Central Tendency Spread Symmetry
Problem #4
Question: An entrance exam for mechanical engineers is very
difficult. If it is very difficult you would expect most of the scores
to bunched up on the lower end of the score distribution with a
few high scores. What is the shape of this distribution?
Central Tendency Spread Symmetry
Tells you about the shape of the distribution.
Look for words like shape or expressions like
• Most of the data in the center.
• A few data points to the left or right.
• All data evenly distributed.
• Shape of the distribution is very peaked.
What category of method is appropriate for the
research question? Methods dealing with …
Central Tendency? Spread? Symmetry?

More Related Content

What's hot

Quick reminder is this a central tendency - spread - symmetry question
Quick reminder   is this a central tendency - spread - symmetry questionQuick reminder   is this a central tendency - spread - symmetry question
Quick reminder is this a central tendency - spread - symmetry questionKen Plummer
 
Bmgt 311 chapter_12
Bmgt 311 chapter_12Bmgt 311 chapter_12
Bmgt 311 chapter_12Chris Lovett
 
2 statistics, measurement, graphical techniques
2 statistics, measurement, graphical techniques2 statistics, measurement, graphical techniques
2 statistics, measurement, graphical techniquesPenny Jiang
 
Visualiation of quantitative information
Visualiation of quantitative informationVisualiation of quantitative information
Visualiation of quantitative informationJames Neill
 
Measure of Central Tendency
Measure of Central TendencyMeasure of Central Tendency
Measure of Central TendencyAurus Network
 
Research Method for Business chapter 12
Research Method for Business chapter 12Research Method for Business chapter 12
Research Method for Business chapter 12Mazhar Poohlah
 
Measure of Central Tendency
Measure of Central TendencyMeasure of Central Tendency
Measure of Central TendencySharmin_Abeer
 
Central Tendency and types
Central Tendency and typesCentral Tendency and types
Central Tendency and typesArRaja4
 
Stat11t alq chapter03
Stat11t alq chapter03Stat11t alq chapter03
Stat11t alq chapter03raylenepotter
 
Applied statistics lecture 1
Applied statistics lecture 1Applied statistics lecture 1
Applied statistics lecture 1Daria Bogdanova
 
Measure of central tendency(0039)
Measure of central tendency(0039)Measure of central tendency(0039)
Measure of central tendency(0039)Irfan Hussain
 
Writing the results section for scientific publication
Writing the results section for scientific publicationWriting the results section for scientific publication
Writing the results section for scientific publicationAshok Pandey
 

What's hot (16)

Stat11t chapter1
Stat11t chapter1Stat11t chapter1
Stat11t chapter1
 
Quick reminder is this a central tendency - spread - symmetry question
Quick reminder   is this a central tendency - spread - symmetry questionQuick reminder   is this a central tendency - spread - symmetry question
Quick reminder is this a central tendency - spread - symmetry question
 
Bmgt 311 chapter_12
Bmgt 311 chapter_12Bmgt 311 chapter_12
Bmgt 311 chapter_12
 
2 statistics, measurement, graphical techniques
2 statistics, measurement, graphical techniques2 statistics, measurement, graphical techniques
2 statistics, measurement, graphical techniques
 
Visualiation of quantitative information
Visualiation of quantitative informationVisualiation of quantitative information
Visualiation of quantitative information
 
Stat11t chapter3
Stat11t chapter3Stat11t chapter3
Stat11t chapter3
 
Central tendency
Central tendency Central tendency
Central tendency
 
Measure of Central Tendency
Measure of Central TendencyMeasure of Central Tendency
Measure of Central Tendency
 
Research Method for Business chapter 12
Research Method for Business chapter 12Research Method for Business chapter 12
Research Method for Business chapter 12
 
Measure of Central Tendency
Measure of Central TendencyMeasure of Central Tendency
Measure of Central Tendency
 
Central Tendency and types
Central Tendency and typesCentral Tendency and types
Central Tendency and types
 
Stat11t alq chapter03
Stat11t alq chapter03Stat11t alq chapter03
Stat11t alq chapter03
 
1 introduction
1 introduction1 introduction
1 introduction
 
Applied statistics lecture 1
Applied statistics lecture 1Applied statistics lecture 1
Applied statistics lecture 1
 
Measure of central tendency(0039)
Measure of central tendency(0039)Measure of central tendency(0039)
Measure of central tendency(0039)
 
Writing the results section for scientific publication
Writing the results section for scientific publicationWriting the results section for scientific publication
Writing the results section for scientific publication
 

Similar to Central spread - symmetry (jejit + indepth)

Distribution practice
Distribution   practiceDistribution   practice
Distribution practiceKen Plummer
 
Normal or skewed distributions (descriptive both2)
Normal or skewed distributions (descriptive both2)Normal or skewed distributions (descriptive both2)
Normal or skewed distributions (descriptive both2)Ken Plummer
 
Normal or skewed distributions (descriptive both2) - Copyright updated
Normal or skewed distributions (descriptive both2) - Copyright updatedNormal or skewed distributions (descriptive both2) - Copyright updated
Normal or skewed distributions (descriptive both2) - Copyright updatedKen Plummer
 
Descriptive_statistics - Sample 1.pptx
Descriptive_statistics - Sample 1.pptxDescriptive_statistics - Sample 1.pptx
Descriptive_statistics - Sample 1.pptxSachinKumar524686
 
Survey Methodology and Questionnaire Design Theory Part I
Survey Methodology and Questionnaire Design Theory Part ISurvey Methodology and Questionnaire Design Theory Part I
Survey Methodology and Questionnaire Design Theory Part IQualtrics
 
Basic Statistical Concepts in Machine Learning.pptx
Basic Statistical Concepts in Machine Learning.pptxBasic Statistical Concepts in Machine Learning.pptx
Basic Statistical Concepts in Machine Learning.pptxbajajrishabh96tech
 
Central tendency spread
Central tendency spreadCentral tendency spread
Central tendency spreadCTLTLA
 
Introduction to Statistics23122223.ppt
Introduction to Statistics23122223.pptIntroduction to Statistics23122223.ppt
Introduction to Statistics23122223.pptpathianithanaidu
 
Introduction to Statistics2312.ppt
Introduction to Statistics2312.pptIntroduction to Statistics2312.ppt
Introduction to Statistics2312.pptpathianithanaidu
 
QUESTION 1Question 1 Describe the purpose of ecumenical servic.docx
QUESTION 1Question 1 Describe the purpose of ecumenical servic.docxQUESTION 1Question 1 Describe the purpose of ecumenical servic.docx
QUESTION 1Question 1 Describe the purpose of ecumenical servic.docxmakdul
 
Statistics 1
Statistics 1Statistics 1
Statistics 1Saed Jama
 
Statistics and permeability engineering reports
Statistics and permeability engineering reportsStatistics and permeability engineering reports
Statistics and permeability engineering reportswwwmostafalaith99
 
statisticsintroductionofbusinessstats.ppt
statisticsintroductionofbusinessstats.pptstatisticsintroductionofbusinessstats.ppt
statisticsintroductionofbusinessstats.pptvoore ajay
 
BUS308 – Week 1 Lecture 2 Describing Data Expected Out.docx
BUS308 – Week 1 Lecture 2 Describing Data Expected Out.docxBUS308 – Week 1 Lecture 2 Describing Data Expected Out.docx
BUS308 – Week 1 Lecture 2 Describing Data Expected Out.docxcurwenmichaela
 
Statistics And Correlation
Statistics And CorrelationStatistics And Correlation
Statistics And Correlationpankaj prabhakar
 
ANALYSIS ANDINTERPRETATION OF DATA Analysis and Interpr.docx
ANALYSIS ANDINTERPRETATION  OF DATA Analysis and Interpr.docxANALYSIS ANDINTERPRETATION  OF DATA Analysis and Interpr.docx
ANALYSIS ANDINTERPRETATION OF DATA Analysis and Interpr.docxcullenrjzsme
 
ststs nw.pptx
ststs nw.pptxststs nw.pptx
ststs nw.pptxMrymNb
 
#06198 Topic PSY 325 Statistics for the Behavioral & Social Scien.docx
#06198 Topic PSY 325 Statistics for the Behavioral & Social Scien.docx#06198 Topic PSY 325 Statistics for the Behavioral & Social Scien.docx
#06198 Topic PSY 325 Statistics for the Behavioral & Social Scien.docxAASTHA76
 

Similar to Central spread - symmetry (jejit + indepth) (20)

Distribution practice
Distribution   practiceDistribution   practice
Distribution practice
 
Normal or skewed distributions (descriptive both2)
Normal or skewed distributions (descriptive both2)Normal or skewed distributions (descriptive both2)
Normal or skewed distributions (descriptive both2)
 
Normal or skewed distributions (descriptive both2) - Copyright updated
Normal or skewed distributions (descriptive both2) - Copyright updatedNormal or skewed distributions (descriptive both2) - Copyright updated
Normal or skewed distributions (descriptive both2) - Copyright updated
 
Statistics four
Statistics fourStatistics four
Statistics four
 
Descriptive_statistics - Sample 1.pptx
Descriptive_statistics - Sample 1.pptxDescriptive_statistics - Sample 1.pptx
Descriptive_statistics - Sample 1.pptx
 
Survey Methodology and Questionnaire Design Theory Part I
Survey Methodology and Questionnaire Design Theory Part ISurvey Methodology and Questionnaire Design Theory Part I
Survey Methodology and Questionnaire Design Theory Part I
 
Basic Statistical Concepts in Machine Learning.pptx
Basic Statistical Concepts in Machine Learning.pptxBasic Statistical Concepts in Machine Learning.pptx
Basic Statistical Concepts in Machine Learning.pptx
 
Central tendency spread
Central tendency spreadCentral tendency spread
Central tendency spread
 
Introduction to Statistics23122223.ppt
Introduction to Statistics23122223.pptIntroduction to Statistics23122223.ppt
Introduction to Statistics23122223.ppt
 
Introduction to Statistics2312.ppt
Introduction to Statistics2312.pptIntroduction to Statistics2312.ppt
Introduction to Statistics2312.ppt
 
QUESTION 1Question 1 Describe the purpose of ecumenical servic.docx
QUESTION 1Question 1 Describe the purpose of ecumenical servic.docxQUESTION 1Question 1 Describe the purpose of ecumenical servic.docx
QUESTION 1Question 1 Describe the purpose of ecumenical servic.docx
 
Statistics 1
Statistics 1Statistics 1
Statistics 1
 
Statistics and permeability engineering reports
Statistics and permeability engineering reportsStatistics and permeability engineering reports
Statistics and permeability engineering reports
 
statisticsintroductionofbusinessstats.ppt
statisticsintroductionofbusinessstats.pptstatisticsintroductionofbusinessstats.ppt
statisticsintroductionofbusinessstats.ppt
 
BUS308 – Week 1 Lecture 2 Describing Data Expected Out.docx
BUS308 – Week 1 Lecture 2 Describing Data Expected Out.docxBUS308 – Week 1 Lecture 2 Describing Data Expected Out.docx
BUS308 – Week 1 Lecture 2 Describing Data Expected Out.docx
 
Statistics And Correlation
Statistics And CorrelationStatistics And Correlation
Statistics And Correlation
 
ANALYSIS ANDINTERPRETATION OF DATA Analysis and Interpr.docx
ANALYSIS ANDINTERPRETATION  OF DATA Analysis and Interpr.docxANALYSIS ANDINTERPRETATION  OF DATA Analysis and Interpr.docx
ANALYSIS ANDINTERPRETATION OF DATA Analysis and Interpr.docx
 
ststs nw.pptx
ststs nw.pptxststs nw.pptx
ststs nw.pptx
 
2. basic statistics
2. basic statistics2. basic statistics
2. basic statistics
 
#06198 Topic PSY 325 Statistics for the Behavioral & Social Scien.docx
#06198 Topic PSY 325 Statistics for the Behavioral & Social Scien.docx#06198 Topic PSY 325 Statistics for the Behavioral & Social Scien.docx
#06198 Topic PSY 325 Statistics for the Behavioral & Social Scien.docx
 

More from Ken Plummer

Diff rel gof-fit - jejit - practice (5)
Diff rel gof-fit - jejit - practice (5)Diff rel gof-fit - jejit - practice (5)
Diff rel gof-fit - jejit - practice (5)Ken Plummer
 
Learn About Range - Copyright updated
Learn About Range - Copyright updatedLearn About Range - Copyright updated
Learn About Range - Copyright updatedKen Plummer
 
Inferential vs descriptive tutorial of when to use - Copyright Updated
Inferential vs descriptive tutorial of when to use - Copyright UpdatedInferential vs descriptive tutorial of when to use - Copyright Updated
Inferential vs descriptive tutorial of when to use - Copyright UpdatedKen Plummer
 
Diff rel ind-fit practice - Copyright Updated
Diff rel ind-fit practice - Copyright UpdatedDiff rel ind-fit practice - Copyright Updated
Diff rel ind-fit practice - Copyright UpdatedKen Plummer
 
Normal or skewed distributions (inferential) - Copyright updated
Normal or skewed distributions (inferential) - Copyright updatedNormal or skewed distributions (inferential) - Copyright updated
Normal or skewed distributions (inferential) - Copyright updatedKen Plummer
 
Nature of the data practice - Copyright updated
Nature of the data practice - Copyright updatedNature of the data practice - Copyright updated
Nature of the data practice - Copyright updatedKen Plummer
 
Nature of the data (spread) - Copyright updated
Nature of the data (spread) - Copyright updatedNature of the data (spread) - Copyright updated
Nature of the data (spread) - Copyright updatedKen Plummer
 
Mode practice 1 - Copyright updated
Mode practice 1 - Copyright updatedMode practice 1 - Copyright updated
Mode practice 1 - Copyright updatedKen Plummer
 
Nature of the data (descriptive) - Copyright updated
Nature of the data (descriptive) - Copyright updatedNature of the data (descriptive) - Copyright updated
Nature of the data (descriptive) - Copyright updatedKen Plummer
 
Dichotomous or scaled
Dichotomous or scaledDichotomous or scaled
Dichotomous or scaledKen Plummer
 
Skewed less than 30 (ties)
Skewed less than 30 (ties)Skewed less than 30 (ties)
Skewed less than 30 (ties)Ken Plummer
 
Skewed sample size less than 30
Skewed sample size less than 30Skewed sample size less than 30
Skewed sample size less than 30Ken Plummer
 
Ordinal and nominal
Ordinal and nominalOrdinal and nominal
Ordinal and nominalKen Plummer
 
Relationship covariates
Relationship   covariatesRelationship   covariates
Relationship covariatesKen Plummer
 
Relationship nature of data
Relationship nature of dataRelationship nature of data
Relationship nature of dataKen Plummer
 
Number of variables (predictive)
Number of variables (predictive)Number of variables (predictive)
Number of variables (predictive)Ken Plummer
 
Levels of the iv
Levels of the ivLevels of the iv
Levels of the ivKen Plummer
 
Independent variables (2)
Independent variables (2)Independent variables (2)
Independent variables (2)Ken Plummer
 
Dependent variable je jit - practice
Dependent variable   je jit - practiceDependent variable   je jit - practice
Dependent variable je jit - practiceKen Plummer
 

More from Ken Plummer (20)

Diff rel gof-fit - jejit - practice (5)
Diff rel gof-fit - jejit - practice (5)Diff rel gof-fit - jejit - practice (5)
Diff rel gof-fit - jejit - practice (5)
 
Learn About Range - Copyright updated
Learn About Range - Copyright updatedLearn About Range - Copyright updated
Learn About Range - Copyright updated
 
Inferential vs descriptive tutorial of when to use - Copyright Updated
Inferential vs descriptive tutorial of when to use - Copyright UpdatedInferential vs descriptive tutorial of when to use - Copyright Updated
Inferential vs descriptive tutorial of when to use - Copyright Updated
 
Diff rel ind-fit practice - Copyright Updated
Diff rel ind-fit practice - Copyright UpdatedDiff rel ind-fit practice - Copyright Updated
Diff rel ind-fit practice - Copyright Updated
 
Normal or skewed distributions (inferential) - Copyright updated
Normal or skewed distributions (inferential) - Copyright updatedNormal or skewed distributions (inferential) - Copyright updated
Normal or skewed distributions (inferential) - Copyright updated
 
Nature of the data practice - Copyright updated
Nature of the data practice - Copyright updatedNature of the data practice - Copyright updated
Nature of the data practice - Copyright updated
 
Nature of the data (spread) - Copyright updated
Nature of the data (spread) - Copyright updatedNature of the data (spread) - Copyright updated
Nature of the data (spread) - Copyright updated
 
Mode practice 1 - Copyright updated
Mode practice 1 - Copyright updatedMode practice 1 - Copyright updated
Mode practice 1 - Copyright updated
 
Nature of the data (descriptive) - Copyright updated
Nature of the data (descriptive) - Copyright updatedNature of the data (descriptive) - Copyright updated
Nature of the data (descriptive) - Copyright updated
 
Dichotomous or scaled
Dichotomous or scaledDichotomous or scaled
Dichotomous or scaled
 
Skewed less than 30 (ties)
Skewed less than 30 (ties)Skewed less than 30 (ties)
Skewed less than 30 (ties)
 
Skewed sample size less than 30
Skewed sample size less than 30Skewed sample size less than 30
Skewed sample size less than 30
 
Ordinal (ties)
Ordinal (ties)Ordinal (ties)
Ordinal (ties)
 
Ordinal and nominal
Ordinal and nominalOrdinal and nominal
Ordinal and nominal
 
Relationship covariates
Relationship   covariatesRelationship   covariates
Relationship covariates
 
Relationship nature of data
Relationship nature of dataRelationship nature of data
Relationship nature of data
 
Number of variables (predictive)
Number of variables (predictive)Number of variables (predictive)
Number of variables (predictive)
 
Levels of the iv
Levels of the ivLevels of the iv
Levels of the iv
 
Independent variables (2)
Independent variables (2)Independent variables (2)
Independent variables (2)
 
Dependent variable je jit - practice
Dependent variable   je jit - practiceDependent variable   je jit - practice
Dependent variable je jit - practice
 

Recently uploaded

History Class XII Ch. 3 Kinship, Caste and Class (1).pptx
History Class XII Ch. 3 Kinship, Caste and Class (1).pptxHistory Class XII Ch. 3 Kinship, Caste and Class (1).pptx
History Class XII Ch. 3 Kinship, Caste and Class (1).pptxsocialsciencegdgrohi
 
How to Configure Email Server in Odoo 17
How to Configure Email Server in Odoo 17How to Configure Email Server in Odoo 17
How to Configure Email Server in Odoo 17Celine George
 
Meghan Sutherland In Media Res Media Component
Meghan Sutherland In Media Res Media ComponentMeghan Sutherland In Media Res Media Component
Meghan Sutherland In Media Res Media ComponentInMediaRes1
 
ECONOMIC CONTEXT - LONG FORM TV DRAMA - PPT
ECONOMIC CONTEXT - LONG FORM TV DRAMA - PPTECONOMIC CONTEXT - LONG FORM TV DRAMA - PPT
ECONOMIC CONTEXT - LONG FORM TV DRAMA - PPTiammrhaywood
 
CARE OF CHILD IN INCUBATOR..........pptx
CARE OF CHILD IN INCUBATOR..........pptxCARE OF CHILD IN INCUBATOR..........pptx
CARE OF CHILD IN INCUBATOR..........pptxGaneshChakor2
 
Presiding Officer Training module 2024 lok sabha elections
Presiding Officer Training module 2024 lok sabha electionsPresiding Officer Training module 2024 lok sabha elections
Presiding Officer Training module 2024 lok sabha electionsanshu789521
 
EPANDING THE CONTENT OF AN OUTLINE using notes.pptx
EPANDING THE CONTENT OF AN OUTLINE using notes.pptxEPANDING THE CONTENT OF AN OUTLINE using notes.pptx
EPANDING THE CONTENT OF AN OUTLINE using notes.pptxRaymartEstabillo3
 
Alper Gobel In Media Res Media Component
Alper Gobel In Media Res Media ComponentAlper Gobel In Media Res Media Component
Alper Gobel In Media Res Media ComponentInMediaRes1
 
Enzyme, Pharmaceutical Aids, Miscellaneous Last Part of Chapter no 5th.pdf
Enzyme, Pharmaceutical Aids, Miscellaneous Last Part of Chapter no 5th.pdfEnzyme, Pharmaceutical Aids, Miscellaneous Last Part of Chapter no 5th.pdf
Enzyme, Pharmaceutical Aids, Miscellaneous Last Part of Chapter no 5th.pdfSumit Tiwari
 
Hierarchy of management that covers different levels of management
Hierarchy of management that covers different levels of managementHierarchy of management that covers different levels of management
Hierarchy of management that covers different levels of managementmkooblal
 
ECONOMIC CONTEXT - PAPER 1 Q3: NEWSPAPERS.pptx
ECONOMIC CONTEXT - PAPER 1 Q3: NEWSPAPERS.pptxECONOMIC CONTEXT - PAPER 1 Q3: NEWSPAPERS.pptx
ECONOMIC CONTEXT - PAPER 1 Q3: NEWSPAPERS.pptxiammrhaywood
 
Pharmacognosy Flower 3. Compositae 2023.pdf
Pharmacognosy Flower 3. Compositae 2023.pdfPharmacognosy Flower 3. Compositae 2023.pdf
Pharmacognosy Flower 3. Compositae 2023.pdfMahmoud M. Sallam
 
Employee wellbeing at the workplace.pptx
Employee wellbeing at the workplace.pptxEmployee wellbeing at the workplace.pptx
Employee wellbeing at the workplace.pptxNirmalaLoungPoorunde1
 
POINT- BIOCHEMISTRY SEM 2 ENZYMES UNIT 5.pptx
POINT- BIOCHEMISTRY SEM 2 ENZYMES UNIT 5.pptxPOINT- BIOCHEMISTRY SEM 2 ENZYMES UNIT 5.pptx
POINT- BIOCHEMISTRY SEM 2 ENZYMES UNIT 5.pptxSayali Powar
 
भारत-रोम व्यापार.pptx, Indo-Roman Trade,
भारत-रोम व्यापार.pptx, Indo-Roman Trade,भारत-रोम व्यापार.pptx, Indo-Roman Trade,
भारत-रोम व्यापार.pptx, Indo-Roman Trade,Virag Sontakke
 
Painted Grey Ware.pptx, PGW Culture of India
Painted Grey Ware.pptx, PGW Culture of IndiaPainted Grey Ware.pptx, PGW Culture of India
Painted Grey Ware.pptx, PGW Culture of IndiaVirag Sontakke
 
Crayon Activity Handout For the Crayon A
Crayon Activity Handout For the Crayon ACrayon Activity Handout For the Crayon A
Crayon Activity Handout For the Crayon AUnboundStockton
 
Solving Puzzles Benefits Everyone (English).pptx
Solving Puzzles Benefits Everyone (English).pptxSolving Puzzles Benefits Everyone (English).pptx
Solving Puzzles Benefits Everyone (English).pptxOH TEIK BIN
 

Recently uploaded (20)

History Class XII Ch. 3 Kinship, Caste and Class (1).pptx
History Class XII Ch. 3 Kinship, Caste and Class (1).pptxHistory Class XII Ch. 3 Kinship, Caste and Class (1).pptx
History Class XII Ch. 3 Kinship, Caste and Class (1).pptx
 
How to Configure Email Server in Odoo 17
How to Configure Email Server in Odoo 17How to Configure Email Server in Odoo 17
How to Configure Email Server in Odoo 17
 
Meghan Sutherland In Media Res Media Component
Meghan Sutherland In Media Res Media ComponentMeghan Sutherland In Media Res Media Component
Meghan Sutherland In Media Res Media Component
 
ECONOMIC CONTEXT - LONG FORM TV DRAMA - PPT
ECONOMIC CONTEXT - LONG FORM TV DRAMA - PPTECONOMIC CONTEXT - LONG FORM TV DRAMA - PPT
ECONOMIC CONTEXT - LONG FORM TV DRAMA - PPT
 
CARE OF CHILD IN INCUBATOR..........pptx
CARE OF CHILD IN INCUBATOR..........pptxCARE OF CHILD IN INCUBATOR..........pptx
CARE OF CHILD IN INCUBATOR..........pptx
 
Presiding Officer Training module 2024 lok sabha elections
Presiding Officer Training module 2024 lok sabha electionsPresiding Officer Training module 2024 lok sabha elections
Presiding Officer Training module 2024 lok sabha elections
 
EPANDING THE CONTENT OF AN OUTLINE using notes.pptx
EPANDING THE CONTENT OF AN OUTLINE using notes.pptxEPANDING THE CONTENT OF AN OUTLINE using notes.pptx
EPANDING THE CONTENT OF AN OUTLINE using notes.pptx
 
Alper Gobel In Media Res Media Component
Alper Gobel In Media Res Media ComponentAlper Gobel In Media Res Media Component
Alper Gobel In Media Res Media Component
 
Enzyme, Pharmaceutical Aids, Miscellaneous Last Part of Chapter no 5th.pdf
Enzyme, Pharmaceutical Aids, Miscellaneous Last Part of Chapter no 5th.pdfEnzyme, Pharmaceutical Aids, Miscellaneous Last Part of Chapter no 5th.pdf
Enzyme, Pharmaceutical Aids, Miscellaneous Last Part of Chapter no 5th.pdf
 
Hierarchy of management that covers different levels of management
Hierarchy of management that covers different levels of managementHierarchy of management that covers different levels of management
Hierarchy of management that covers different levels of management
 
ECONOMIC CONTEXT - PAPER 1 Q3: NEWSPAPERS.pptx
ECONOMIC CONTEXT - PAPER 1 Q3: NEWSPAPERS.pptxECONOMIC CONTEXT - PAPER 1 Q3: NEWSPAPERS.pptx
ECONOMIC CONTEXT - PAPER 1 Q3: NEWSPAPERS.pptx
 
Model Call Girl in Bikash Puri Delhi reach out to us at 🔝9953056974🔝
Model Call Girl in Bikash Puri  Delhi reach out to us at 🔝9953056974🔝Model Call Girl in Bikash Puri  Delhi reach out to us at 🔝9953056974🔝
Model Call Girl in Bikash Puri Delhi reach out to us at 🔝9953056974🔝
 
Pharmacognosy Flower 3. Compositae 2023.pdf
Pharmacognosy Flower 3. Compositae 2023.pdfPharmacognosy Flower 3. Compositae 2023.pdf
Pharmacognosy Flower 3. Compositae 2023.pdf
 
TataKelola dan KamSiber Kecerdasan Buatan v022.pdf
TataKelola dan KamSiber Kecerdasan Buatan v022.pdfTataKelola dan KamSiber Kecerdasan Buatan v022.pdf
TataKelola dan KamSiber Kecerdasan Buatan v022.pdf
 
Employee wellbeing at the workplace.pptx
Employee wellbeing at the workplace.pptxEmployee wellbeing at the workplace.pptx
Employee wellbeing at the workplace.pptx
 
POINT- BIOCHEMISTRY SEM 2 ENZYMES UNIT 5.pptx
POINT- BIOCHEMISTRY SEM 2 ENZYMES UNIT 5.pptxPOINT- BIOCHEMISTRY SEM 2 ENZYMES UNIT 5.pptx
POINT- BIOCHEMISTRY SEM 2 ENZYMES UNIT 5.pptx
 
भारत-रोम व्यापार.pptx, Indo-Roman Trade,
भारत-रोम व्यापार.pptx, Indo-Roman Trade,भारत-रोम व्यापार.pptx, Indo-Roman Trade,
भारत-रोम व्यापार.pptx, Indo-Roman Trade,
 
Painted Grey Ware.pptx, PGW Culture of India
Painted Grey Ware.pptx, PGW Culture of IndiaPainted Grey Ware.pptx, PGW Culture of India
Painted Grey Ware.pptx, PGW Culture of India
 
Crayon Activity Handout For the Crayon A
Crayon Activity Handout For the Crayon ACrayon Activity Handout For the Crayon A
Crayon Activity Handout For the Crayon A
 
Solving Puzzles Benefits Everyone (English).pptx
Solving Puzzles Benefits Everyone (English).pptxSolving Puzzles Benefits Everyone (English).pptx
Solving Puzzles Benefits Everyone (English).pptx
 

Central spread - symmetry (jejit + indepth)

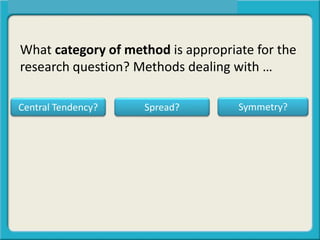
  • 1. What category of method is appropriate for the research question? Methods dealing with … Central Tendency? Spread? Symmetry?
  • 2. Central Tendency Tells you about where the data are clustering or centered in the distribution (e.g., average, center, middle). Spread Tells you about how spread out the data are from the middle. (e.g., spread, difference, deviation, range, variation, vary etc.) Symmetry Tells you about the shape of the distribution.
  • 3. Note – if before going on you would like to brush up on what a distribution is – click the link below: Link to instruction on distributions Return to this slide when you are done.
  • 4. Central Tendency Central Tendency, Spread, or Distribution Shape?
  • 5. Central Tendency Central Tendency, Spread, or Distribution Shape? Tells you about where the data are clustering or centering. Look for words like, average, mean, median, most common, center point etc. Note – to review what a distribution is go to slide 44 and then return to this slide.
  • 6. Central Tendency Central Tendency, Spread, or Distribution Shape? Tells you about where the data are clustering or centering. Look for words like, average, mean, median, most common, center point etc. Note – to review what a distribution is go to slide 44 and then return to this slide.
  • 7. Central Tendency Central Tendency, Spread, or Distribution Shape? Tells you about where the data are clustering or centering. Look for words like, average, mean, median, most common, center point etc. Examples: What is the average test score? What is the most frequent score? What is the median income?
  • 8. Central Tendency, Spread, or Distribution Shape? Spread
  • 9. Central Tendency, Spread, or Distribution Shape? Spread Tells you about how spread out the data are from one another. Look for words like spread, difference, deviation, range, variation, vary, etc.
  • 10. Central Tendency, Spread, or Distribution Shape? Examples: How spread out are the test results? How much does income vary in community X? What is the difference between the highest and lowest scores? Spread Tells you about how spread out the data are from one another. Look for words like spread, difference, deviation, range, variation, vary, etc.
  • 11. Central Tendency, Spread, or Distribution Shape? Symmetry
  • 12. Central Tendency, Spread, or Distribution Shape? Symmetry Tells you about the shape of the distribution. Look for words like shape or expressions like • Most of the data in the center. • A few data points to the left or right. • All data evenly distributed. • Shape of the distribution is very peaked.
  • 13. Central Tendency, Spread, or Distribution Shape? Example: Are the lab results mostly on the high or low end? Symmetry Tells you about the shape of the distribution. Look for words like shape or expressions like • Most of the data in the center. • A few data points to the left or right. • All data evenly distributed. • Shape of the distribution is very peaked.
  • 14. Important Note Every data set has central tendency, spread, and symmetry. Student Test Score Anne 35 Bob 31 Carla 43 Daniel 29 Eva 30
  • 15. Important Note Every data set has central tendency, spread, and symmetry. Student Test Score Anne 35 Bob 31 Carla 43 Daniel 29 Eva 30 In the practices that follow, you will be directed to focus on one of these at a time.
  • 17. Central Tendency Tells you about where the data are clustering or centered in the distribution (e.g., average, center, middle). Spread Tells you about how spread out the data are from the middle. (e.g., spread, difference, deviation, range, variation, vary etc.) Symmetry Tells you about the shape of the distribution.
  • 19. Problem #1 Question: What is the average number of cyberbullying incidents among freshmen, sophomores, juniors, and seniors?
  • 20. Problem #1 Question: What is the average number of cyberbullying incidents among freshmen, sophomores, juniors, and seniors? Instructions: Which type of description of the distribution (below) is most relevant to the question (above)? Central Tendency Spread Symmetry
  • 21. Problem #1 Question: What is the average number of cyberbullying incidents among freshmen, sophomores, juniors, and seniors? Central Tendency Spread Symmetry
  • 22. Problem #1 Question: What is the average number of cyberbullying incidents among freshmen, sophomores, juniors, and seniors? Central Tendency Spread Symmetry Tells you about where the data are clustering or centering. Look for words like, average, mean, median, most common, center point etc.
  • 23. Problem #1 Question: What is the average number of cyberbullying incidents among freshmen, sophomores, juniors, and seniors? Central Tendency Spread Symmetry Tells you about where the data are clustering or centering. Look for words like, average, mean, median, most common, center point etc.
  • 24. Problem #2 Question: What is the difference between the lowest and highest score on a survey designed to test the impact of a new therapy?
  • 25. Problem #2 Question: What is the difference between the lowest and highest score on a survey designed to test the impact of a new therapy? Instructions: Which type of description of the distribution (below) is most relevant to the question (above)? Central Tendency Spread Symmetry
  • 26. Problem #2 Question: What is the difference between the lowest and highest score on a survey designed to test the impact of a new therapy? Central Tendency Spread Symmetry
  • 27. Problem #2 Question: What is the difference between the lowest and highest score on a survey designed to test the impact of a new therapy? Central Tendency Spread Symmetry Tells you about how spread out the data are from one another. Look for words like spread, difference, deviation, range, variation, etc.
  • 28. Problem #2 Question: What is the difference between the lowest and highest score on a survey designed to test the impact of a new therapy? Central Tendency Spread Symmetry Tells you about how spread out the data are from one another. Look for words like spread, difference, deviation, range, variation, etc.
  • 29. Problem #3 Question: The director of a health clinic has asked you to help her analyze data from the results of patient systolic blood pressure readings. You decide to compute the mean systolic pressure to see where the patient results cluster.
  • 30. Problem #3 Question: The director of a health clinic has asked you to help her analyze data from the results of patient systolic blood pressure readings. You decide to compute the mean systolic pressure to see where the patient results cluster. Instructions: Which type of description of the distribution (below) is most relevant to the question (above)? Central Tendency Spread Symmetry
  • 31. Problem #3 Question: The director of a health clinic has asked you to help her analyze data from the results of patient systolic blood pressure readings. You decide to compute the mean systolic pressure to see where the patient results cluster. Central Tendency Spread Symmetry
  • 32. Problem #3 Question: The director of a health clinic has asked you to help her analyze data from the results of patient systolic blood pressure readings. You decide to compute the mean systolic pressure to see where the patient results cluster. Central Tendency Spread Symmetry Tells you about where the data are clustering or centering. Look for words like, average, mean, median, most common, center point etc.
  • 33. Problem #3 Question: The director of a health clinic has asked you to help her analyze data from the results of patient systolic blood pressure readings. You decide to compute the mean systolic pressure to see where the patient results cluster. Central Tendency Spread Symmetry Tells you about where the data are clustering or centering Look for words like, average, mean, median, most common, center point etc.
  • 34. Problem #4 Question: An entrance exam for mechanical engineers is very difficult. If it is very difficult you would expect most of the scores to bunched up on the lower end of the score distribution with a few high scores. What is the shape of this distribution?
  • 35. Problem #4 Question: An entrance exam for mechanical engineers is very difficult. If it is very difficult you would expect most of the scores to bunched up on the lower end of the score distribution with a few high scores. What is the shape of this distribution? Instructions: Which type of description of the distribution (below) is most relevant to the question (above)? Central Tendency Spread Symmetry
  • 36. Problem #4 Question: An entrance exam for mechanical engineers is very difficult. If it is very difficult you would expect most of the scores to bunched up on the lower end of the score distribution with a few high scores. What is the shape of this distribution? Central Tendency Spread Symmetry
  • 37. Problem #4 Question: An entrance exam for mechanical engineers is very difficult. If it is very difficult you would expect most of the scores to bunched up on the lower end of the score distribution with a few high scores. What is the shape of this distribution? Tells you about the shape of the distribution. Look for words like shape or expressions like • Most of the data in the center. • A few data points to the left or right. • All data evenly distributed. • Shape of the distribution is very peaked. Central Tendency Spread Symmetry
  • 38. Problem #4 Question: An entrance exam for mechanical engineers is very difficult. If it is very difficult you would expect most of the scores to bunched up on the lower end of the score distribution with a few high scores. What is the shape of this distribution? Central Tendency Spread Symmetry Tells you about the shape of the distribution. Look for words like shape or expressions like • Most of the data in the center. • A few data points to the left or right. • All data evenly distributed. • Shape of the distribution is very peaked.
  • 39. What category of method is appropriate for the research question? Methods dealing with … Central Tendency? Spread? Symmetry?

Editor's Notes

  1. Symmetry has to do with he shape of a distribution When the distribution is symmetrical it has most of the values in the middle with equally decreasing values to the left and right of the distribution (as shown to the left). A distribution is asymmetrical when it does not follow this pattern (see the bottom two images to the left). You normally will not be asked to assess skew directly but it is an important step in determining the type of spread or central tendency statistics you will run.
  2. Symmetry has to do with he shape of a distribution When the distribution is symmetrical it has most of the values in the middle with equally decreasing values to the left and right of the distribution (as shown to the left). A distribution is asymmetrical when it does not follow this pattern (see the bottom two images to the left). You normally will not be asked to assess skew directly but it is an important step in determining the type of spread or central tendency statistics you will run.
  3. Symmetry has to do with he shape of a distribution When the distribution is symmetrical it has most of the values in the middle with equally decreasing values to the left and right of the distribution (as shown to the left). A distribution is asymmetrical when it does not follow this pattern (see the bottom two images to the left). You normally will not be asked to assess skew directly but it is an important step in determining the type of spread or central tendency statistics you will run.
  4. Symmetry has to do with he shape of a distribution When the distribution is symmetrical it has most of the values in the middle with equally decreasing values to the left and right of the distribution (as shown to the left). A distribution is asymmetrical when it does not follow this pattern (see the bottom two images to the left). You normally will not be asked to assess skew directly but it is an important step in determining the type of spread or central tendency statistics you will run.
  5. Symmetry has to do with he shape of a distribution When the distribution is symmetrical it has most of the values in the middle with equally decreasing values to the left and right of the distribution (as shown to the left). A distribution is asymmetrical when it does not follow this pattern (see the bottom two images to the left). You normally will not be asked to assess skew directly but it is an important step in determining the type of spread or central tendency statistics you will run.
  6. Symmetry has to do with he shape of a distribution When the distribution is symmetrical it has most of the values in the middle with equally decreasing values to the left and right of the distribution (as shown to the left). A distribution is asymmetrical when it does not follow this pattern (see the bottom two images to the left). You normally will not be asked to assess skew directly but it is an important step in determining the type of spread or central tendency statistics you will run.
  7. Symmetry has to do with he shape of a distribution When the distribution is symmetrical it has most of the values in the middle with equally decreasing values to the left and right of the distribution (as shown to the left). A distribution is asymmetrical when it does not follow this pattern (see the bottom two images to the left). You normally will not be asked to assess skew directly but it is an important step in determining the type of spread or central tendency statistics you will run.
  8. Symmetry has to do with he shape of a distribution When the distribution is symmetrical it has most of the values in the middle with equally decreasing values to the left and right of the distribution (as shown to the left). A distribution is asymmetrical when it does not follow this pattern (see the bottom two images to the left). You normally will not be asked to assess skew directly but it is an important step in determining the type of spread or central tendency statistics you will run.
  9. Symmetry has to do with he shape of a distribution When the distribution is symmetrical it has most of the values in the middle with equally decreasing values to the left and right of the distribution (as shown to the left). A distribution is asymmetrical when it does not follow this pattern (see the bottom two images to the left). You normally will not be asked to assess skew directly but it is an important step in determining the type of spread or central tendency statistics you will run.
  10. Symmetry has to do with he shape of a distribution When the distribution is symmetrical it has most of the values in the middle with equally decreasing values to the left and right of the distribution (as shown to the left). A distribution is asymmetrical when it does not follow this pattern (see the bottom two images to the left). You normally will not be asked to assess skew directly but it is an important step in determining the type of spread or central tendency statistics you will run.