1. Displacement Diagram
A displacement diagram is a graph showing displacement of the follower plotted as a function of time.
Degrees of cam rotation are plotted along the horizontal axis, and the length of the diagram represents one revolution of the
cam.
Since the cam speed (in rpm) is constant, equal angular division also represent equal time increments.
Displacement of the follower is plotted along the vertical axis. The displacement diagram determines the shape of the cam.
Three Common Types of Follower Motion:
(1) Constant acceleration
(2) Simple harmonic
(3) Cycloidal
Constant Acceleration:
Example:
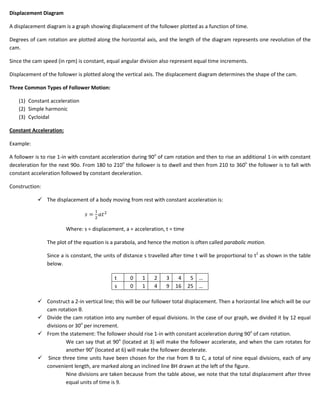
A follower is to rise 1-in with constant acceleration during 90o of cam rotation and then to rise an additional 1-in with constant
deceleration for the next 90o. From 180 to 210o the follower is to dwell and then from 210 to 360o the follower is to fall with
constant acceleration followed by constant deceleration.
Construction:
The displacement of a body moving from rest with constant acceleration is:
#
J I $
$
Where: s = displacement, a = acceleration, t = time
The plot of the equation is a parabola, and hence the motion is often called parabolic motion.
Since a is constant, the units of distance s travelled after time t will be proportional to t2 as shown in the table
below.
t 0 1 2 3 4 5 …
s 0 1 4 9 16 25 …
Construct a 2-in vertical line; this will be our follower total displacement. Then a horizontal line which will be our
cam rotation θ.
Divide the cam rotation into any number of equal divisions. In the case of our graph, we divided it by 12 equal
divisions or 30o per increment.
From the statement: The follower should rise 1-in with constant acceleration during 90o of cam rotation.
We can say that at 90o (located at 3) will make the follower accelerate, and when the cam rotates for
another 90o (located at 6) will make the follower decelerate.
Since three time units have been chosen for the rise from B to C, a total of nine equal divisions, each of any
convenient length, are marked along an inclined line BH drawn at the left of the figure.
Nine divisions are taken because from the table above, we note that the total displacement after three
equal units of time is 9.
2. From point 9 on the inclined line, a line is drawn to the end of the 1-in rise on the displacement axis. Points 4
and 1 are located on the displacement axis by drawing lines parallel to the line 9J. The displacements 1, 4 and 9
are projected horizontally to obtain the points on the curve BC.
Since the decelerated motion C to D is just the reverse of the motion B to C, the ordinate 0, 1, 2 and 3 along the
cam rotation axis can be laid off downward from the top of the diagram to obtain C to D.
We now move on with the statement: from 210 to 360o the follower is to fall with constant acceleration
followed by constant deceleration.
The fall of the follower EG requires that an equal number of divisions be taken along the horizontal axis. Ten
were chosen.
For the five intervals chosen for the acceleration E to F, we see from the table above that a total displacement of
25 equal units is indicated. Hence, along an inclined line from E, 25 equal units of any convenient length are laid
off. These are then transferred to the vertical line E.
Next, the vertical displacements are projected horizontally to obtain the points on the E to F portion of the
graph.
The deceleration from F to G is the reverse from E to F.
D E
9, H
C
2.00 J F
1.00 4
1
B G
0 1 2 3 4 5 6 7 8 9 10 11 12
0 90o I 180o 210o 360o
Cam Rotation
In analysis of cam motions it is convenient to express displacement velocity, and acceleration of the follower in terms of cam
rotation θ instead of time, t.
For θ ≥ 0.5β:
$
J I F
$
I . $
$