SlideShare a Scribd company logo
1 of 65
Tabular and Graphical Presentations
Statistics (exercises)
Aleksandra Pawłowska
April 7, 2020
Glossary (part 1)
Categorical data Labels or names used to identify categories of
like items.
Quantitative data Numerical values that indicate how much or
how many.
Frequency distribution A tabular summary of data showing the
number (fre-
quency) of data values in each of several nonoverlapping
classes.
Relative frequency distribution A tabular summary of data
showing the fraction
or proportion of data values in each of several nonoverlapping
classes.
Percent frequency distribution A tabular summary of data
showing the percent-
age of data values in each of several nonoverlapping classes.
Bar chart A graphical device for depicting qualitative data that
have been sum-
marized in a frequency, relative frequency, or percent frequency
distribution.
Pie chart A graphical device for presenting data summaries
based on subdivision
of a circle into sectors that correspond to the relative frequency
for each class.
Dot plot A graphical device that summarizes data by the number
of dots above
each data value on the horizontal axis.
Aleksandra Pawłowska Tabular and Graphical Presentations
Glossary (part 2)
Histogram A graphical presentation of a frequency distribution,
relative frequency
distribution, or percent frequency distribution of quantitative
data constructed
by placing the class intervals on the horizontal axis and the
frequencies, relative
frequencies, or percent frequencies on the vertical axis.
Cumulative frequency distribution A tabular summary of
quantitative data show-
ing the number of data values that are less than or equal to the
upper class limit
of each class.
Cumulative relative frequency distribution A tabular summary
of quantitative
data showing the fraction or proportion of data values that are
less than or equal
to the upper class limit of each class.
Cumulative percent frequency distribution A tabular summary
of quantitative
data showing the percentage of data values that are less than or
equal to the
upper class limit of each class.
Ogive A graph of a cumulative distribution.
Scatter diagram A graphical presentation of the relationship
between two quan-
titative variables. One variable is shown on the horizontal axis
and the other
variable is shown on the vertical axis.
Trendline A line that provides an approximation of the
relationship between two
variables.
Aleksandra Pawłowska Tabular and Graphical Presentations
Useful tips (part 1)
1 Often the number of classes in a frequency distribution is the
same as the
number of categories found in the data. Most statisticians
recommend
that classes with smaller frequencies be grouped into an
aggregate class
called „other”. Classes with frequencies of 5% or less would
most often be
treated in this fashion.
2 The sum of the frequencies in any frequency distribution
always equals
the number of observations. The sum of the relative frequencies
in any
relative frequency distribution always equals 1.00, and the sum
of the
percentages in a percent frequency distribution always equals
100.
Aleksandra Pawłowska Tabular and Graphical Presentations
Useful tips (part 2)
1 A bar chart and a histogram are essentially the same thing;
both are
graphical presentations of the data in a frequency distribution.
A
histogram is just a bar chart with no separation between bars.
For some
discrete quantitative data, a separation between bars is also
appropriate.
2 The last entry in a cumulative frequency distribution always
equals the
total number of observations. The last entry in a cumulative
relative
frequency distribution always equals 1.00 and the last entry in a
cumulative percent frequency distribution always equals 100.
Aleksandra Pawłowska Tabular and Graphical Presentations
Exercises
Task 1
The response to a question has three alternatives: A, B, and C.
A
sample of 120 responses provides 60 A, 24 B, and 36 C. Show
the
frequency and relative frequency distributions.
Aleksandra Pawłowska Tabular and Graphical Presentations
Task 1 – solution
frequency distribution relative frequency distribution
A 60 0.5
B 24 0.2
C 36 0.3
Total 120 1.00
Aleksandra Pawłowska Tabular and Graphical Presentations
Task 2
A questionnaire provides 58 Yes, 42 No, and 20 no-opinion
answers.
1 In the construction of a pie chart, how many degrees would be
in the section of the pie showing the Yes answers?
2 How many degrees would be in the section of the pie showing
the No answers?
3 Construct a pie chart.
4 Construct a bar chart.
Aleksandra Pawłowska Tabular and Graphical Presentations
Task 2 – solution
1 In the construction of a pie chart, how many degrees would be
in the
section of the pie showing the Yes answers? 174
2 How many degrees would be in the section of the pie showing
the No
answers? 126
3 Construct a pie chart.
4 Construct a bar chart.
Aleksandra Pawłowska Tabular and Graphical Presentations
Task 3
Consider the following frequency distribution.
Construct a cumulative frequency distribution and a cumulative
relative frequency distribution.
Aleksandra Pawłowska Tabular and Graphical Presentations
Task 3 – solution
Aleksandra Pawłowska Tabular and Graphical Presentations
Task 4
A doctor’s office staff studied the waiting times for patients
who ar-
rive at the office with a request for emergency service. The
following
data with waiting times in minutes were collected over a one-
month
period.
Use classes of 0–4, 5–9, and so on in the following:
1 Show the frequency distribution.
2 Show the relative frequency distribution.
3 Show the cumulative frequency distribution.
4 Show the cumulative relative frequency distribution.
5 What proportion of patients needing emergency service wait 9
minutes or less?
Aleksandra Pawłowska Tabular and Graphical Presentations
Task 4 – solution
1 Show the frequency distribution. Show the relative frequency
distribution.
Aleksandra Pawłowska Tabular and Graphical Presentations
Task 4 – solution
1 Show the cumulative frequency distribution. Show the
cumulative relative frequency distribution.
2 What proportion of patients needing emergency service wait 9
minutes or less? 0.6
Aleksandra Pawłowska Tabular and Graphical Presentations
Task 5
The following 20 observations are for two quantitative
variables, x
and y .
1 Develop a scatter diagram for the relationship between x and
y .
2 What is the relationship, if any, between x and y?
Aleksandra Pawłowska Tabular and Graphical Presentations
Task 5 – solution
A negative relationship between x and y ; y decreases as x
increases.
Aleksandra Pawłowska Tabular and Graphical Presentations
Task 6
A partial relative frequency distribution is given.
1 What is the relative frequency of class D?
2 The total sample size is 200. What is the frequency of class
D?
3 Show the frequency distribution.
4 Show the percent frequency distribution.
Aleksandra Pawłowska Tabular and Graphical Presentations
Task 6 – solution
1 What is the relative frequency of class D? 0.20
2 The total sample size is 200. What is the frequency of class
D? 40
3 Show the frequency distribution. Show the percent frequency
distribution.
Aleksandra Pawłowska Tabular and Graphical Presentations
Task 7
Data for a sample of 55 members of the Baseball Hall of Fame
in
Cooperstown, New York, are shown on next slide. Each
observation
indicates the primary position played by the Hall of Famers:
pitcher
(P), catcher (H), 1st base (1), 2nd base (2), 3rd base (3),
shortstop
(S), left field (L), center field (C), and right field (R).
1 Use frequency and relative frequency distributions to
summarize the data.
2 What position provides the most Hall of Famers?
3 What position provides the fewest Hall of Famers?
4 What outfield position (L, C, or R) provides the most Hall of
Famers?
5 Compare infielders (1, 2, 3, and S) to outfielders (L, C, and
R).
Aleksandra Pawłowska Tabular and Graphical Presentations
Task 7 – solution
1 Use frequency and relative frequency distributions to
summarize the data.
2 What position provides the most Hall of Famers? Pitcher
Aleksandra Pawłowska Tabular and Graphical Presentations
Task 7 – solution
1 What position provides the fewest Hall of Famers? 3rd base
2 What outfield position (L, C, or R) provides the most Hall of
Famers? Right field
3 Compare infielders (1, 2, 3, and S) to outfielders (L, C, and
R). Infielders 16 to outfielders 18
Aleksandra Pawłowska Tabular and Graphical Presentations
Measures of Variability
Statistics (exercises)
Aleksandra Pawłowska
May 12, 2020
Glossary
Range A measure of variability, defined to be the largest value
minus
the smallest value.
Interquartile range (IQR) A measure of variability, defined to
be the
difference between the third and first quartiles.
Variance A measure of variability based on the squared
deviations
of the data values about the mean.
Standard deviation A measure of variability computed by taking
the
positive square root of the variance.
Coefficient of variation A measure of relative variability
computed
by dividing the standard deviation by the mean and multiplying
by
100.
Aleksandra Pawłowska Measures of Variability
Task 1
Consider a sample with data values of 10, 20, 12, 17, and 16.
Com-
pute the range and interquartile range.
Aleksandra Pawłowska Measures of Variability
Task 1 – solution
Consider a sample with data values of 10, 20, 12, 17, and 16.
Com-
pute the range and interquartile range. range = 10, IQR = 5
Aleksandra Pawłowska Measures of Variability
Task 2
Consider a sample with data values of 10, 20, 12, 17, and 16.
Com-
pute the variance and standard deviation.
Aleksandra Pawłowska Measures of Variability
Task 2 – solution
Consider a sample with data values of 10, 20, 12, 17, and 16.
Com-
pute the variance and standard deviation. s2 = 16, s = 4
Aleksandra Pawłowska Measures of Variability
Task 3
Consider a sample with data values of 27, 25, 20, 15, 30, 34, 28,
and
25. Compute the range, interquartile range, variance, and
standard
deviation.
Aleksandra Pawłowska Measures of Variability
Task 3 – solution
Consider a sample with data values of 27, 25, 20, 15, 30, 34, 28,
and
25. Compute the range, interquartile range, variance, and
standard
deviation.
range = 19, IQR = 6.5, s2 = 34.57, s = 5.88.
Aleksandra Pawłowska Measures of Variability
Task 4
A bowler’s scores for six games were 182, 168, 184, 190, 170,
and
174. Using these data as a sample, compute the following
descriptive
statistics:
1 Range
2 Variance
3 Standard deviation
4 Coefficient of variation
Aleksandra Pawłowska Measures of Variability
Task 4 – solution
1 Range 22
2 Variance 75.2
3 Standard deviation 8.67
4 Coefficient of variation 4.87%
Aleksandra Pawłowska Measures of Variability
Task 5
A home theater in a box is the easiest and cheapest way to
provide surround sound
for a home entertainment center. A sample of prices is shown
here (Consumer
Reports Buying Guide, 2004). The prices are for models with a
DVD player and
for models without a DVD player.
1 Compute the mean price for models with a DVD player and
the mean
price for models without a DVD player. What is the additional
price paid
to have a DVD player included in a home theater unit?
2 Compute the range, variance, and standard deviation for the
two samples.
What does this information tell you about the prices for models
with and
without a DVD player?
Aleksandra Pawłowska Measures of Variability
Task 5 – solution
1 Compute the mean price for models with a DVD player and
the mean price for models without a DVD player. What is the
additional price paid to have a DVD player included in a home
theater unit? For models with DVD player x̄ = 410 and for
models without DVD player x̄ = 310.
2 Compute the range, variance, and standard deviation for the
two samples. What does this information tell you about the
prices for models with and without a DVD player? For models
with DVD player range = 200, s2 = 5500, s = 74.16 and for
models without DVD player range = 70, s2 = 800, s = 28.28.
Aleksandra Pawłowska Measures of Variability
Task 6
Car rental rates per day for a sample of seven Eastern U.S.
cities are as follows
(The Wall Street Journal, January 16, 2004).
1 Compute the mean, variance, and standard deviation for the
car rental
rates.
2 A similar sample of seven Western U.S. cities showed a
sample mean car
rental rate of $38 per day. The variance and standard deviation
were 12.3
and 3.5, respectively. Discuss any difference between the car
rental rates
in Eastern and Western U.S. cities.
Aleksandra Pawłowska Measures of Variability
Task 6 – solution
1 Compute the mean, variance, and standard deviation for the
car rental rates. x̄ = 38, s2 = 97, s = 9.85.
2 A similar sample of seven Western U.S. cities showed a
sample
mean car rental rate of $38 per day. The variance and
standard deviation were 12.3 and 3.5, respectively. Discuss
any difference between the car rental rates in Eastern and
Western U.S. cities. Eastern shows more variation.
Aleksandra Pawłowska Measures of Variability
Task 7
The Los Angeles Times regularly reports the air quality index
for
various areas of Southern California. A sample of air quality
index
values for Pomona provided the following data: 28, 42, 58, 48,
45,
55, 60, 49, and 50.
1 Compute the range and interquartile range.
2 Compute the sample variance and sample standard deviation.
3 A sample of air quality index readings for Anaheim provided
a
sample mean of 48.5, a sample variance of 136, and a sample
standard deviation of 11.66. What comparisons can you make
between the air quality in Pomona and that in Anaheim on
the basis of these descriptive statistics?
Aleksandra Pawłowska Measures of Variability
Task 7 – solution
1 Compute the range and interquartile range. range = 32, IQR
= 10.
2 Compute the sample variance and sample standard deviation.
s2 = 92.75, s = 9.63.
3 A sample of air quality index readings for Anaheim provided
a
sample mean of 48.5, a sample variance of 136, and a sample
standard deviation of 11.66. What comparisons can you make
between the air quality in Pomona and that in Anaheim on
the basis of these descriptive statistics? Air quality in
Anaheim is, on average, better than in Pomona, but also
shows more variation.
Aleksandra Pawłowska Measures of Variability
Task 8
How do grocery costs compare across the country? Using a
market basket
of 10 items including meat, milk, bread, eggs, coffee, potatoes,
cereal, and
orange juice, Where to Retire magazine calculated the cost of
the market basket
in six cities and in six retirement areas across the country
(Where to Retire,
November/December 2003). The data with market basket cost to
the nearest
dollar are as follows:
1 Compute the mean, variance, and standard deviation for the
sample of
cities and the sample of retirement areas.
2 What observations can be made based on the two samples?
Aleksandra Pawłowska Measures of Variability
Task 8 – solution
1 Compute the mean, variance, and standard deviation for the
sample of cities and the sample of retirement areas. For the
sample of cities: x̄ = 33, s2 = 14.4, s = 3.79 and the sample
of retirement areas: x̄ = 32, s2 = 3.6, s = 1.90.
2 What observations can be made based on the two samples?
Aleksandra Pawłowska Measures of Variability
Task 9
Scores turned in by an amateur golfer at the Bonita Fairways
Golf
Course in Bonita Springs, Florida, during 2005 and 2006 are as
follows:
1 Use the mean and standard deviation to evaluate the golfer’s
performance over the two-year period.
2 What is the primary difference in performance between 2005
and 2006? What improvement, if any, can be seen in the 2006
scores?
Aleksandra Pawłowska Measures of Variability
Task 9 – solution
1 Use the mean and standard deviation to evaluate the golfer’s
performance over the two-year period. In 2005:
x̄ = 76, s = 2.07 and in 2006: x̄ = 76, s = 5.26.
2 What is the primary difference in performance between 2005
and 2006? What improvement, if any, can be seen in the 2006
scores? There was, on average, no improvement in the scores
in season 2006 comparing to the season 2005, but the scores
in 2006 show more variation.
Aleksandra Pawłowska Measures of Variability
Data and Statistics
Statistics (exercises)
Aleksandra Pawłowska
March 31, 2020
Glossary (part 1)
Statistics The art and science of collecting, analyzing,
presenting, and interpret-
ing data.
Data The facts and figures collected, analyzed, and summarized
for presentation
and interpretation.
Data set All the data collected in a particular study.
Elements The entities on which data are collected.
Variable A characteristic of interest for the elements.
Observation The set of measurements obtained for a particular
element.
Nominal scale The scale of measurement for a variable when the
data are labels
or names used to identify an attribute of an element. Nominal
data may be
nonnumeric or numeric.
Ordinal scale The scale of measurement for a variable if the
data exhibit the
properties of nominal data and the order or rank of the data is
meaningful.
Ordinal data may be nonnumeric or numeric.
Interval scale The scale of measurement for a variable if the
data demonstrate
the properties of ordinal data and the interval between values is
expressed in
terms of a fixed unit of measure. Interval data are always
numeric.
Aleksandra Pawłowska Data and Statistics
Glossary (part 2)
Ratio scale The scale of measurement for a variable if the data
demonstrate all
the properties of interval data and the ratio of two values is
meaningful. Ratio
data are always numeric.
Categorical data Labels or names used to identify an attribute of
each element.
Categorical data use either the nominal or ordinal scale of
measurement and may
be nonnumeric or numeric.
Quantitative data Numeric values that indicate how much or
how many of
something. Quantitative data are obtained using either the
interval or ratio scale
of measurement.
Categorical variable A variable with categorical data.
Quantitative variable A variable with quantitative data.
Cross-sectional data Data collected at the same or
approximately the same
point in time.
Time series data Data collected over several time periods.
Descriptive statistics Tabular, graphical, and numerical
summaries of data.
Population The set of all elements of interest in a particular
study.
Sample A subset of the population.
Census A survey to collect data on the entire population.
Sample survey A survey to collect data on a sample.
Statistical inference The process of using data obtained from a
sample to make
estimates or test hypotheses about the characteristics of a
population.
Aleksandra Pawłowska Data and Statistics
Useful tips
1 An observation is the set of measurements obtained for each
element in a data set. Hence, the number of observations is
always the same as the number of elements. The number of
measurements obtained for each element equals the number
of variables. Hence, the total number of data items can be
determined by multiplying the number of observations by the
number of variables.
2 Quantitative data may be discrete or continuous. Quantitative
data that measure how many (e.g. number of calls received in
5 minutes) are discrete. Quantitative data that measure how
much (e.g. weight or time) are continuous because no
separation occurs between the possible data values.
Aleksandra Pawłowska Data and Statistics
Exercises
Aleksandra Pawłowska Data and Statistics
Task 1
The U.S. Department of Energy provides fuel economy
information
for a variety of motor vehicles. A sample of 10 automobiles is
shown
in Table 1.6 (Fuel Economy website, February 22, 2008). Data
show
the size of the automobile (compact, midsize, or large), the
number
of cylinders in the engine, the city driving miles per gallon, the
highway driving miles per gallon, and the recommended fuel
(diesel,
premium, or regular).
1 How many elements are in this data set?
2 How many variables are in this data set?
3 Which variables are categorical and which variables are
quantitative?
4 What type of measurement scale is used for each of the
variables?
Aleksandra Pawłowska Data and Statistics
Task 2
Refer to Table 1.6.
1 What is the average miles per gallon for city driving?
2 On average, how much higher is the miles per gallon for
highway driving as compared to city driving?
3 What percentage of the cars have four-cylinder engines?
4 What percentage of the cars use regular fuel?
Aleksandra Pawłowska Data and Statistics
Task 3
Table 1.7 shows data for seven colleges and universities. The
en-
dowment (in billions of dollars) and the percentage of
applicants
admitted are shown (USA Today, February 3, 2008). The state
each school is located in, the campus setting, and the NCAA Di-
vision for varsity teams were obtained from the National Center
of
Education Statistics website, February 22, 2008.
1 How many elements are in the data set?
2 How many variables are in the data set?
3 Which of the variables are categorical and which are
quantitative?
Aleksandra Pawłowska Data and Statistics
Task 4
Consider the data set in Table 1.7
1 Compute the average endowment for the sample.
2 Compute the average percentage of applicants admitted.
3 What percentage of the schools have NCAA Division III
varsity teams?
4 What percentage of the schools have a City: Midsize campus
setting?
Aleksandra Pawłowska Data and Statistics
Task 5
The FinancialTimes/Harris Poll is a monthly online poll of
adults
from six countries in Europe and the United States. A January
poll
included 1015 adults in the United States. One of the questions
asked was, “How would you rate the Federal Bank in handling
the
credit problems in the financial markets?” Possible responses
were
Excellent, Good, Fair, Bad, and Terrible (Harris Interactive
website,
January 2008).
1 What was the sample size for this survey?
2 Are the data categorical or quantitative?
3 Would it make more sense to use averages or percentages as a
summary of the data for this question?
4 Of the respondents in the United States, 10% said the Federal
Bank is doing a good job. How many individuals provided this
response?
Aleksandra Pawłowska Data and Statistics
Task 6
The Commerce Department reported receiving the following
appli-
cations for the Malcolm Baldrige National Quality Award: 23
from
large manufacturing firms, 18 from large service firms, and 30
from
small businesses.
1 Is type of business a categorical or quantitative variable?
2 What percentage of the applications came from small
businesses?
Aleksandra Pawłowska Data and Statistics
Task 7
State whether each of the following variables is categorical or
quan-
titative and indicate its measurement scale.
1 Annual sales
2 Soft drink size (small, medium, large)
3 Employee classification (GS1 through GS18)
4 Earnings per share
5 Method of payment (cash, check, credit card)
Aleksandra Pawłowska Data and Statistics
Task 8
Figure 1.8 provides a bar chart showing the amount of federal
spend-
ing for the years 2002 to 2008 (USA Today, February 5, 2008).
1 What is the variable of interest?
2 Are the data categorical or quantitative?
3 Are the data time series or cross-sectional?
4 Comment on the trend in federal spending over time.
Aleksandra Pawłowska Data and Statistics
Task 9
The Food and Drug Administration (FDA) reported the number
of
new drugs approved over an eight-year period (The Wall Street
Jour-
nal, January 12, 2004). Figure 1.9 provides a bar chart
summarizing
the number of new drugs approved each year.
1 Are the data categorical or quantitative?
2 Are the data time series or cross-sectional?
3 How many new drugs were approved in 2003?
4 In what year were the fewest new drugs approved? How
many?
5 Comment on the trend in the number of new drugs approved
by the FDA over the eight-year period.
Aleksandra Pawłowska Data and Statistics
Task 10
Asample of midterm grades for five students showed the
following
results: 72, 65, 82, 90, 76. Which of the following statements
are
correct, and which should be challenged as being too
generalized?
1 The average midterm grade for the sample of five students is
77.
2 The average midterm grade for all students who took the
exam is 77.
3 An estimate of the average midterm grade for all students
who took the exam is 77.
4 More than half of the students who take this exam will score
between 70 and 85.
5 If five other students are included in the sample, their grades
will be between 65 and 90.
Aleksandra Pawłowska Data and Statistics
Exploratory Data Analysis
Statistics (exercises)
Aleksandra Pawłowska
May 26, 2020
Glossary
Five-number summary An exploratory data analysis technique
that
uses five numbers to summarize the data: smallest value, first
quar-
tile, median, third quartile, and largest value.
Box plot A graphical summary of data based on a five-number
sum-
mary.
Aleksandra Pawłowska Exploratory Data Analysis
Task 1
Consider a sample with data values of 27, 25, 20, 15, 30, 34, 28,
and 25. Provide the five-number summary for the data.
Aleksandra Pawłowska Exploratory Data Analysis
Task 1 – solution
Consider a sample with data values of 27, 25, 20, 15, 30, 34, 28,
and 25. Provide the five-number summary for the data.
five-number summary: 15, 22.5, 26, 29, 34
Aleksandra Pawłowska Exploratory Data Analysis
Task 2
Show the box plot for the data in task 1 (use excel).
Aleksandra Pawłowska Exploratory Data Analysis
Task 2 – solution
Show the box plot for the data in task 1 (use excel).
Aleksandra Pawłowska Exploratory Data Analysis
Task 3
Show the five-number summary and the box plot for the
following
data: 5, 15, 18, 10, 8, 12, 16, 10, 6.
Aleksandra Pawłowska Exploratory Data Analysis
Task 3 – solution
Show the five-number summary and the box plot for the
following
data: 5, 15, 18, 10, 8, 12, 16, 10, 6.
five-number summary: 5, 8, 10, 15, 18
Aleksandra Pawłowska Exploratory Data Analysis
Task 3 – solution
Aleksandra Pawłowska Exploratory Data Analysis
Task 4
A data set has a first quartile of 42 and a third quartile of 50.
Compute the lower and upper limits for the corresponding box
plot.
Should a data value of 65 be considered an outlier?
Aleksandra Pawłowska Exploratory Data Analysis
Task 4 – solution
A data set has a first quartile of 42 and a third quartile of 50.
Compute the lower and upper limits for the corresponding box
plot.
Should a data value of 65 be considered an outlier?
lower limit = 30,
upper limit = 62,
65 is an outlier
Aleksandra Pawłowska Exploratory Data Analysis
Task 5
Annual sales, in millions of dollars, for 21 pharmaceutical
companies follow.
1 Provide a five-number summary.
2 Compute the lower and upper limits.
3 Do the data contain any outliers?
4 Johnson & Johnson’s sales are the largest on the list at
$14,138 million.
Suppose a data entry error (a transposition) had been made and
the sales
had been entered as $41,138 million. Would the method of
detecting
outliers in part (c) identify this problem and allow for
correction of the
data entry error?
5 Show a box plot (use excel).
Aleksandra Pawłowska Exploratory Data Analysis
Task 5 – solution
1 Provide a five-number summary. 608, 1872, 4019, 8305,
14138
2 Compute the lower and upper limits. lower limit = -7777.5,
upper limit = 17954.5
3 Do the data contain any outliers? Data contain no outliers
4 Johnson & Johnson’s sales are the largest on the list at
$14,138 million. Suppose a data entry error (a transposition)
had been made and the sales had been entered as $41,138
million. Would the method of detecting outliers in part (c)
identify this problem and allow for correction of the data entry
error? Yes, 41138 would be an outlier, data value would be
reviewed and detected
5 Show a box plot. See next slide
Aleksandra Pawłowska Exploratory Data Analysis
Task 5 – solution
Aleksandra Pawłowska Exploratory Data Analysis
Measures of Association Between Two Variables
Statistics (exercises)
Aleksandra Pawłowska
Jun 2, 2020
Glossary
Covariance A measure of linear association between two
variables.
Positive values indicate a positive relationship; negative values
indi-
cate a negative relationship.
Correlation coefficient A measure of linear association between
two
variables that takes on values between -1 and +1. Values near
+1
indicate a strong positive linear relationship; values near -1
indicate
a strong negative linear relationship; and values near zero
indicate
the lack of a linear relationship.
Aleksandra Pawłowska Measures of Association Between Two
Variables
Task 1
Five observations taken for two variables follow.
1 Develop a scatter diagram with x on the horizontal axis (use
excel).
2 What does the scatter diagram developed in part (a) indicate
about the relationship between the two variables?
3 Compute and interpret the sample covariance.
4 Compute and interpret the sample correlation coefficient.
Aleksandra Pawłowska Measures of Association Between Two
Variables
Task 1 – solution
Aleksandra Pawłowska Measures of Association Between Two
Variables
Task 1 – solution
1 What does the scatter diagram developed in part (a) indicate
about the relationship between the two variables? negative
relationship
2 Compute and interpret the sample covariance. -60
3 Compute and interpret the sample correlation coefficient.
-0.97, there is strong negative correlation between x and y
Aleksandra Pawłowska Measures of Association Between Two
Variables
Task 2
Five observations taken for two variables follow.
1 Develop a scatter diagram for these data (use excel).
2 What does the scatter diagram indicate about a relationship
between x and y?
3 Compute and interpret the sample covariance.
4 Compute and interpret the sample correlation coefficient.
Aleksandra Pawłowska Measures of Association Between Two
Variables
Task 2 – solution
Aleksandra Pawłowska Measures of Association Between Two
Variables
Task 2 – solution
1 What does the scatter diagram indicate about a relationship
between x and y? positive relationship
2 Compute and interpret the sample covariance. 26.5, it
suggests positive relationship between x and y
3 Compute and interpret the sample correlation coefficient.
0.69, there is positive (but not strong) linear relationship
between x and y
Aleksandra Pawłowska Measures of Association Between Two
Variables
Task 3
Nielsen Media Research provides two measures of the television
viewing audience:
a television program rating, which is the percentage of
households with televisions
watching a program, and a television program share, which is
the percentage
of households watching a program among those with televisions
in use. The
following data show the Nielsen television ratings and share
data for the Major
League Baseball World Series over a nine-year period
(Associated Press, October
27, 2003).
1 Develop a scatter diagram with rating on the horizontal axis
(use excel).
2 What is the relationship between rating and share? Explain.
3 Compute and interpret the sample covariance.
4 Compute the sample correlation coefficient. What does this
value tell us
about the relationship between rating and share?
Aleksandra Pawłowska Measures of Association Between Two
Variables
Task 3 – solution
Aleksandra Pawłowska Measures of Association Between Two
Variables
Task 3 – solution
1 What is the relationship between rating and share? Explain.
positive relationship
2 Compute and interpret the sample covariance. 10, it suggests
positive relationship
3 Compute the sample correlation coefficient. What does this
value tell us about the relationship between rating and share?
0.99, so that means that there is strong linear positive
relationship between rating and share
Aleksandra Pawłowska Measures of Association Between Two
Variables
Task 4
A department of transportation’s study on driving speed and
miles
per gallon for midsize automobiles resulted in the following
data:
Compute and interpret the sample correlation coefficient.
Aleksandra Pawłowska Measures of Association Between Two
Variables
Task 4 – solution
Compute and interpret the sample correlation coefficient. -0.91,
so
there is strong linear negative relationship between speed and
miles
per gallon
Aleksandra Pawłowska Measures of Association Between Two
Variables
Task 5
The Dow Jones Industrial Average (DJIA) and the Standard &
Poor’s 500 Index
(S&P 500) are both used to measure the performance of the
stock market. The
DJIA is based on the price of stocks for 30 large companies; the
S&P 500 is
based on the price of stocks for 500 companies. If both the
DJIA and S&P 500
measure the performance of the stock market, how are they
correlated? The
following data show the daily percent increase or daily percent
decrease in the
DJIA and S&P 500 for a sample of nine days over a three-month
period (The
Wall Street Journal, January 15 to March 10, 2006).
1 Show a scatter diagram (use excel).
2 Compute the sample correlation coefficient for these data.
3 Discuss the association between the DJIA and S&P 500. Do
you need to
check both before having a general idea about the daily stock
market
performance?
Aleksandra Pawłowska Measures of Association Between Two
Variables
Task 5 – solution
Aleksandra Pawłowska Measures of Association Between Two
Variables
Task 5 – solution
1 Compute the sample correlation coefficient for these data.
0.91
2 Discuss the association between the DJIA and S&P 500. Do
you need to check both before having a general idea about
the daily stock market performance? there is strong positive
linear relationship
Aleksandra Pawłowska Measures of Association Between Two
Variables
The Weighted Mean and Working with Grouped
Data
Statistics (exercises)
Aleksandra Pawłowska
Jun 9, 2020
Glossary
Weighted mean The mean obtained by assigning each
observation
a weight that reflects its importance.
Grouped data Data available in class intervals as summarized by
a
frequency distribution. Individual values of the original data are
not
available.
Aleksandra Pawłowska The Weighted Mean and Working with
Grouped Data
Task 1
Consider the following data and corresponding weights.
1 Compute the weighted mean.
2 Compute the sample mean of the four data values without
weighting. Note the difference in the results provided by the
two computations.
Aleksandra Pawłowska The Weighted Mean and Working with
Grouped Data
Task 1 – solution
1 Compute the weighted mean. 3.69
2 Compute the sample mean of the four data values without
weighting. Note the difference in the results provided by the
two computations. 3.175
Aleksandra Pawłowska The Weighted Mean and Working with
Grouped Data
Task 2
Consider the sample data in the following frequency
distribution.
1 Compute the sample mean.
2 Compute the sample variance and sample standard deviation.
Aleksandra Pawłowska The Weighted Mean and Working with
Grouped Data
Task 2 – solution
1 Compute the sample mean. 13
2 Compute the sample variance and sample standard deviation.
s2 = 25, s = 5
Aleksandra Pawłowska The Weighted Mean and Working with
Grouped Data
Task 3
The grade point average for college students is based on a
weighted
mean computation. For most colleges, the grades are given the
following data values: A (4), B (3), C (2), D (1), and F (0).
After
60 credit hours of course work, a student at State University
earned
9 credit hours of A, 15 credit hours of B, 33 credit hours of C,
and
3 credit hours of D.
1 Compute the student’s grade point average.
2 Students at State University must maintain a 2.5 grade point
average for their first 60 credit hours of course work in order
to be admitted to the business college. Will this student be
admitted?
Aleksandra Pawłowska The Weighted Mean and Working with
Grouped Data
Task 3 – solution
1 Compute the student’s grade point average. 2.5
2 Students at State University must maintain a 2.5 grade point
average for their first 60 credit hours of course work in order
to be admitted to the business college. Will this student be
admitted? Yes, they will
Aleksandra Pawłowska The Weighted Mean and Working with
Grouped Data
Task 4
Morningstar tracks the total return for a large number of mutual
funds. The
following table shows the total return and the number of funds
for four categories
of mutual funds (Morningstar Funds500, 2008).
1 Using the number of funds as weights, compute the weighted
average
total return for the mutual funds covered by Morningstar.
2 Suppose you had invested $10,000 in mutual funds at the
beginning of
2007 and diversified the investment by placing $2000 in
Domestic Equity
funds, $4000 in International Equity funds, $3000 in Specialty
Stock
funds, and $1000 in Hybrid funds. What is the expected return
on the
portfolio?
Aleksandra Pawłowska The Weighted Mean and Working with
Grouped Data
Task 4 – solution
1 Using the number of funds as weights, compute the weighted
average total return for the mutual funds covered by
Morningstar. 7.83
2 Suppose you had invested $10,000 in mutual funds at the
beginning of 2007 and diversified the investment by placing
$2000 in Domestic Equity funds, $4000 in International Equity
funds, $3000 in Specialty Stock funds, and $1000 in Hybrid
funds. What is the expected return on the portfolio? 12.27
Aleksandra Pawłowska The Weighted Mean and Working with
Grouped Data
Task 5
Based on a survey of 425 master’s programs in business
administration, the U.
S. News & World Report ranked the Indiana University Kelley
Business School
as the 20th best business program in the country (America’s
Best Graduate
Schools, 2009). The ranking was based in part on surveys of
business school
deans and corporate recruiters. Each survey respondent was
asked to rate the
overall academic quality of the master’s program on a scale
from 1 „marginal”
to 5 „outstanding”. Use the sample of responses shown below to
compute the
weighted mean score for the business school deans and the
corporate recruiters.
Discuss.
Aleksandra Pawłowska The Weighted Mean and Working with
Grouped Data
Task 5 – solution
x̄ deans = 3.8, x̄ recruiters = 3.7.
Aleksandra Pawłowska The Weighted Mean and Working with
Grouped Data
Index Numbers
Statistics (exercises)
Aleksandra Pawłowska
Jun 16, 2020
Task 1
The median sales prices for new single-family houses for the
years
2004–2007 are as follows (Census Bureau website, March 19,
2009).
1 Use 2004 as the base year and develop a price index for new
single-family homes over this four-year period.
2 Use 2005 as the base year and develop a price index for new
single-family homes over this four-year period.
Aleksandra Pawłowska Index Numbers
Task 1 – solution
1 Use 2004 as the base year and develop a price index for new
single-family homes over this four-year period. 100, 109,
111.5, 112.2
2 Use 2005 as the base year and develop a price index for new
single-family homes over this four-year period. 91.7, 100,
102.3, 102.9
Aleksandra Pawłowska Index Numbers
Task 2
Nickerson Manufacturing Company has the following data on
quan-
tities shipped and unit costs for each of its four products:
1 Compute the price relative for each product.
2 Compute a weighted aggregate price index that reflects the
shipping cost change over the four-year period.
Aleksandra Pawłowska Index Numbers
Task 2 – solution
1 Compute the price relative for each product. 151.4, 196.9,
142.6, 177.5
2 Compute a weighted aggregate price index that reflects the
shipping cost change over the four-year period. 170
Aleksandra Pawłowska Index Numbers
Task 3
Use the price data in task 2 to compute a Paasche index for the
shipping cost if 2009 quantities are 4000, 3000, 7500, and 3000
for
each of the four products.
Aleksandra Pawłowska Index Numbers
Task 3 – solution
Use the price data in task 2 to compute a Paasche index for the
shipping cost if 2009 quantities are 4000, 3000, 7500, and 3000
for
each of the four products. 163.7
Aleksandra Pawłowska Index Numbers
Task 4
Consider the following price relatives and quantity information
for
grain production in Iowa (Census Bureau website, March 19,
2009).
What is the 2007 weighted aggregate price index for the Iowa
grains?
Aleksandra Pawłowska Index Numbers
Task 4 – solution
What is the 2007 weighted aggregate price index for the Iowa
grains?
182.8
Aleksandra Pawłowska Index Numbers
Measures of Location
Statistics (exercises)
Aleksandra Pawłowska
April 28, 2020
Glossary (part 1)
Sample statistic A numerical value used as a summary measure
for
a sample (e.g. the sample mean, x̄ , the sample variance, s2, and
the sample standard deviation, s).
Population parameter A numerical value used as a summary
measure
for a population (e.g. the population mean, µ).
Point estimator The sample statistic, when used to estimate the
corresponding population parameter.
Mean A measure of central location computed by summing the
data
values and dividing by the number of observations.
Aleksandra Pawłowska Measures of Location
Glossary (part 2)
Median A measure of central location provided by the value in
the
middle when the data are arranged in ascending order.
Mode A measure of location, defined as the value that occurs
with
greatest frequency.
Percentile A value such that at least p percent of the
observations
are less than or equal to this value and at least (100− p) percent
of
the observations are greater than or equal to this value. The
50th
percentile is the median.
Quartiles The 25th, 50th, and 75th percentiles, referred to as the
first quartile, the second quartile (median), and third quartile,
re-
spectively. The quartiles can be used to divide a data set into
four
parts, with each part containing approximately 25% of the data.
Aleksandra Pawłowska Measures of Location
Task 1
Consider a sample with data values of 10, 20, 12, 17 and 16.
Com-
pute the mean and median.
Aleksandra Pawłowska Measures of Location
Task 1 – solution
Consider a sample with data values of 10, 20, 12, 17 and 16.
Com-
pute the mean and median. mean = x̄ = 15, median = 16
Aleksandra Pawłowska Measures of Location
Task 2
Consider a sample with data values of 10, 20, 21, 17, 16, and
12.
Compute the mean and median.
Aleksandra Pawłowska Measures of Location
Task 2 – solution
Consider a sample with data values of 10, 20, 21, 17, 16, and
12.
Compute the mean and median. mean = x̄ = 16, median = 16.5
Aleksandra Pawłowska Measures of Location
Task 3
Consider a sample with data values of 27, 25, 20, 15, 30, 34, 28,
and 25. Compute the 20th, 25th, 65th, and 75th percentiles.
Aleksandra Pawłowska Measures of Location
Task 3 – solution
Consider a sample with data values of 27, 25, 20, 15, 30, 34, 28,
and 25. Compute the 20th, 25th, 65th, and 75th percentiles.
20th percentile = 20,
25th percentile = 22.5,
65th percentile = 28,
75th percentile = 29.
Aleksandra Pawłowska Measures of Location
Task 4
Consider a sample with data values of 53, 55, 70, 58, 64, 57, 53,
69, 57, 68, and 53. Compute the mean, median, and mode.
Aleksandra Pawłowska Measures of Location
Task 4 – solution
Consider a sample with data values of 53, 55, 70, 58, 64, 57, 53,
69, 57, 68, and 53. Compute the mean, median, and mode.
mean = x̄ = 59.73, median = 57, mode = 53
Aleksandra Pawłowska Measures of Location
Task 5
The Dow Jones Travel Index reported what business travelers
pay for
hotel rooms per night in major U.S. cities (The Wall Street
Journal,
January 16, 2004). The average hotel room rates for 20 cities
are
presented on the next slide.
1 What is the mean hotel room rate?
2 What is the median hotel room rate?
3 What is the mode?
4 What is the first quartile?
5 What is the third quartile?
Aleksandra Pawłowska Measures of Location
Task 5 – solution
1 What is the mean hotel room rate? 159.05
2 What is the median hotel room rate? 161
3 What is the mode? 167
4 What is the first quartile? 136.5
5 What is the third quartile? 170
Aleksandra Pawłowska Measures of Location
Task 6
During the 2007–2008 NCAA college basketball season, men’s
basketball teams
attempted an all-time high number of 3-point shots, averaging
19.07 shots per
game (Associated Press Sports, January 24, 2009). In an attempt
to discourage
so many 3-point shots and encourage more inside play, the
NCAA rules commit-
tee moved the 3-point line back from 19 feet, 9 inches to 20
feet, 9 inches at the
beginning of the 2008–2009 basketball season. Shown in the
following table are
the 3-point shots taken and the 3-point shots made for a sample
of 19 NCAA
basketball games during the 2008–2009 season (see next slide).
1 What is the mean number of 3-point shots taken per game?
2 What is the mean number of 3-point shots made per game?
3 Using the closer 3-point line, players were making 35.2% of
their shots.
What percentage of shots were players making from the new 3-
point line?
4 What was the impact of the NCAA rules change that moved
the 3-point
line back to 20 feet, 9 inches for the 2008–2009 season? Would
you agree
with the Associated Press Sports article that stated, „Moving
back the
3-point line hasn’t changed the game dramatically”? Explain.
Aleksandra Pawłowska Measures of Location
Task 6 – solution
1 What is the mean number of 3-point shots taken per game?
18.42
2 What is the mean number of 3-point shots made per game?
6.32
3 Using the closer 3-point line, players were making 35.2% of
their shots. What percentage of shots were players making
from the new 3-point line? 34.3%
4 What was the impact of the NCAA rules change that moved
the 3-point line back to 20 feet, 9 inches for the 2008–2009
season? Would you agree with the Associated Press Sports
article that stated, „Moving back the 3-point line hasn’t
changed the game dramatically”? Explain. Yes, agree but not
dramatically. Reductions of only 0.65 shots and 0.9
percentage points for made shots per game
Aleksandra Pawłowska Measures of Location
Task 7
The cost of consumer purchases such as single-family housing,
gasoline, Internet
services, tax preparation, and hospitalization were provided in
The Wall-Street
Journal (January 2, 2007). Sample data typical of the cost of
tax-return prepa-
ration by services such as H&R Block are:
1 Compute the mean, median, and mode.
2 Compute the first and third quartiles.
3 Compute and interpret the 90th percentile.
Aleksandra Pawłowska Measures of Location
Task 7 – solution
1 Compute the mean, median, and mode. mean = 160, median
= 135, mode = 120
2 Compute the first and third quartiles. Q1 = 115, Q3 = 187.5
3 Compute and interpret the 90th percentile. 90th percentile =
245. 90% of the tax returns cost $245 or less.
Aleksandra Pawłowska Measures of Location
Measures of Distribution Shape and Detecting
Outliers
Statistics (exercises)
Aleksandra Pawłowska
May 19, 2020
Glossary
Skewness A measure of the shape of a data distribution. Data
skewed to the
left result in negative skewness; a symmetric data distribution
results in zero
skewness; and data skewed to the right result in positive
skewness.
z-score A value computed by dividing the deviation about the
mean (xi − x̄ ) by
the standard deviation s. A z-score is referred to as a
standardized value and
denotes the number of standard deviations xi is from the mean.
Chebyshev’s theorem A theorem that can be used to make
statements about the
proportion of data values that must be within a specified
number of standard
deviations of the mean.
Empirical rule A rule that can be used to compute the
percentage of data values
that must be within one, two, and three standard deviations of
the mean for
data that exhibit a bell-shaped distribution.
Outlier An unusually small or unusually large data value.
Aleksandra Pawłowska Measures of Distribution Shape and
Detecting Outliers
Task 1
Consider a sample with data values of 10, 20, 12, 17, and 16.
Com-
pute the z-score for each of the five observations.
Aleksandra Pawłowska Measures of Distribution Shape and
Detecting Outliers
Task 1 – solution
Consider a sample with data values of 10, 20, 12, 17, and 16.
Com-
pute the z-score for each of the five observations. z1 = −1.25,
z2 = 1.25, z3 = −0.75, z4 = 0.5, z5 = 0.25
Aleksandra Pawłowska Measures of Distribution Shape and
Detecting Outliers
Task 2
Consider a sample with a mean of 500 and a standard deviation
of
100. What are the z-scores for the following data values: 520,
650,
500, 450, and 280?
Aleksandra Pawłowska Measures of Distribution Shape and
Detecting Outliers
Task 2 – solution
Consider a sample with a mean of 500 and a standard deviation
of 100. What are the z-scores for the following data values: 520,
650, 500, 450, and 280? z1 = 0.2, z2 = 1.5, z3 = 0, z4 = −0.5,
z5 = −2.2
Aleksandra Pawłowska Measures of Distribution Shape and
Detecting Outliers
Task 3
Consider a sample with a mean of 30 and a standard deviation
of 5.
Use Chebyshev’s theorem to determine the percentage of the
data
within each of the following ranges:
1 20 to 40
2 15 to 45
3 22 to 38
4 18 to 42
5 12 to 48
Aleksandra Pawłowska Measures of Distribution Shape and
Detecting Outliers
Task 3 – solution
1 20 to 40 75%
2 15 to 45 89%
3 22 to 38 61%
4 18 to 42 83%
5 12 to 48 92%
Aleksandra Pawłowska Measures of Distribution Shape and
Detecting Outliers
Task 4
Suppose the data have a bell-shaped distribution with a mean of
30
and a standard deviation of 5. Use the empirical rule to
determine
the percentage of data within each of the following ranges:
1 20 to 40
2 15 to 45
3 25 to 35
Aleksandra Pawłowska Measures of Distribution Shape and
Detecting Outliers
Task 4 – solution
1 20 to 40 95%
2 15 to 45 almost 100%
3 25 to 35 68%
Aleksandra Pawłowska Measures of Distribution Shape and
Detecting Outliers
Task 5
The results of a national survey showed that on average, adults
sleep 6.9 hours per night. Suppose that the standard deviation is
1.2 hours.
1 Use Chebyshev’s theorem to calculate the percentage of
individuals who sleep between 4.5 and 9.3 hours.
2 Use Chebyshev’s theorem to calculate the percentage of
individuals who sleep between 3.9 and 9.9 hours.
3 Assume that the number of hours of sleep follows a
bell-shaped distribution. Use the empirical rule to calculate
the percentage of individuals who sleep between 4.5 and 9.3
hours per day. How does this result compare to the value that
you obtained using Chebyshev’s theorem in part (a)?
Aleksandra Pawłowska Measures of Distribution Shape and
Detecting Outliers
Task 5 – solution
1 Use Chebyshev’s theorem to calculate the percentage of
individuals who sleep between 4.5 and 9.3 hours. 75%
2 Use Chebyshev’s theorem to calculate the percentage of
individuals who sleep between 3.9 and 9.9 hours. 84%
3 Assume that the number of hours of sleep follows a
bell-shaped distribution. Use the empirical rule to calculate
the percentage of individuals who sleep between 4.5 and 9.3
hours per day. How does this result compare to the value that
you obtained using Chebyshev’s theorem in part (1)? 95%; if
we assume, that data are distributed symetrically, then more
observations are closer to the mean
Aleksandra Pawłowska Measures of Distribution Shape and
Detecting Outliers
Task 6
The Energy Information Administration reported that the mean
re-
tail price per gallon of regular grade gasoline was $2.05
(Energy
Information Administration, May 2009). Suppose that the
standard
deviation was $0.10 and that the retail price per gallon has a
bell-
shaped distribution.
1 What percentage of regular grade gasoline sold between $1.95
and $2.15 per gallon?
2 What percentage of regular grade gasoline sold between $1.95
and $2.25 per gallon?
3 What percentage of regular grade gasoline sold for more than
$2.25 per gallon?
Aleksandra Pawłowska Measures of Distribution Shape and
Detecting Outliers
Task 6 – solution
1 What percentage of regular grade gasoline sold between $1.95
and $2.15 per gallon? 68%
2 What percentage of regular grade gasoline sold between $1.95
and $2.25 per gallon? 81.5%
3 What percentage of regular grade gasoline sold for more than
$2.25 per gallon? 2.5%
Aleksandra Pawłowska Measures of Distribution Shape and
Detecting Outliers
Task 7
The national average for the math portion of the College
Board’s
Scholastic Aptitude Test (SAT) is 515 (The World Almanac,
2009).
The College Board periodically rescales the test scores such that
the standard deviation is approximately 100. Answer the
following
questions using a bell-shaped distribution and the empirical rule
for
the verbal test scores.
1 What percentage of students have an SAT verbal score
greater than 615?
2 What percentage of students have an SAT verbal score
greater than 715?
3 What percentage of students have an SAT verbal score
between 415 and 515?
4 What percentage of students have an SAT verbal score
between 315 and 615?
Aleksandra Pawłowska Measures of Distribution Shape and
Detecting Outliers
Task 7 – solution
1 What percentage of students have an SAT verbal score
greater than 615? 16%
2 What percentage of students have an SAT verbal score
greater than 715? 2.5%
3 What percentage of students have an SAT verbal score
between 415 and 515? 34%
4 What percentage of students have an SAT verbal score
between 315 and 615? 81.5%
Aleksandra Pawłowska Measures of Distribution Shape and
Detecting Outliers
Tabular and Graphical PresentationsStatistics (exercises).docx

More Related Content

Similar to Tabular and Graphical PresentationsStatistics (exercises).docx

Presentation and-analysis-of-business-data
Presentation and-analysis-of-business-dataPresentation and-analysis-of-business-data
Presentation and-analysis-of-business-datalawrencechavenia
 
Presentation and-analysis-of-business-data
Presentation and-analysis-of-business-dataPresentation and-analysis-of-business-data
Presentation and-analysis-of-business-datalovelyquintero
 
Presentation and-analysis-of-business-data
Presentation and-analysis-of-business-dataPresentation and-analysis-of-business-data
Presentation and-analysis-of-business-datalovelyquintero
 
Presentation and-analysis-of-business-data
Presentation and-analysis-of-business-dataPresentation and-analysis-of-business-data
Presentation and-analysis-of-business-datalovelyquintero
 
Presentation and analysis of business data
Presentation and analysis of business dataPresentation and analysis of business data
Presentation and analysis of business dataGeorginaRecto
 
Data DistributionM (1).pptx
Data DistributionM (1).pptxData DistributionM (1).pptx
Data DistributionM (1).pptxhodakamal6
 
1-Organizing and Graphing Qualitative data.pptx
1-Organizing and Graphing Qualitative data.pptx1-Organizing and Graphing Qualitative data.pptx
1-Organizing and Graphing Qualitative data.pptxssuserdb3083
 
1-Organizing and Graphing Qualitative data 3.pptx
1-Organizing and Graphing Qualitative data 3.pptx1-Organizing and Graphing Qualitative data 3.pptx
1-Organizing and Graphing Qualitative data 3.pptxssuserdb3083
 
20- Tabular & Graphical Presentation of data(UG2017-18).ppt
20- Tabular & Graphical Presentation of data(UG2017-18).ppt20- Tabular & Graphical Presentation of data(UG2017-18).ppt
20- Tabular & Graphical Presentation of data(UG2017-18).pptRAJESHKUMAR428748
 
TSTD 6251  Fall 2014SPSS Exercise and Assignment 120 PointsI.docx
TSTD 6251  Fall 2014SPSS Exercise and Assignment 120 PointsI.docxTSTD 6251  Fall 2014SPSS Exercise and Assignment 120 PointsI.docx
TSTD 6251  Fall 2014SPSS Exercise and Assignment 120 PointsI.docxnanamonkton
 
Analysis of variance (ANOVA)
Analysis of variance (ANOVA)Analysis of variance (ANOVA)
Analysis of variance (ANOVA)Sneh Kumari
 
Correlation: Bivariate Data and Scatter Plot
Correlation: Bivariate Data and Scatter PlotCorrelation: Bivariate Data and Scatter Plot
Correlation: Bivariate Data and Scatter PlotDenzelMontuya1
 
Chi square test social research refer.ppt
Chi square test social research refer.pptChi square test social research refer.ppt
Chi square test social research refer.pptSnehamurali18
 
Statistics for interpreting test scores
Statistics for interpreting test scoresStatistics for interpreting test scores
Statistics for interpreting test scoresmpazhou
 
Anova by Hazilah Mohd Amin
Anova by Hazilah Mohd AminAnova by Hazilah Mohd Amin
Anova by Hazilah Mohd AminHazilahMohd
 
Biostatistics
BiostatisticsBiostatistics
Biostatisticspriyarokz
 

Similar to Tabular and Graphical PresentationsStatistics (exercises).docx (20)

Presentation and-analysis-of-business-data
Presentation and-analysis-of-business-dataPresentation and-analysis-of-business-data
Presentation and-analysis-of-business-data
 
Presentation and-analysis-of-business-data
Presentation and-analysis-of-business-dataPresentation and-analysis-of-business-data
Presentation and-analysis-of-business-data
 
Presentation and-analysis-of-business-data
Presentation and-analysis-of-business-dataPresentation and-analysis-of-business-data
Presentation and-analysis-of-business-data
 
Presentation and-analysis-of-business-data
Presentation and-analysis-of-business-dataPresentation and-analysis-of-business-data
Presentation and-analysis-of-business-data
 
Presentation and analysis of business data
Presentation and analysis of business dataPresentation and analysis of business data
Presentation and analysis of business data
 
Data DistributionM (1).pptx
Data DistributionM (1).pptxData DistributionM (1).pptx
Data DistributionM (1).pptx
 
Business statistics
Business statisticsBusiness statistics
Business statistics
 
Medical statistics2
Medical statistics2Medical statistics2
Medical statistics2
 
1-Organizing and Graphing Qualitative data.pptx
1-Organizing and Graphing Qualitative data.pptx1-Organizing and Graphing Qualitative data.pptx
1-Organizing and Graphing Qualitative data.pptx
 
1-Organizing and Graphing Qualitative data 3.pptx
1-Organizing and Graphing Qualitative data 3.pptx1-Organizing and Graphing Qualitative data 3.pptx
1-Organizing and Graphing Qualitative data 3.pptx
 
20- Tabular & Graphical Presentation of data(UG2017-18).ppt
20- Tabular & Graphical Presentation of data(UG2017-18).ppt20- Tabular & Graphical Presentation of data(UG2017-18).ppt
20- Tabular & Graphical Presentation of data(UG2017-18).ppt
 
Regression
RegressionRegression
Regression
 
TSTD 6251  Fall 2014SPSS Exercise and Assignment 120 PointsI.docx
TSTD 6251  Fall 2014SPSS Exercise and Assignment 120 PointsI.docxTSTD 6251  Fall 2014SPSS Exercise and Assignment 120 PointsI.docx
TSTD 6251  Fall 2014SPSS Exercise and Assignment 120 PointsI.docx
 
Regression
RegressionRegression
Regression
 
Analysis of variance (ANOVA)
Analysis of variance (ANOVA)Analysis of variance (ANOVA)
Analysis of variance (ANOVA)
 
Correlation: Bivariate Data and Scatter Plot
Correlation: Bivariate Data and Scatter PlotCorrelation: Bivariate Data and Scatter Plot
Correlation: Bivariate Data and Scatter Plot
 
Chi square test social research refer.ppt
Chi square test social research refer.pptChi square test social research refer.ppt
Chi square test social research refer.ppt
 
Statistics for interpreting test scores
Statistics for interpreting test scoresStatistics for interpreting test scores
Statistics for interpreting test scores
 
Anova by Hazilah Mohd Amin
Anova by Hazilah Mohd AminAnova by Hazilah Mohd Amin
Anova by Hazilah Mohd Amin
 
Biostatistics
BiostatisticsBiostatistics
Biostatistics
 

More from perryk1

Take a few moments to research the contextual elements surrounding P.docx
Take a few moments to research the contextual elements surrounding P.docxTake a few moments to research the contextual elements surrounding P.docx
Take a few moments to research the contextual elements surrounding P.docxperryk1
 
Table of Contents Section 2 Improving Healthcare Quality from.docx
Table of Contents Section 2 Improving Healthcare Quality from.docxTable of Contents Section 2 Improving Healthcare Quality from.docx
Table of Contents Section 2 Improving Healthcare Quality from.docxperryk1
 
Take a company and build a unique solution not currently offered. Bu.docx
Take a company and build a unique solution not currently offered. Bu.docxTake a company and build a unique solution not currently offered. Bu.docx
Take a company and build a unique solution not currently offered. Bu.docxperryk1
 
Tackling a Crisis Head-onThis week, we will be starting our .docx
Tackling a Crisis Head-onThis week, we will be starting our .docxTackling a Crisis Head-onThis week, we will be starting our .docx
Tackling a Crisis Head-onThis week, we will be starting our .docxperryk1
 
take a look at the latest Presidential Order that relates to str.docx
take a look at the latest Presidential Order that relates to str.docxtake a look at the latest Presidential Order that relates to str.docx
take a look at the latest Presidential Order that relates to str.docxperryk1
 
Table of Contents-Perioperative Care.-Perioperative Med.docx
Table of Contents-Perioperative Care.-Perioperative Med.docxTable of Contents-Perioperative Care.-Perioperative Med.docx
Table of Contents-Perioperative Care.-Perioperative Med.docxperryk1
 
Take a look at the sculptures by Giacometti and Moore in your te.docx
Take a look at the sculptures by Giacometti and Moore in your te.docxTake a look at the sculptures by Giacometti and Moore in your te.docx
Take a look at the sculptures by Giacometti and Moore in your te.docxperryk1
 
Table of ContentsLOCAL PEOPLE PERCEPTION TOWARDS SUSTAINABLE TOU.docx
Table of ContentsLOCAL PEOPLE PERCEPTION TOWARDS SUSTAINABLE TOU.docxTable of ContentsLOCAL PEOPLE PERCEPTION TOWARDS SUSTAINABLE TOU.docx
Table of ContentsLOCAL PEOPLE PERCEPTION TOWARDS SUSTAINABLE TOU.docxperryk1
 
Table of Contents Title PageWELCOMETHE VAJRA.docx
Table of Contents Title PageWELCOMETHE VAJRA.docxTable of Contents Title PageWELCOMETHE VAJRA.docx
Table of Contents Title PageWELCOMETHE VAJRA.docxperryk1
 
Take a few minutes to reflect on this course. How has your think.docx
Take a few minutes to reflect on this course. How has your think.docxTake a few minutes to reflect on this course. How has your think.docx
Take a few minutes to reflect on this course. How has your think.docxperryk1
 
Taiwan The Tail That Wags DogsMichael McDevittAsia Po.docx
Taiwan The Tail That Wags DogsMichael McDevittAsia Po.docxTaiwan The Tail That Wags DogsMichael McDevittAsia Po.docx
Taiwan The Tail That Wags DogsMichael McDevittAsia Po.docxperryk1
 
TABLE 1-1 Milestones of Medicine and Medical Education 1700–2015 ■.docx
TABLE 1-1 Milestones of Medicine and Medical Education 1700–2015 ■.docxTABLE 1-1 Milestones of Medicine and Medical Education 1700–2015 ■.docx
TABLE 1-1 Milestones of Medicine and Medical Education 1700–2015 ■.docxperryk1
 
Tackling wicked problems A public policy perspective Ple.docx
Tackling wicked problems  A public policy perspective Ple.docxTackling wicked problems  A public policy perspective Ple.docx
Tackling wicked problems A public policy perspective Ple.docxperryk1
 
Tahira Longus Week 2 Discussion PostThe Public Administration.docx
Tahira Longus Week 2 Discussion PostThe Public Administration.docxTahira Longus Week 2 Discussion PostThe Public Administration.docx
Tahira Longus Week 2 Discussion PostThe Public Administration.docxperryk1
 
Table 4-5 CSFs for ERP ImplementationCritical Success Fact.docx
Table 4-5 CSFs for ERP ImplementationCritical Success Fact.docxTable 4-5 CSFs for ERP ImplementationCritical Success Fact.docx
Table 4-5 CSFs for ERP ImplementationCritical Success Fact.docxperryk1
 
Table 7.7 Comparative Financial Statistics Universal Office Fur.docx
Table 7.7 Comparative Financial Statistics Universal Office Fur.docxTable 7.7 Comparative Financial Statistics Universal Office Fur.docx
Table 7.7 Comparative Financial Statistics Universal Office Fur.docxperryk1
 
TableOfContentsTable of contents with hyperlinks for this document.docx
TableOfContentsTable of contents with hyperlinks for this document.docxTableOfContentsTable of contents with hyperlinks for this document.docx
TableOfContentsTable of contents with hyperlinks for this document.docxperryk1
 
Tajfel and Turner (in chapter two of our reader) give us the followi.docx
Tajfel and Turner (in chapter two of our reader) give us the followi.docxTajfel and Turner (in chapter two of our reader) give us the followi.docx
Tajfel and Turner (in chapter two of our reader) give us the followi.docxperryk1
 
tabOccupational Safety & Health for Technologists, Enginee.docx
tabOccupational Safety & Health for Technologists, Enginee.docxtabOccupational Safety & Health for Technologists, Enginee.docx
tabOccupational Safety & Health for Technologists, Enginee.docxperryk1
 
Tableau Homework 3 – Exploring Chart Types with QVC Data .docx
Tableau Homework 3 – Exploring Chart Types with QVC Data  .docxTableau Homework 3 – Exploring Chart Types with QVC Data  .docx
Tableau Homework 3 – Exploring Chart Types with QVC Data .docxperryk1
 

More from perryk1 (20)

Take a few moments to research the contextual elements surrounding P.docx
Take a few moments to research the contextual elements surrounding P.docxTake a few moments to research the contextual elements surrounding P.docx
Take a few moments to research the contextual elements surrounding P.docx
 
Table of Contents Section 2 Improving Healthcare Quality from.docx
Table of Contents Section 2 Improving Healthcare Quality from.docxTable of Contents Section 2 Improving Healthcare Quality from.docx
Table of Contents Section 2 Improving Healthcare Quality from.docx
 
Take a company and build a unique solution not currently offered. Bu.docx
Take a company and build a unique solution not currently offered. Bu.docxTake a company and build a unique solution not currently offered. Bu.docx
Take a company and build a unique solution not currently offered. Bu.docx
 
Tackling a Crisis Head-onThis week, we will be starting our .docx
Tackling a Crisis Head-onThis week, we will be starting our .docxTackling a Crisis Head-onThis week, we will be starting our .docx
Tackling a Crisis Head-onThis week, we will be starting our .docx
 
take a look at the latest Presidential Order that relates to str.docx
take a look at the latest Presidential Order that relates to str.docxtake a look at the latest Presidential Order that relates to str.docx
take a look at the latest Presidential Order that relates to str.docx
 
Table of Contents-Perioperative Care.-Perioperative Med.docx
Table of Contents-Perioperative Care.-Perioperative Med.docxTable of Contents-Perioperative Care.-Perioperative Med.docx
Table of Contents-Perioperative Care.-Perioperative Med.docx
 
Take a look at the sculptures by Giacometti and Moore in your te.docx
Take a look at the sculptures by Giacometti and Moore in your te.docxTake a look at the sculptures by Giacometti and Moore in your te.docx
Take a look at the sculptures by Giacometti and Moore in your te.docx
 
Table of ContentsLOCAL PEOPLE PERCEPTION TOWARDS SUSTAINABLE TOU.docx
Table of ContentsLOCAL PEOPLE PERCEPTION TOWARDS SUSTAINABLE TOU.docxTable of ContentsLOCAL PEOPLE PERCEPTION TOWARDS SUSTAINABLE TOU.docx
Table of ContentsLOCAL PEOPLE PERCEPTION TOWARDS SUSTAINABLE TOU.docx
 
Table of Contents Title PageWELCOMETHE VAJRA.docx
Table of Contents Title PageWELCOMETHE VAJRA.docxTable of Contents Title PageWELCOMETHE VAJRA.docx
Table of Contents Title PageWELCOMETHE VAJRA.docx
 
Take a few minutes to reflect on this course. How has your think.docx
Take a few minutes to reflect on this course. How has your think.docxTake a few minutes to reflect on this course. How has your think.docx
Take a few minutes to reflect on this course. How has your think.docx
 
Taiwan The Tail That Wags DogsMichael McDevittAsia Po.docx
Taiwan The Tail That Wags DogsMichael McDevittAsia Po.docxTaiwan The Tail That Wags DogsMichael McDevittAsia Po.docx
Taiwan The Tail That Wags DogsMichael McDevittAsia Po.docx
 
TABLE 1-1 Milestones of Medicine and Medical Education 1700–2015 ■.docx
TABLE 1-1 Milestones of Medicine and Medical Education 1700–2015 ■.docxTABLE 1-1 Milestones of Medicine and Medical Education 1700–2015 ■.docx
TABLE 1-1 Milestones of Medicine and Medical Education 1700–2015 ■.docx
 
Tackling wicked problems A public policy perspective Ple.docx
Tackling wicked problems  A public policy perspective Ple.docxTackling wicked problems  A public policy perspective Ple.docx
Tackling wicked problems A public policy perspective Ple.docx
 
Tahira Longus Week 2 Discussion PostThe Public Administration.docx
Tahira Longus Week 2 Discussion PostThe Public Administration.docxTahira Longus Week 2 Discussion PostThe Public Administration.docx
Tahira Longus Week 2 Discussion PostThe Public Administration.docx
 
Table 4-5 CSFs for ERP ImplementationCritical Success Fact.docx
Table 4-5 CSFs for ERP ImplementationCritical Success Fact.docxTable 4-5 CSFs for ERP ImplementationCritical Success Fact.docx
Table 4-5 CSFs for ERP ImplementationCritical Success Fact.docx
 
Table 7.7 Comparative Financial Statistics Universal Office Fur.docx
Table 7.7 Comparative Financial Statistics Universal Office Fur.docxTable 7.7 Comparative Financial Statistics Universal Office Fur.docx
Table 7.7 Comparative Financial Statistics Universal Office Fur.docx
 
TableOfContentsTable of contents with hyperlinks for this document.docx
TableOfContentsTable of contents with hyperlinks for this document.docxTableOfContentsTable of contents with hyperlinks for this document.docx
TableOfContentsTable of contents with hyperlinks for this document.docx
 
Tajfel and Turner (in chapter two of our reader) give us the followi.docx
Tajfel and Turner (in chapter two of our reader) give us the followi.docxTajfel and Turner (in chapter two of our reader) give us the followi.docx
Tajfel and Turner (in chapter two of our reader) give us the followi.docx
 
tabOccupational Safety & Health for Technologists, Enginee.docx
tabOccupational Safety & Health for Technologists, Enginee.docxtabOccupational Safety & Health for Technologists, Enginee.docx
tabOccupational Safety & Health for Technologists, Enginee.docx
 
Tableau Homework 3 – Exploring Chart Types with QVC Data .docx
Tableau Homework 3 – Exploring Chart Types with QVC Data  .docxTableau Homework 3 – Exploring Chart Types with QVC Data  .docx
Tableau Homework 3 – Exploring Chart Types with QVC Data .docx
 

Recently uploaded

Privatization and Disinvestment - Meaning, Objectives, Advantages and Disadva...
Privatization and Disinvestment - Meaning, Objectives, Advantages and Disadva...Privatization and Disinvestment - Meaning, Objectives, Advantages and Disadva...
Privatization and Disinvestment - Meaning, Objectives, Advantages and Disadva...RKavithamani
 
The Most Excellent Way | 1 Corinthians 13
The Most Excellent Way | 1 Corinthians 13The Most Excellent Way | 1 Corinthians 13
The Most Excellent Way | 1 Corinthians 13Steve Thomason
 
Paris 2024 Olympic Geographies - an activity
Paris 2024 Olympic Geographies - an activityParis 2024 Olympic Geographies - an activity
Paris 2024 Olympic Geographies - an activityGeoBlogs
 
Separation of Lanthanides/ Lanthanides and Actinides
Separation of Lanthanides/ Lanthanides and ActinidesSeparation of Lanthanides/ Lanthanides and Actinides
Separation of Lanthanides/ Lanthanides and ActinidesFatimaKhan178732
 
Web & Social Media Analytics Previous Year Question Paper.pdf
Web & Social Media Analytics Previous Year Question Paper.pdfWeb & Social Media Analytics Previous Year Question Paper.pdf
Web & Social Media Analytics Previous Year Question Paper.pdfJayanti Pande
 
Hybridoma Technology ( Production , Purification , and Application )
Hybridoma Technology  ( Production , Purification , and Application  ) Hybridoma Technology  ( Production , Purification , and Application  )
Hybridoma Technology ( Production , Purification , and Application ) Sakshi Ghasle
 
Measures of Central Tendency: Mean, Median and Mode
Measures of Central Tendency: Mean, Median and ModeMeasures of Central Tendency: Mean, Median and Mode
Measures of Central Tendency: Mean, Median and ModeThiyagu K
 
1029-Danh muc Sach Giao Khoa khoi 6.pdf
1029-Danh muc Sach Giao Khoa khoi  6.pdf1029-Danh muc Sach Giao Khoa khoi  6.pdf
1029-Danh muc Sach Giao Khoa khoi 6.pdfQucHHunhnh
 
BASLIQ CURRENT LOOKBOOK LOOKBOOK(1) (1).pdf
BASLIQ CURRENT LOOKBOOK  LOOKBOOK(1) (1).pdfBASLIQ CURRENT LOOKBOOK  LOOKBOOK(1) (1).pdf
BASLIQ CURRENT LOOKBOOK LOOKBOOK(1) (1).pdfSoniaTolstoy
 
“Oh GOSH! Reflecting on Hackteria's Collaborative Practices in a Global Do-It...
“Oh GOSH! Reflecting on Hackteria's Collaborative Practices in a Global Do-It...“Oh GOSH! Reflecting on Hackteria's Collaborative Practices in a Global Do-It...
“Oh GOSH! Reflecting on Hackteria's Collaborative Practices in a Global Do-It...Marc Dusseiller Dusjagr
 
Contemporary philippine arts from the regions_PPT_Module_12 [Autosaved] (1).pptx
Contemporary philippine arts from the regions_PPT_Module_12 [Autosaved] (1).pptxContemporary philippine arts from the regions_PPT_Module_12 [Autosaved] (1).pptx
Contemporary philippine arts from the regions_PPT_Module_12 [Autosaved] (1).pptxRoyAbrique
 
Advanced Views - Calendar View in Odoo 17
Advanced Views - Calendar View in Odoo 17Advanced Views - Calendar View in Odoo 17
Advanced Views - Calendar View in Odoo 17Celine George
 
Organic Name Reactions for the students and aspirants of Chemistry12th.pptx
Organic Name Reactions  for the students and aspirants of Chemistry12th.pptxOrganic Name Reactions  for the students and aspirants of Chemistry12th.pptx
Organic Name Reactions for the students and aspirants of Chemistry12th.pptxVS Mahajan Coaching Centre
 
A Critique of the Proposed National Education Policy Reform
A Critique of the Proposed National Education Policy ReformA Critique of the Proposed National Education Policy Reform
A Critique of the Proposed National Education Policy ReformChameera Dedduwage
 
Mastering the Unannounced Regulatory Inspection
Mastering the Unannounced Regulatory InspectionMastering the Unannounced Regulatory Inspection
Mastering the Unannounced Regulatory InspectionSafetyChain Software
 
CARE OF CHILD IN INCUBATOR..........pptx
CARE OF CHILD IN INCUBATOR..........pptxCARE OF CHILD IN INCUBATOR..........pptx
CARE OF CHILD IN INCUBATOR..........pptxGaneshChakor2
 
Activity 01 - Artificial Culture (1).pdf
Activity 01 - Artificial Culture (1).pdfActivity 01 - Artificial Culture (1).pdf
Activity 01 - Artificial Culture (1).pdfciinovamais
 
1029 - Danh muc Sach Giao Khoa 10 . pdf
1029 -  Danh muc Sach Giao Khoa 10 . pdf1029 -  Danh muc Sach Giao Khoa 10 . pdf
1029 - Danh muc Sach Giao Khoa 10 . pdfQucHHunhnh
 
Beyond the EU: DORA and NIS 2 Directive's Global Impact
Beyond the EU: DORA and NIS 2 Directive's Global ImpactBeyond the EU: DORA and NIS 2 Directive's Global Impact
Beyond the EU: DORA and NIS 2 Directive's Global ImpactPECB
 

Recently uploaded (20)

Privatization and Disinvestment - Meaning, Objectives, Advantages and Disadva...
Privatization and Disinvestment - Meaning, Objectives, Advantages and Disadva...Privatization and Disinvestment - Meaning, Objectives, Advantages and Disadva...
Privatization and Disinvestment - Meaning, Objectives, Advantages and Disadva...
 
The Most Excellent Way | 1 Corinthians 13
The Most Excellent Way | 1 Corinthians 13The Most Excellent Way | 1 Corinthians 13
The Most Excellent Way | 1 Corinthians 13
 
Paris 2024 Olympic Geographies - an activity
Paris 2024 Olympic Geographies - an activityParis 2024 Olympic Geographies - an activity
Paris 2024 Olympic Geographies - an activity
 
Separation of Lanthanides/ Lanthanides and Actinides
Separation of Lanthanides/ Lanthanides and ActinidesSeparation of Lanthanides/ Lanthanides and Actinides
Separation of Lanthanides/ Lanthanides and Actinides
 
Web & Social Media Analytics Previous Year Question Paper.pdf
Web & Social Media Analytics Previous Year Question Paper.pdfWeb & Social Media Analytics Previous Year Question Paper.pdf
Web & Social Media Analytics Previous Year Question Paper.pdf
 
Hybridoma Technology ( Production , Purification , and Application )
Hybridoma Technology  ( Production , Purification , and Application  ) Hybridoma Technology  ( Production , Purification , and Application  )
Hybridoma Technology ( Production , Purification , and Application )
 
Measures of Central Tendency: Mean, Median and Mode
Measures of Central Tendency: Mean, Median and ModeMeasures of Central Tendency: Mean, Median and Mode
Measures of Central Tendency: Mean, Median and Mode
 
1029-Danh muc Sach Giao Khoa khoi 6.pdf
1029-Danh muc Sach Giao Khoa khoi  6.pdf1029-Danh muc Sach Giao Khoa khoi  6.pdf
1029-Danh muc Sach Giao Khoa khoi 6.pdf
 
BASLIQ CURRENT LOOKBOOK LOOKBOOK(1) (1).pdf
BASLIQ CURRENT LOOKBOOK  LOOKBOOK(1) (1).pdfBASLIQ CURRENT LOOKBOOK  LOOKBOOK(1) (1).pdf
BASLIQ CURRENT LOOKBOOK LOOKBOOK(1) (1).pdf
 
TataKelola dan KamSiber Kecerdasan Buatan v022.pdf
TataKelola dan KamSiber Kecerdasan Buatan v022.pdfTataKelola dan KamSiber Kecerdasan Buatan v022.pdf
TataKelola dan KamSiber Kecerdasan Buatan v022.pdf
 
“Oh GOSH! Reflecting on Hackteria's Collaborative Practices in a Global Do-It...
“Oh GOSH! Reflecting on Hackteria's Collaborative Practices in a Global Do-It...“Oh GOSH! Reflecting on Hackteria's Collaborative Practices in a Global Do-It...
“Oh GOSH! Reflecting on Hackteria's Collaborative Practices in a Global Do-It...
 
Contemporary philippine arts from the regions_PPT_Module_12 [Autosaved] (1).pptx
Contemporary philippine arts from the regions_PPT_Module_12 [Autosaved] (1).pptxContemporary philippine arts from the regions_PPT_Module_12 [Autosaved] (1).pptx
Contemporary philippine arts from the regions_PPT_Module_12 [Autosaved] (1).pptx
 
Advanced Views - Calendar View in Odoo 17
Advanced Views - Calendar View in Odoo 17Advanced Views - Calendar View in Odoo 17
Advanced Views - Calendar View in Odoo 17
 
Organic Name Reactions for the students and aspirants of Chemistry12th.pptx
Organic Name Reactions  for the students and aspirants of Chemistry12th.pptxOrganic Name Reactions  for the students and aspirants of Chemistry12th.pptx
Organic Name Reactions for the students and aspirants of Chemistry12th.pptx
 
A Critique of the Proposed National Education Policy Reform
A Critique of the Proposed National Education Policy ReformA Critique of the Proposed National Education Policy Reform
A Critique of the Proposed National Education Policy Reform
 
Mastering the Unannounced Regulatory Inspection
Mastering the Unannounced Regulatory InspectionMastering the Unannounced Regulatory Inspection
Mastering the Unannounced Regulatory Inspection
 
CARE OF CHILD IN INCUBATOR..........pptx
CARE OF CHILD IN INCUBATOR..........pptxCARE OF CHILD IN INCUBATOR..........pptx
CARE OF CHILD IN INCUBATOR..........pptx
 
Activity 01 - Artificial Culture (1).pdf
Activity 01 - Artificial Culture (1).pdfActivity 01 - Artificial Culture (1).pdf
Activity 01 - Artificial Culture (1).pdf
 
1029 - Danh muc Sach Giao Khoa 10 . pdf
1029 -  Danh muc Sach Giao Khoa 10 . pdf1029 -  Danh muc Sach Giao Khoa 10 . pdf
1029 - Danh muc Sach Giao Khoa 10 . pdf
 
Beyond the EU: DORA and NIS 2 Directive's Global Impact
Beyond the EU: DORA and NIS 2 Directive's Global ImpactBeyond the EU: DORA and NIS 2 Directive's Global Impact
Beyond the EU: DORA and NIS 2 Directive's Global Impact
 

Tabular and Graphical PresentationsStatistics (exercises).docx

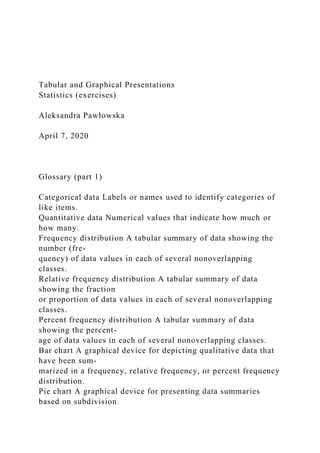
  • 1. Tabular and Graphical Presentations Statistics (exercises) Aleksandra Pawłowska April 7, 2020 Glossary (part 1) Categorical data Labels or names used to identify categories of like items. Quantitative data Numerical values that indicate how much or how many. Frequency distribution A tabular summary of data showing the number (fre- quency) of data values in each of several nonoverlapping classes. Relative frequency distribution A tabular summary of data showing the fraction or proportion of data values in each of several nonoverlapping classes. Percent frequency distribution A tabular summary of data showing the percent- age of data values in each of several nonoverlapping classes. Bar chart A graphical device for depicting qualitative data that have been sum- marized in a frequency, relative frequency, or percent frequency distribution. Pie chart A graphical device for presenting data summaries based on subdivision
  • 2. of a circle into sectors that correspond to the relative frequency for each class. Dot plot A graphical device that summarizes data by the number of dots above each data value on the horizontal axis. Aleksandra Pawłowska Tabular and Graphical Presentations Glossary (part 2) Histogram A graphical presentation of a frequency distribution, relative frequency distribution, or percent frequency distribution of quantitative data constructed by placing the class intervals on the horizontal axis and the frequencies, relative frequencies, or percent frequencies on the vertical axis. Cumulative frequency distribution A tabular summary of quantitative data show- ing the number of data values that are less than or equal to the upper class limit of each class. Cumulative relative frequency distribution A tabular summary of quantitative data showing the fraction or proportion of data values that are less than or equal to the upper class limit of each class. Cumulative percent frequency distribution A tabular summary of quantitative data showing the percentage of data values that are less than or equal to the upper class limit of each class. Ogive A graph of a cumulative distribution. Scatter diagram A graphical presentation of the relationship
  • 3. between two quan- titative variables. One variable is shown on the horizontal axis and the other variable is shown on the vertical axis. Trendline A line that provides an approximation of the relationship between two variables. Aleksandra Pawłowska Tabular and Graphical Presentations Useful tips (part 1) 1 Often the number of classes in a frequency distribution is the same as the number of categories found in the data. Most statisticians recommend that classes with smaller frequencies be grouped into an aggregate class called „other”. Classes with frequencies of 5% or less would most often be treated in this fashion. 2 The sum of the frequencies in any frequency distribution always equals the number of observations. The sum of the relative frequencies in any relative frequency distribution always equals 1.00, and the sum of the percentages in a percent frequency distribution always equals 100. Aleksandra Pawłowska Tabular and Graphical Presentations
  • 4. Useful tips (part 2) 1 A bar chart and a histogram are essentially the same thing; both are graphical presentations of the data in a frequency distribution. A histogram is just a bar chart with no separation between bars. For some discrete quantitative data, a separation between bars is also appropriate. 2 The last entry in a cumulative frequency distribution always equals the total number of observations. The last entry in a cumulative relative frequency distribution always equals 1.00 and the last entry in a cumulative percent frequency distribution always equals 100. Aleksandra Pawłowska Tabular and Graphical Presentations Exercises Task 1 The response to a question has three alternatives: A, B, and C. A sample of 120 responses provides 60 A, 24 B, and 36 C. Show the frequency and relative frequency distributions. Aleksandra Pawłowska Tabular and Graphical Presentations
  • 5. Task 1 – solution frequency distribution relative frequency distribution A 60 0.5 B 24 0.2 C 36 0.3 Total 120 1.00 Aleksandra Pawłowska Tabular and Graphical Presentations Task 2 A questionnaire provides 58 Yes, 42 No, and 20 no-opinion answers. 1 In the construction of a pie chart, how many degrees would be in the section of the pie showing the Yes answers? 2 How many degrees would be in the section of the pie showing the No answers? 3 Construct a pie chart. 4 Construct a bar chart. Aleksandra Pawłowska Tabular and Graphical Presentations Task 2 – solution 1 In the construction of a pie chart, how many degrees would be in the
  • 6. section of the pie showing the Yes answers? 174 2 How many degrees would be in the section of the pie showing the No answers? 126 3 Construct a pie chart. 4 Construct a bar chart. Aleksandra Pawłowska Tabular and Graphical Presentations Task 3 Consider the following frequency distribution. Construct a cumulative frequency distribution and a cumulative relative frequency distribution. Aleksandra Pawłowska Tabular and Graphical Presentations Task 3 – solution Aleksandra Pawłowska Tabular and Graphical Presentations Task 4 A doctor’s office staff studied the waiting times for patients who ar- rive at the office with a request for emergency service. The
  • 7. following data with waiting times in minutes were collected over a one- month period. Use classes of 0–4, 5–9, and so on in the following: 1 Show the frequency distribution. 2 Show the relative frequency distribution. 3 Show the cumulative frequency distribution. 4 Show the cumulative relative frequency distribution. 5 What proportion of patients needing emergency service wait 9 minutes or less? Aleksandra Pawłowska Tabular and Graphical Presentations Task 4 – solution 1 Show the frequency distribution. Show the relative frequency distribution. Aleksandra Pawłowska Tabular and Graphical Presentations Task 4 – solution 1 Show the cumulative frequency distribution. Show the cumulative relative frequency distribution. 2 What proportion of patients needing emergency service wait 9 minutes or less? 0.6
  • 8. Aleksandra Pawłowska Tabular and Graphical Presentations Task 5 The following 20 observations are for two quantitative variables, x and y . 1 Develop a scatter diagram for the relationship between x and y . 2 What is the relationship, if any, between x and y? Aleksandra Pawłowska Tabular and Graphical Presentations Task 5 – solution A negative relationship between x and y ; y decreases as x increases. Aleksandra Pawłowska Tabular and Graphical Presentations Task 6 A partial relative frequency distribution is given. 1 What is the relative frequency of class D? 2 The total sample size is 200. What is the frequency of class D?
  • 9. 3 Show the frequency distribution. 4 Show the percent frequency distribution. Aleksandra Pawłowska Tabular and Graphical Presentations Task 6 – solution 1 What is the relative frequency of class D? 0.20 2 The total sample size is 200. What is the frequency of class D? 40 3 Show the frequency distribution. Show the percent frequency distribution. Aleksandra Pawłowska Tabular and Graphical Presentations Task 7 Data for a sample of 55 members of the Baseball Hall of Fame in Cooperstown, New York, are shown on next slide. Each observation indicates the primary position played by the Hall of Famers: pitcher (P), catcher (H), 1st base (1), 2nd base (2), 3rd base (3), shortstop (S), left field (L), center field (C), and right field (R). 1 Use frequency and relative frequency distributions to summarize the data.
  • 10. 2 What position provides the most Hall of Famers? 3 What position provides the fewest Hall of Famers? 4 What outfield position (L, C, or R) provides the most Hall of Famers? 5 Compare infielders (1, 2, 3, and S) to outfielders (L, C, and R). Aleksandra Pawłowska Tabular and Graphical Presentations Aleksandra Pawłowska Tabular and Graphical Presentations Task 7 – solution 1 Use frequency and relative frequency distributions to summarize the data. 2 What position provides the most Hall of Famers? Pitcher Aleksandra Pawłowska Tabular and Graphical Presentations Task 7 – solution 1 What position provides the fewest Hall of Famers? 3rd base 2 What outfield position (L, C, or R) provides the most Hall of Famers? Right field 3 Compare infielders (1, 2, 3, and S) to outfielders (L, C, and
  • 11. R). Infielders 16 to outfielders 18 Aleksandra Pawłowska Tabular and Graphical Presentations Measures of Variability Statistics (exercises) Aleksandra Pawłowska May 12, 2020 Glossary Range A measure of variability, defined to be the largest value minus the smallest value. Interquartile range (IQR) A measure of variability, defined to be the difference between the third and first quartiles. Variance A measure of variability based on the squared deviations of the data values about the mean. Standard deviation A measure of variability computed by taking the positive square root of the variance. Coefficient of variation A measure of relative variability computed by dividing the standard deviation by the mean and multiplying by 100.
  • 12. Aleksandra Pawłowska Measures of Variability Task 1 Consider a sample with data values of 10, 20, 12, 17, and 16. Com- pute the range and interquartile range. Aleksandra Pawłowska Measures of Variability Task 1 – solution Consider a sample with data values of 10, 20, 12, 17, and 16. Com- pute the range and interquartile range. range = 10, IQR = 5 Aleksandra Pawłowska Measures of Variability Task 2 Consider a sample with data values of 10, 20, 12, 17, and 16. Com- pute the variance and standard deviation. Aleksandra Pawłowska Measures of Variability Task 2 – solution
  • 13. Consider a sample with data values of 10, 20, 12, 17, and 16. Com- pute the variance and standard deviation. s2 = 16, s = 4 Aleksandra Pawłowska Measures of Variability Task 3 Consider a sample with data values of 27, 25, 20, 15, 30, 34, 28, and 25. Compute the range, interquartile range, variance, and standard deviation. Aleksandra Pawłowska Measures of Variability Task 3 – solution Consider a sample with data values of 27, 25, 20, 15, 30, 34, 28, and 25. Compute the range, interquartile range, variance, and standard deviation. range = 19, IQR = 6.5, s2 = 34.57, s = 5.88. Aleksandra Pawłowska Measures of Variability Task 4 A bowler’s scores for six games were 182, 168, 184, 190, 170,
  • 14. and 174. Using these data as a sample, compute the following descriptive statistics: 1 Range 2 Variance 3 Standard deviation 4 Coefficient of variation Aleksandra Pawłowska Measures of Variability Task 4 – solution 1 Range 22 2 Variance 75.2 3 Standard deviation 8.67 4 Coefficient of variation 4.87% Aleksandra Pawłowska Measures of Variability Task 5 A home theater in a box is the easiest and cheapest way to provide surround sound for a home entertainment center. A sample of prices is shown here (Consumer Reports Buying Guide, 2004). The prices are for models with a DVD player and for models without a DVD player. 1 Compute the mean price for models with a DVD player and the mean
  • 15. price for models without a DVD player. What is the additional price paid to have a DVD player included in a home theater unit? 2 Compute the range, variance, and standard deviation for the two samples. What does this information tell you about the prices for models with and without a DVD player? Aleksandra Pawłowska Measures of Variability Task 5 – solution 1 Compute the mean price for models with a DVD player and the mean price for models without a DVD player. What is the additional price paid to have a DVD player included in a home theater unit? For models with DVD player x̄ = 410 and for models without DVD player x̄ = 310. 2 Compute the range, variance, and standard deviation for the two samples. What does this information tell you about the prices for models with and without a DVD player? For models with DVD player range = 200, s2 = 5500, s = 74.16 and for models without DVD player range = 70, s2 = 800, s = 28.28. Aleksandra Pawłowska Measures of Variability Task 6 Car rental rates per day for a sample of seven Eastern U.S. cities are as follows (The Wall Street Journal, January 16, 2004).
  • 16. 1 Compute the mean, variance, and standard deviation for the car rental rates. 2 A similar sample of seven Western U.S. cities showed a sample mean car rental rate of $38 per day. The variance and standard deviation were 12.3 and 3.5, respectively. Discuss any difference between the car rental rates in Eastern and Western U.S. cities. Aleksandra Pawłowska Measures of Variability Task 6 – solution 1 Compute the mean, variance, and standard deviation for the car rental rates. x̄ = 38, s2 = 97, s = 9.85. 2 A similar sample of seven Western U.S. cities showed a sample mean car rental rate of $38 per day. The variance and standard deviation were 12.3 and 3.5, respectively. Discuss any difference between the car rental rates in Eastern and Western U.S. cities. Eastern shows more variation. Aleksandra Pawłowska Measures of Variability Task 7 The Los Angeles Times regularly reports the air quality index
  • 17. for various areas of Southern California. A sample of air quality index values for Pomona provided the following data: 28, 42, 58, 48, 45, 55, 60, 49, and 50. 1 Compute the range and interquartile range. 2 Compute the sample variance and sample standard deviation. 3 A sample of air quality index readings for Anaheim provided a sample mean of 48.5, a sample variance of 136, and a sample standard deviation of 11.66. What comparisons can you make between the air quality in Pomona and that in Anaheim on the basis of these descriptive statistics? Aleksandra Pawłowska Measures of Variability Task 7 – solution 1 Compute the range and interquartile range. range = 32, IQR = 10. 2 Compute the sample variance and sample standard deviation. s2 = 92.75, s = 9.63. 3 A sample of air quality index readings for Anaheim provided a sample mean of 48.5, a sample variance of 136, and a sample standard deviation of 11.66. What comparisons can you make between the air quality in Pomona and that in Anaheim on the basis of these descriptive statistics? Air quality in Anaheim is, on average, better than in Pomona, but also
  • 18. shows more variation. Aleksandra Pawłowska Measures of Variability Task 8 How do grocery costs compare across the country? Using a market basket of 10 items including meat, milk, bread, eggs, coffee, potatoes, cereal, and orange juice, Where to Retire magazine calculated the cost of the market basket in six cities and in six retirement areas across the country (Where to Retire, November/December 2003). The data with market basket cost to the nearest dollar are as follows: 1 Compute the mean, variance, and standard deviation for the sample of cities and the sample of retirement areas. 2 What observations can be made based on the two samples? Aleksandra Pawłowska Measures of Variability Task 8 – solution 1 Compute the mean, variance, and standard deviation for the sample of cities and the sample of retirement areas. For the sample of cities: x̄ = 33, s2 = 14.4, s = 3.79 and the sample of retirement areas: x̄ = 32, s2 = 3.6, s = 1.90.
  • 19. 2 What observations can be made based on the two samples? Aleksandra Pawłowska Measures of Variability Task 9 Scores turned in by an amateur golfer at the Bonita Fairways Golf Course in Bonita Springs, Florida, during 2005 and 2006 are as follows: 1 Use the mean and standard deviation to evaluate the golfer’s performance over the two-year period. 2 What is the primary difference in performance between 2005 and 2006? What improvement, if any, can be seen in the 2006 scores? Aleksandra Pawłowska Measures of Variability Task 9 – solution 1 Use the mean and standard deviation to evaluate the golfer’s performance over the two-year period. In 2005: x̄ = 76, s = 2.07 and in 2006: x̄ = 76, s = 5.26. 2 What is the primary difference in performance between 2005 and 2006? What improvement, if any, can be seen in the 2006 scores? There was, on average, no improvement in the scores in season 2006 comparing to the season 2005, but the scores in 2006 show more variation.
  • 20. Aleksandra Pawłowska Measures of Variability Data and Statistics Statistics (exercises) Aleksandra Pawłowska March 31, 2020 Glossary (part 1) Statistics The art and science of collecting, analyzing, presenting, and interpret- ing data. Data The facts and figures collected, analyzed, and summarized for presentation and interpretation. Data set All the data collected in a particular study. Elements The entities on which data are collected. Variable A characteristic of interest for the elements. Observation The set of measurements obtained for a particular element. Nominal scale The scale of measurement for a variable when the data are labels or names used to identify an attribute of an element. Nominal data may be nonnumeric or numeric. Ordinal scale The scale of measurement for a variable if the data exhibit the properties of nominal data and the order or rank of the data is meaningful.
  • 21. Ordinal data may be nonnumeric or numeric. Interval scale The scale of measurement for a variable if the data demonstrate the properties of ordinal data and the interval between values is expressed in terms of a fixed unit of measure. Interval data are always numeric. Aleksandra Pawłowska Data and Statistics Glossary (part 2) Ratio scale The scale of measurement for a variable if the data demonstrate all the properties of interval data and the ratio of two values is meaningful. Ratio data are always numeric. Categorical data Labels or names used to identify an attribute of each element. Categorical data use either the nominal or ordinal scale of measurement and may be nonnumeric or numeric. Quantitative data Numeric values that indicate how much or how many of something. Quantitative data are obtained using either the interval or ratio scale of measurement. Categorical variable A variable with categorical data. Quantitative variable A variable with quantitative data. Cross-sectional data Data collected at the same or approximately the same point in time. Time series data Data collected over several time periods. Descriptive statistics Tabular, graphical, and numerical summaries of data.
  • 22. Population The set of all elements of interest in a particular study. Sample A subset of the population. Census A survey to collect data on the entire population. Sample survey A survey to collect data on a sample. Statistical inference The process of using data obtained from a sample to make estimates or test hypotheses about the characteristics of a population. Aleksandra Pawłowska Data and Statistics Useful tips 1 An observation is the set of measurements obtained for each element in a data set. Hence, the number of observations is always the same as the number of elements. The number of measurements obtained for each element equals the number of variables. Hence, the total number of data items can be determined by multiplying the number of observations by the number of variables. 2 Quantitative data may be discrete or continuous. Quantitative data that measure how many (e.g. number of calls received in 5 minutes) are discrete. Quantitative data that measure how much (e.g. weight or time) are continuous because no separation occurs between the possible data values. Aleksandra Pawłowska Data and Statistics Exercises
  • 23. Aleksandra Pawłowska Data and Statistics Task 1 The U.S. Department of Energy provides fuel economy information for a variety of motor vehicles. A sample of 10 automobiles is shown in Table 1.6 (Fuel Economy website, February 22, 2008). Data show the size of the automobile (compact, midsize, or large), the number of cylinders in the engine, the city driving miles per gallon, the highway driving miles per gallon, and the recommended fuel (diesel, premium, or regular). 1 How many elements are in this data set? 2 How many variables are in this data set? 3 Which variables are categorical and which variables are quantitative? 4 What type of measurement scale is used for each of the variables? Aleksandra Pawłowska Data and Statistics Task 2
  • 24. Refer to Table 1.6. 1 What is the average miles per gallon for city driving? 2 On average, how much higher is the miles per gallon for highway driving as compared to city driving? 3 What percentage of the cars have four-cylinder engines? 4 What percentage of the cars use regular fuel? Aleksandra Pawłowska Data and Statistics Aleksandra Pawłowska Data and Statistics Task 3 Table 1.7 shows data for seven colleges and universities. The en- dowment (in billions of dollars) and the percentage of applicants admitted are shown (USA Today, February 3, 2008). The state each school is located in, the campus setting, and the NCAA Di- vision for varsity teams were obtained from the National Center of Education Statistics website, February 22, 2008. 1 How many elements are in the data set? 2 How many variables are in the data set? 3 Which of the variables are categorical and which are quantitative? Aleksandra Pawłowska Data and Statistics
  • 25. Task 4 Consider the data set in Table 1.7 1 Compute the average endowment for the sample. 2 Compute the average percentage of applicants admitted. 3 What percentage of the schools have NCAA Division III varsity teams? 4 What percentage of the schools have a City: Midsize campus setting? Aleksandra Pawłowska Data and Statistics Task 5 The FinancialTimes/Harris Poll is a monthly online poll of adults from six countries in Europe and the United States. A January poll included 1015 adults in the United States. One of the questions asked was, “How would you rate the Federal Bank in handling the credit problems in the financial markets?” Possible responses were Excellent, Good, Fair, Bad, and Terrible (Harris Interactive website, January 2008). 1 What was the sample size for this survey? 2 Are the data categorical or quantitative? 3 Would it make more sense to use averages or percentages as a
  • 26. summary of the data for this question? 4 Of the respondents in the United States, 10% said the Federal Bank is doing a good job. How many individuals provided this response? Aleksandra Pawłowska Data and Statistics Task 6 The Commerce Department reported receiving the following appli- cations for the Malcolm Baldrige National Quality Award: 23 from large manufacturing firms, 18 from large service firms, and 30 from small businesses. 1 Is type of business a categorical or quantitative variable? 2 What percentage of the applications came from small businesses? Aleksandra Pawłowska Data and Statistics Task 7 State whether each of the following variables is categorical or quan- titative and indicate its measurement scale.
  • 27. 1 Annual sales 2 Soft drink size (small, medium, large) 3 Employee classification (GS1 through GS18) 4 Earnings per share 5 Method of payment (cash, check, credit card) Aleksandra Pawłowska Data and Statistics Aleksandra Pawłowska Data and Statistics Task 8 Figure 1.8 provides a bar chart showing the amount of federal spend- ing for the years 2002 to 2008 (USA Today, February 5, 2008). 1 What is the variable of interest? 2 Are the data categorical or quantitative? 3 Are the data time series or cross-sectional? 4 Comment on the trend in federal spending over time. Aleksandra Pawłowska Data and Statistics Aleksandra Pawłowska Data and Statistics Task 9 The Food and Drug Administration (FDA) reported the number
  • 28. of new drugs approved over an eight-year period (The Wall Street Jour- nal, January 12, 2004). Figure 1.9 provides a bar chart summarizing the number of new drugs approved each year. 1 Are the data categorical or quantitative? 2 Are the data time series or cross-sectional? 3 How many new drugs were approved in 2003? 4 In what year were the fewest new drugs approved? How many? 5 Comment on the trend in the number of new drugs approved by the FDA over the eight-year period. Aleksandra Pawłowska Data and Statistics Task 10 Asample of midterm grades for five students showed the following results: 72, 65, 82, 90, 76. Which of the following statements are correct, and which should be challenged as being too generalized? 1 The average midterm grade for the sample of five students is 77. 2 The average midterm grade for all students who took the exam is 77.
  • 29. 3 An estimate of the average midterm grade for all students who took the exam is 77. 4 More than half of the students who take this exam will score between 70 and 85. 5 If five other students are included in the sample, their grades will be between 65 and 90. Aleksandra Pawłowska Data and Statistics Exploratory Data Analysis Statistics (exercises) Aleksandra Pawłowska May 26, 2020 Glossary Five-number summary An exploratory data analysis technique that uses five numbers to summarize the data: smallest value, first quar- tile, median, third quartile, and largest value. Box plot A graphical summary of data based on a five-number sum- mary. Aleksandra Pawłowska Exploratory Data Analysis
  • 30. Task 1 Consider a sample with data values of 27, 25, 20, 15, 30, 34, 28, and 25. Provide the five-number summary for the data. Aleksandra Pawłowska Exploratory Data Analysis Task 1 – solution Consider a sample with data values of 27, 25, 20, 15, 30, 34, 28, and 25. Provide the five-number summary for the data. five-number summary: 15, 22.5, 26, 29, 34 Aleksandra Pawłowska Exploratory Data Analysis Task 2 Show the box plot for the data in task 1 (use excel). Aleksandra Pawłowska Exploratory Data Analysis Task 2 – solution Show the box plot for the data in task 1 (use excel). Aleksandra Pawłowska Exploratory Data Analysis
  • 31. Task 3 Show the five-number summary and the box plot for the following data: 5, 15, 18, 10, 8, 12, 16, 10, 6. Aleksandra Pawłowska Exploratory Data Analysis Task 3 – solution Show the five-number summary and the box plot for the following data: 5, 15, 18, 10, 8, 12, 16, 10, 6. five-number summary: 5, 8, 10, 15, 18 Aleksandra Pawłowska Exploratory Data Analysis Task 3 – solution Aleksandra Pawłowska Exploratory Data Analysis Task 4 A data set has a first quartile of 42 and a third quartile of 50. Compute the lower and upper limits for the corresponding box plot. Should a data value of 65 be considered an outlier? Aleksandra Pawłowska Exploratory Data Analysis
  • 32. Task 4 – solution A data set has a first quartile of 42 and a third quartile of 50. Compute the lower and upper limits for the corresponding box plot. Should a data value of 65 be considered an outlier? lower limit = 30, upper limit = 62, 65 is an outlier Aleksandra Pawłowska Exploratory Data Analysis Task 5 Annual sales, in millions of dollars, for 21 pharmaceutical companies follow. 1 Provide a five-number summary. 2 Compute the lower and upper limits. 3 Do the data contain any outliers? 4 Johnson & Johnson’s sales are the largest on the list at $14,138 million. Suppose a data entry error (a transposition) had been made and the sales had been entered as $41,138 million. Would the method of detecting outliers in part (c) identify this problem and allow for correction of the data entry error?
  • 33. 5 Show a box plot (use excel). Aleksandra Pawłowska Exploratory Data Analysis Task 5 – solution 1 Provide a five-number summary. 608, 1872, 4019, 8305, 14138 2 Compute the lower and upper limits. lower limit = -7777.5, upper limit = 17954.5 3 Do the data contain any outliers? Data contain no outliers 4 Johnson & Johnson’s sales are the largest on the list at $14,138 million. Suppose a data entry error (a transposition) had been made and the sales had been entered as $41,138 million. Would the method of detecting outliers in part (c) identify this problem and allow for correction of the data entry error? Yes, 41138 would be an outlier, data value would be reviewed and detected 5 Show a box plot. See next slide Aleksandra Pawłowska Exploratory Data Analysis Task 5 – solution Aleksandra Pawłowska Exploratory Data Analysis
  • 34. Measures of Association Between Two Variables Statistics (exercises) Aleksandra Pawłowska Jun 2, 2020 Glossary Covariance A measure of linear association between two variables. Positive values indicate a positive relationship; negative values indi- cate a negative relationship. Correlation coefficient A measure of linear association between two variables that takes on values between -1 and +1. Values near +1 indicate a strong positive linear relationship; values near -1 indicate a strong negative linear relationship; and values near zero indicate the lack of a linear relationship. Aleksandra Pawłowska Measures of Association Between Two Variables Task 1 Five observations taken for two variables follow.
  • 35. 1 Develop a scatter diagram with x on the horizontal axis (use excel). 2 What does the scatter diagram developed in part (a) indicate about the relationship between the two variables? 3 Compute and interpret the sample covariance. 4 Compute and interpret the sample correlation coefficient. Aleksandra Pawłowska Measures of Association Between Two Variables Task 1 – solution Aleksandra Pawłowska Measures of Association Between Two Variables Task 1 – solution 1 What does the scatter diagram developed in part (a) indicate about the relationship between the two variables? negative relationship 2 Compute and interpret the sample covariance. -60 3 Compute and interpret the sample correlation coefficient. -0.97, there is strong negative correlation between x and y Aleksandra Pawłowska Measures of Association Between Two Variables
  • 36. Task 2 Five observations taken for two variables follow. 1 Develop a scatter diagram for these data (use excel). 2 What does the scatter diagram indicate about a relationship between x and y? 3 Compute and interpret the sample covariance. 4 Compute and interpret the sample correlation coefficient. Aleksandra Pawłowska Measures of Association Between Two Variables Task 2 – solution Aleksandra Pawłowska Measures of Association Between Two Variables Task 2 – solution 1 What does the scatter diagram indicate about a relationship between x and y? positive relationship 2 Compute and interpret the sample covariance. 26.5, it suggests positive relationship between x and y 3 Compute and interpret the sample correlation coefficient. 0.69, there is positive (but not strong) linear relationship between x and y
  • 37. Aleksandra Pawłowska Measures of Association Between Two Variables Task 3 Nielsen Media Research provides two measures of the television viewing audience: a television program rating, which is the percentage of households with televisions watching a program, and a television program share, which is the percentage of households watching a program among those with televisions in use. The following data show the Nielsen television ratings and share data for the Major League Baseball World Series over a nine-year period (Associated Press, October 27, 2003). 1 Develop a scatter diagram with rating on the horizontal axis (use excel). 2 What is the relationship between rating and share? Explain. 3 Compute and interpret the sample covariance. 4 Compute the sample correlation coefficient. What does this value tell us about the relationship between rating and share? Aleksandra Pawłowska Measures of Association Between Two Variables Task 3 – solution
  • 38. Aleksandra Pawłowska Measures of Association Between Two Variables Task 3 – solution 1 What is the relationship between rating and share? Explain. positive relationship 2 Compute and interpret the sample covariance. 10, it suggests positive relationship 3 Compute the sample correlation coefficient. What does this value tell us about the relationship between rating and share? 0.99, so that means that there is strong linear positive relationship between rating and share Aleksandra Pawłowska Measures of Association Between Two Variables Task 4 A department of transportation’s study on driving speed and miles per gallon for midsize automobiles resulted in the following data: Compute and interpret the sample correlation coefficient. Aleksandra Pawłowska Measures of Association Between Two Variables
  • 39. Task 4 – solution Compute and interpret the sample correlation coefficient. -0.91, so there is strong linear negative relationship between speed and miles per gallon Aleksandra Pawłowska Measures of Association Between Two Variables Task 5 The Dow Jones Industrial Average (DJIA) and the Standard & Poor’s 500 Index (S&P 500) are both used to measure the performance of the stock market. The DJIA is based on the price of stocks for 30 large companies; the S&P 500 is based on the price of stocks for 500 companies. If both the DJIA and S&P 500 measure the performance of the stock market, how are they correlated? The following data show the daily percent increase or daily percent decrease in the DJIA and S&P 500 for a sample of nine days over a three-month period (The Wall Street Journal, January 15 to March 10, 2006). 1 Show a scatter diagram (use excel). 2 Compute the sample correlation coefficient for these data. 3 Discuss the association between the DJIA and S&P 500. Do
  • 40. you need to check both before having a general idea about the daily stock market performance? Aleksandra Pawłowska Measures of Association Between Two Variables Task 5 – solution Aleksandra Pawłowska Measures of Association Between Two Variables Task 5 – solution 1 Compute the sample correlation coefficient for these data. 0.91 2 Discuss the association between the DJIA and S&P 500. Do you need to check both before having a general idea about the daily stock market performance? there is strong positive linear relationship Aleksandra Pawłowska Measures of Association Between Two Variables The Weighted Mean and Working with Grouped Data
  • 41. Statistics (exercises) Aleksandra Pawłowska Jun 9, 2020 Glossary Weighted mean The mean obtained by assigning each observation a weight that reflects its importance. Grouped data Data available in class intervals as summarized by a frequency distribution. Individual values of the original data are not available. Aleksandra Pawłowska The Weighted Mean and Working with Grouped Data Task 1 Consider the following data and corresponding weights. 1 Compute the weighted mean. 2 Compute the sample mean of the four data values without weighting. Note the difference in the results provided by the two computations. Aleksandra Pawłowska The Weighted Mean and Working with
  • 42. Grouped Data Task 1 – solution 1 Compute the weighted mean. 3.69 2 Compute the sample mean of the four data values without weighting. Note the difference in the results provided by the two computations. 3.175 Aleksandra Pawłowska The Weighted Mean and Working with Grouped Data Task 2 Consider the sample data in the following frequency distribution. 1 Compute the sample mean. 2 Compute the sample variance and sample standard deviation. Aleksandra Pawłowska The Weighted Mean and Working with Grouped Data Task 2 – solution 1 Compute the sample mean. 13 2 Compute the sample variance and sample standard deviation. s2 = 25, s = 5
  • 43. Aleksandra Pawłowska The Weighted Mean and Working with Grouped Data Task 3 The grade point average for college students is based on a weighted mean computation. For most colleges, the grades are given the following data values: A (4), B (3), C (2), D (1), and F (0). After 60 credit hours of course work, a student at State University earned 9 credit hours of A, 15 credit hours of B, 33 credit hours of C, and 3 credit hours of D. 1 Compute the student’s grade point average. 2 Students at State University must maintain a 2.5 grade point average for their first 60 credit hours of course work in order to be admitted to the business college. Will this student be admitted? Aleksandra Pawłowska The Weighted Mean and Working with Grouped Data Task 3 – solution 1 Compute the student’s grade point average. 2.5 2 Students at State University must maintain a 2.5 grade point
  • 44. average for their first 60 credit hours of course work in order to be admitted to the business college. Will this student be admitted? Yes, they will Aleksandra Pawłowska The Weighted Mean and Working with Grouped Data Task 4 Morningstar tracks the total return for a large number of mutual funds. The following table shows the total return and the number of funds for four categories of mutual funds (Morningstar Funds500, 2008). 1 Using the number of funds as weights, compute the weighted average total return for the mutual funds covered by Morningstar. 2 Suppose you had invested $10,000 in mutual funds at the beginning of 2007 and diversified the investment by placing $2000 in Domestic Equity funds, $4000 in International Equity funds, $3000 in Specialty Stock funds, and $1000 in Hybrid funds. What is the expected return on the portfolio? Aleksandra Pawłowska The Weighted Mean and Working with Grouped Data
  • 45. Task 4 – solution 1 Using the number of funds as weights, compute the weighted average total return for the mutual funds covered by Morningstar. 7.83 2 Suppose you had invested $10,000 in mutual funds at the beginning of 2007 and diversified the investment by placing $2000 in Domestic Equity funds, $4000 in International Equity funds, $3000 in Specialty Stock funds, and $1000 in Hybrid funds. What is the expected return on the portfolio? 12.27 Aleksandra Pawłowska The Weighted Mean and Working with Grouped Data Task 5 Based on a survey of 425 master’s programs in business administration, the U. S. News & World Report ranked the Indiana University Kelley Business School as the 20th best business program in the country (America’s Best Graduate Schools, 2009). The ranking was based in part on surveys of business school deans and corporate recruiters. Each survey respondent was asked to rate the overall academic quality of the master’s program on a scale from 1 „marginal” to 5 „outstanding”. Use the sample of responses shown below to compute the weighted mean score for the business school deans and the corporate recruiters. Discuss.
  • 46. Aleksandra Pawłowska The Weighted Mean and Working with Grouped Data Task 5 – solution x̄ deans = 3.8, x̄ recruiters = 3.7. Aleksandra Pawłowska The Weighted Mean and Working with Grouped Data Index Numbers Statistics (exercises) Aleksandra Pawłowska Jun 16, 2020 Task 1 The median sales prices for new single-family houses for the years 2004–2007 are as follows (Census Bureau website, March 19, 2009). 1 Use 2004 as the base year and develop a price index for new single-family homes over this four-year period. 2 Use 2005 as the base year and develop a price index for new
  • 47. single-family homes over this four-year period. Aleksandra Pawłowska Index Numbers Task 1 – solution 1 Use 2004 as the base year and develop a price index for new single-family homes over this four-year period. 100, 109, 111.5, 112.2 2 Use 2005 as the base year and develop a price index for new single-family homes over this four-year period. 91.7, 100, 102.3, 102.9 Aleksandra Pawłowska Index Numbers Task 2 Nickerson Manufacturing Company has the following data on quan- tities shipped and unit costs for each of its four products: 1 Compute the price relative for each product. 2 Compute a weighted aggregate price index that reflects the shipping cost change over the four-year period. Aleksandra Pawłowska Index Numbers Task 2 – solution
  • 48. 1 Compute the price relative for each product. 151.4, 196.9, 142.6, 177.5 2 Compute a weighted aggregate price index that reflects the shipping cost change over the four-year period. 170 Aleksandra Pawłowska Index Numbers Task 3 Use the price data in task 2 to compute a Paasche index for the shipping cost if 2009 quantities are 4000, 3000, 7500, and 3000 for each of the four products. Aleksandra Pawłowska Index Numbers Task 3 – solution Use the price data in task 2 to compute a Paasche index for the shipping cost if 2009 quantities are 4000, 3000, 7500, and 3000 for each of the four products. 163.7 Aleksandra Pawłowska Index Numbers Task 4 Consider the following price relatives and quantity information
  • 49. for grain production in Iowa (Census Bureau website, March 19, 2009). What is the 2007 weighted aggregate price index for the Iowa grains? Aleksandra Pawłowska Index Numbers Task 4 – solution What is the 2007 weighted aggregate price index for the Iowa grains? 182.8 Aleksandra Pawłowska Index Numbers Measures of Location Statistics (exercises) Aleksandra Pawłowska April 28, 2020 Glossary (part 1) Sample statistic A numerical value used as a summary measure for a sample (e.g. the sample mean, x̄ , the sample variance, s2, and
  • 50. the sample standard deviation, s). Population parameter A numerical value used as a summary measure for a population (e.g. the population mean, µ). Point estimator The sample statistic, when used to estimate the corresponding population parameter. Mean A measure of central location computed by summing the data values and dividing by the number of observations. Aleksandra Pawłowska Measures of Location Glossary (part 2) Median A measure of central location provided by the value in the middle when the data are arranged in ascending order. Mode A measure of location, defined as the value that occurs with greatest frequency. Percentile A value such that at least p percent of the observations are less than or equal to this value and at least (100− p) percent of the observations are greater than or equal to this value. The 50th percentile is the median. Quartiles The 25th, 50th, and 75th percentiles, referred to as the first quartile, the second quartile (median), and third quartile, re- spectively. The quartiles can be used to divide a data set into four parts, with each part containing approximately 25% of the data.
  • 51. Aleksandra Pawłowska Measures of Location Task 1 Consider a sample with data values of 10, 20, 12, 17 and 16. Com- pute the mean and median. Aleksandra Pawłowska Measures of Location Task 1 – solution Consider a sample with data values of 10, 20, 12, 17 and 16. Com- pute the mean and median. mean = x̄ = 15, median = 16 Aleksandra Pawłowska Measures of Location Task 2 Consider a sample with data values of 10, 20, 21, 17, 16, and 12. Compute the mean and median. Aleksandra Pawłowska Measures of Location Task 2 – solution
  • 52. Consider a sample with data values of 10, 20, 21, 17, 16, and 12. Compute the mean and median. mean = x̄ = 16, median = 16.5 Aleksandra Pawłowska Measures of Location Task 3 Consider a sample with data values of 27, 25, 20, 15, 30, 34, 28, and 25. Compute the 20th, 25th, 65th, and 75th percentiles. Aleksandra Pawłowska Measures of Location Task 3 – solution Consider a sample with data values of 27, 25, 20, 15, 30, 34, 28, and 25. Compute the 20th, 25th, 65th, and 75th percentiles. 20th percentile = 20, 25th percentile = 22.5, 65th percentile = 28, 75th percentile = 29. Aleksandra Pawłowska Measures of Location Task 4 Consider a sample with data values of 53, 55, 70, 58, 64, 57, 53, 69, 57, 68, and 53. Compute the mean, median, and mode.
  • 53. Aleksandra Pawłowska Measures of Location Task 4 – solution Consider a sample with data values of 53, 55, 70, 58, 64, 57, 53, 69, 57, 68, and 53. Compute the mean, median, and mode. mean = x̄ = 59.73, median = 57, mode = 53 Aleksandra Pawłowska Measures of Location Task 5 The Dow Jones Travel Index reported what business travelers pay for hotel rooms per night in major U.S. cities (The Wall Street Journal, January 16, 2004). The average hotel room rates for 20 cities are presented on the next slide. 1 What is the mean hotel room rate? 2 What is the median hotel room rate? 3 What is the mode? 4 What is the first quartile? 5 What is the third quartile? Aleksandra Pawłowska Measures of Location Aleksandra Pawłowska Measures of Location
  • 54. Task 5 – solution 1 What is the mean hotel room rate? 159.05 2 What is the median hotel room rate? 161 3 What is the mode? 167 4 What is the first quartile? 136.5 5 What is the third quartile? 170 Aleksandra Pawłowska Measures of Location Task 6 During the 2007–2008 NCAA college basketball season, men’s basketball teams attempted an all-time high number of 3-point shots, averaging 19.07 shots per game (Associated Press Sports, January 24, 2009). In an attempt to discourage so many 3-point shots and encourage more inside play, the NCAA rules commit- tee moved the 3-point line back from 19 feet, 9 inches to 20 feet, 9 inches at the beginning of the 2008–2009 basketball season. Shown in the following table are the 3-point shots taken and the 3-point shots made for a sample of 19 NCAA basketball games during the 2008–2009 season (see next slide). 1 What is the mean number of 3-point shots taken per game? 2 What is the mean number of 3-point shots made per game? 3 Using the closer 3-point line, players were making 35.2% of their shots.
  • 55. What percentage of shots were players making from the new 3- point line? 4 What was the impact of the NCAA rules change that moved the 3-point line back to 20 feet, 9 inches for the 2008–2009 season? Would you agree with the Associated Press Sports article that stated, „Moving back the 3-point line hasn’t changed the game dramatically”? Explain. Aleksandra Pawłowska Measures of Location Aleksandra Pawłowska Measures of Location Task 6 – solution 1 What is the mean number of 3-point shots taken per game? 18.42 2 What is the mean number of 3-point shots made per game? 6.32 3 Using the closer 3-point line, players were making 35.2% of their shots. What percentage of shots were players making from the new 3-point line? 34.3% 4 What was the impact of the NCAA rules change that moved the 3-point line back to 20 feet, 9 inches for the 2008–2009 season? Would you agree with the Associated Press Sports article that stated, „Moving back the 3-point line hasn’t
  • 56. changed the game dramatically”? Explain. Yes, agree but not dramatically. Reductions of only 0.65 shots and 0.9 percentage points for made shots per game Aleksandra Pawłowska Measures of Location Task 7 The cost of consumer purchases such as single-family housing, gasoline, Internet services, tax preparation, and hospitalization were provided in The Wall-Street Journal (January 2, 2007). Sample data typical of the cost of tax-return prepa- ration by services such as H&R Block are: 1 Compute the mean, median, and mode. 2 Compute the first and third quartiles. 3 Compute and interpret the 90th percentile. Aleksandra Pawłowska Measures of Location Task 7 – solution 1 Compute the mean, median, and mode. mean = 160, median = 135, mode = 120 2 Compute the first and third quartiles. Q1 = 115, Q3 = 187.5 3 Compute and interpret the 90th percentile. 90th percentile = 245. 90% of the tax returns cost $245 or less.
  • 57. Aleksandra Pawłowska Measures of Location Measures of Distribution Shape and Detecting Outliers Statistics (exercises) Aleksandra Pawłowska May 19, 2020 Glossary Skewness A measure of the shape of a data distribution. Data skewed to the left result in negative skewness; a symmetric data distribution results in zero skewness; and data skewed to the right result in positive skewness. z-score A value computed by dividing the deviation about the mean (xi − x̄ ) by the standard deviation s. A z-score is referred to as a standardized value and denotes the number of standard deviations xi is from the mean. Chebyshev’s theorem A theorem that can be used to make statements about the proportion of data values that must be within a specified number of standard deviations of the mean. Empirical rule A rule that can be used to compute the percentage of data values
  • 58. that must be within one, two, and three standard deviations of the mean for data that exhibit a bell-shaped distribution. Outlier An unusually small or unusually large data value. Aleksandra Pawłowska Measures of Distribution Shape and Detecting Outliers Task 1 Consider a sample with data values of 10, 20, 12, 17, and 16. Com- pute the z-score for each of the five observations. Aleksandra Pawłowska Measures of Distribution Shape and Detecting Outliers Task 1 – solution Consider a sample with data values of 10, 20, 12, 17, and 16. Com- pute the z-score for each of the five observations. z1 = −1.25, z2 = 1.25, z3 = −0.75, z4 = 0.5, z5 = 0.25 Aleksandra Pawłowska Measures of Distribution Shape and Detecting Outliers Task 2 Consider a sample with a mean of 500 and a standard deviation
  • 59. of 100. What are the z-scores for the following data values: 520, 650, 500, 450, and 280? Aleksandra Pawłowska Measures of Distribution Shape and Detecting Outliers Task 2 – solution Consider a sample with a mean of 500 and a standard deviation of 100. What are the z-scores for the following data values: 520, 650, 500, 450, and 280? z1 = 0.2, z2 = 1.5, z3 = 0, z4 = −0.5, z5 = −2.2 Aleksandra Pawłowska Measures of Distribution Shape and Detecting Outliers Task 3 Consider a sample with a mean of 30 and a standard deviation of 5. Use Chebyshev’s theorem to determine the percentage of the data within each of the following ranges: 1 20 to 40 2 15 to 45 3 22 to 38 4 18 to 42 5 12 to 48
  • 60. Aleksandra Pawłowska Measures of Distribution Shape and Detecting Outliers Task 3 – solution 1 20 to 40 75% 2 15 to 45 89% 3 22 to 38 61% 4 18 to 42 83% 5 12 to 48 92% Aleksandra Pawłowska Measures of Distribution Shape and Detecting Outliers Task 4 Suppose the data have a bell-shaped distribution with a mean of 30 and a standard deviation of 5. Use the empirical rule to determine the percentage of data within each of the following ranges: 1 20 to 40 2 15 to 45 3 25 to 35 Aleksandra Pawłowska Measures of Distribution Shape and Detecting Outliers Task 4 – solution
  • 61. 1 20 to 40 95% 2 15 to 45 almost 100% 3 25 to 35 68% Aleksandra Pawłowska Measures of Distribution Shape and Detecting Outliers Task 5 The results of a national survey showed that on average, adults sleep 6.9 hours per night. Suppose that the standard deviation is 1.2 hours. 1 Use Chebyshev’s theorem to calculate the percentage of individuals who sleep between 4.5 and 9.3 hours. 2 Use Chebyshev’s theorem to calculate the percentage of individuals who sleep between 3.9 and 9.9 hours. 3 Assume that the number of hours of sleep follows a bell-shaped distribution. Use the empirical rule to calculate the percentage of individuals who sleep between 4.5 and 9.3 hours per day. How does this result compare to the value that you obtained using Chebyshev’s theorem in part (a)? Aleksandra Pawłowska Measures of Distribution Shape and Detecting Outliers Task 5 – solution 1 Use Chebyshev’s theorem to calculate the percentage of
  • 62. individuals who sleep between 4.5 and 9.3 hours. 75% 2 Use Chebyshev’s theorem to calculate the percentage of individuals who sleep between 3.9 and 9.9 hours. 84% 3 Assume that the number of hours of sleep follows a bell-shaped distribution. Use the empirical rule to calculate the percentage of individuals who sleep between 4.5 and 9.3 hours per day. How does this result compare to the value that you obtained using Chebyshev’s theorem in part (1)? 95%; if we assume, that data are distributed symetrically, then more observations are closer to the mean Aleksandra Pawłowska Measures of Distribution Shape and Detecting Outliers Task 6 The Energy Information Administration reported that the mean re- tail price per gallon of regular grade gasoline was $2.05 (Energy Information Administration, May 2009). Suppose that the standard deviation was $0.10 and that the retail price per gallon has a bell- shaped distribution. 1 What percentage of regular grade gasoline sold between $1.95 and $2.15 per gallon? 2 What percentage of regular grade gasoline sold between $1.95 and $2.25 per gallon?
  • 63. 3 What percentage of regular grade gasoline sold for more than $2.25 per gallon? Aleksandra Pawłowska Measures of Distribution Shape and Detecting Outliers Task 6 – solution 1 What percentage of regular grade gasoline sold between $1.95 and $2.15 per gallon? 68% 2 What percentage of regular grade gasoline sold between $1.95 and $2.25 per gallon? 81.5% 3 What percentage of regular grade gasoline sold for more than $2.25 per gallon? 2.5% Aleksandra Pawłowska Measures of Distribution Shape and Detecting Outliers Task 7 The national average for the math portion of the College Board’s Scholastic Aptitude Test (SAT) is 515 (The World Almanac, 2009). The College Board periodically rescales the test scores such that the standard deviation is approximately 100. Answer the following questions using a bell-shaped distribution and the empirical rule for the verbal test scores.
  • 64. 1 What percentage of students have an SAT verbal score greater than 615? 2 What percentage of students have an SAT verbal score greater than 715? 3 What percentage of students have an SAT verbal score between 415 and 515? 4 What percentage of students have an SAT verbal score between 315 and 615? Aleksandra Pawłowska Measures of Distribution Shape and Detecting Outliers Task 7 – solution 1 What percentage of students have an SAT verbal score greater than 615? 16% 2 What percentage of students have an SAT verbal score greater than 715? 2.5% 3 What percentage of students have an SAT verbal score between 415 and 515? 34% 4 What percentage of students have an SAT verbal score between 315 and 615? 81.5% Aleksandra Pawłowska Measures of Distribution Shape and Detecting Outliers