SlideShare a Scribd company logo
1 of 88
TableOfContentsTable of contents with hyperlinks for this
documentExcluding standard worksheets that come with the
original dataSheet namePurposeNotesOnDataPrep!A1Tips and
tricks for students in doing data analysis in
ExcelSalaryPivotTable!A1Using a histogram of salary to
compare other variables in terms of chunks of
salaryDescriptiveStatsForFrequency!A1Example of producing
descriptive stats for chunks of a numeric variable (grouping,
frequency table as
'categories')VariableDescriptiveStatsPHStat!A1Example of
descriptive stats produced by PHStat and then edited, items
removed that are not neededCorrelations!A1Instructor reference
for how all variables are inter-
relatedRegressionAge!A1Example of regression output
highighting output to pay attention
toSPSSRegressionAllEnter!A1Instructor reference - regressing
salary on all independent variables to discern stongest,
independent
predictorsPivotTableCreatePercentPolygon!A1Example of
comparing distributions between two categories with different
number of cases or different scales, i.e., version of percent
polygonAnalysis resultsGender univariate descriptive
statisticsGenderAnalysis!A1Gender/Salary; Gender/Job Grade
Classification analysis; Gender/other independent variables
Salary histogram, distributionCompare gender/salary descriptive
statisticsGenderCompareDescriptives!A1Comparison Table
gender descriptive statistics in terms of all variables. This
might be something worth
doing.EthnicitySalaryAnalysis!A1Ethnicity/Salary
analysisOptionalEthnicitySalaryAnalysis!A1Optional
ethnicity/salary analysis - distribution of ethnicity over chunks
of salary, percent
polygonEthnicityJGClassAnalysis!A1Ethnicity/Job Grade
Classification analysisAgeSalaryAnalysis!A1Age/Salary
analysisAgeJobGradeClassAnalysis!A1Age/Job grade
classification analysisYearsWorkedSalaryAnalysis!A1Years
worked/Salary analysisYears worked/Job grade classification
analysisRelationship between endogenous variablesJob grade
classification/Salary analysisRelationship between independent
variablesPercentPolygonGenderYearsWorked!A1Compare years
worked distribution by gender; Example of comparing
distributions between two categories with different number of
cases or different scales, i.e., version of percent polygon
Standard sheets that come with the dataVariable
INFO'!A1Information on variablesHuman Resources
DATA'!A1DataCross-Class-Table'!A1Summary
Table'!A1Histogram!A1% Polygons 2 Groups'!A1Freq. & %
Distribution'!A1
Variable INFOTableOfContents!A1The data are a random
sample of 120 responses to a survey conducted by the VP of
Human Resources at a large company.Source:INFO 501 class at
Montclair State UniversityVariablesSalaryin thousands of
dollars (K)Age in years YrsWorkin years JGClassjob-grade
classification of 1, 3, 5, 7, 9, 11 (lowest skill job to highest
skill job)Ethnicity1=Minority0=Not MinorityGender(Male,
Female)Named ranges created in this worksheet - use these
names to address the data more quickly then manually selecting
dataUse the name of the range in dialog boxes rather than
clicking and dragging ranges.Example of using names instead of
manual ranges:50681.1320754717Female
salary56465.671641791male salary-10%Percent difference
Human Resources
DATATableOfContents!A1SalaryAgeYrsWorkJGClassEthnicity
CODEGender
codeEthnicityGender$31,200191310MinorityFemale$40,400283
300Not
MinorityFemale$42,600293510MinorityFemale$39,800262500N
ot
MinorityFemale$33,300222310MinorityFemale$35,600284300N
ot
MinorityFemale$34,200386310MinorityFemale$43,600353500N
ot
MinorityFemale$37,600285510MinorityFemale$34,600276310M
inorityFemale$37,700361300Not
MinorityFemale$48,100283500Not
MinorityFemale$38,900362500Not
MinorityFemale$46,7003310510MinorityFemale$58,000493900
Not MinorityFemale$52,200386500Not
MinorityFemale$46,500453700Not
MinorityFemale$52,300472700Not
MinorityFemale$50,000308500Not
MinorityFemale$54,200396710MinorityFemale$47,0006010500
Not MinorityFemale$57,500473700Not
MinorityFemale$47,700624900Not
MinorityFemale$49,000399500Not
MinorityFemale$70,100535700Not
MinorityFemale$60,000577700Not
MinorityFemale$48,600432700Not
MinorityFemale$57,000615700Not
MinorityFemale$57,700337700Not
MinorityFemale$47,800448700Not
MinorityFemale$47,600513500Not
MinorityFemale$59,000496900Not
MinorityFemale$72,000473700Not
MinorityFemale$43,500537710MinorityFemale$70,0003912900
Not MinorityFemale$54,100483500Not
MinorityFemale$55,500495500Not
MinorityFemale$60,000546700Not
MinorityFemale$52,300484300Not
MinorityFemale$67,000505700Not
MinorityFemale$58,0005015710MinorityFemale$38,700503300
Not MinorityFemale$62,100513700Not
MinorityFemale$65,500539900Not
MinorityFemale$43,200623500Not
MinorityFemale$67,50057121110MinorityFemale$56,70056670
0Not MinorityFemale$39,600583500Not
MinorityFemale$39,2006014500Not
MinorityFemale$58,500618700Not
MinorityFemale$39,800645500Not
MinorityFemale$67,500662900Not
MinorityFemale$68,900675900Not
MinorityFemale$39,600241501Not
MinorityMale$33,400202311MinorityMale$42,100242511Minor
ityMale$54,100311711MinorityMale$46,100274501Not
MinorityMale$56,300392711MinorityMale$45,600373511Minor
ityMale$48,500352711MinorityMale$54,600307701Not
MinorityMale$50,100394701Not
MinorityMale$47,100376501Not
MinorityMale$46,800402501Not
MinorityMale$44,100283711MinorityMale$56,100424701Not
MinorityMale$37,500315301Not
MinorityMale$45,500339501Not
MinorityMale$43,500599711MinorityMale$45,000495701Not
MinorityMale$67,500587701Not
MinorityMale$62,000546911MinorityMale$56,700414701Not
MinorityMale$48,100326301Not
MinorityMale$45,000502711MinorityMale$50,000455711Minor
ityMale$75,5004012901Not
MinorityMale$66,0005641111MinorityMale$62,2004014911Min
orityMale$47,500595711MinorityMale$53,000568501Not
MinorityMale$56,700487701Not
MinorityMale$54,900423501Not
MinorityMale$53,200384711MinorityMale$45,600369711Minor
ityMale$56,300492501Not MinorityMale$43,300492301Not
MinorityMale$46,400365711MinorityMale$64,300543501Not
MinorityMale$61,000367901Not
MinorityMale$48,100389711MinorityMale$38,600486511Minor
ityMale$56,0004714711MinorityMale$60,500519701Not
MinorityMale$64,500497711MinorityMale$52,500519501Not
MinorityMale$79,00052151101Not
MinorityMale$76,500527901Not
MinorityMale$60,000499901Not
MinorityMale$62,500548911MinorityMale$72,20055151111Min
orityMale$61,500569701Not MinorityMale$68,7005610901Not
MinorityMale$82,30057151101Not
MinorityMale$67,800575901Not
MinorityMale$61,0005812711MinorityMale$67,800597911Mino
rityMale$81,10059151101Not MinorityMale$45,6006016501Not
MinorityMale$77,50062101101Not
MinorityMale$68,000639901Not
MinorityMale$73,00063151101Not
MinorityMale$68,000688901Not
MinorityMale$43,2006910501Not
MinorityMale$76,000709901Not
MinorityMale$69,5007118901Not
MinorityMale$39,900728511MinorityMale$64,2007315911Mino
rityMale$46,5007410501Not MinorityMale
NotesOnDataPrepTips and tricks1. It will make the student's life
easier to create named ranges in the data for the ranges they
need. Simply sort, highlight the range, and in the box upper
left, type in a name. Use that name in functions and formulas
(e.g., quartile(), or descriptive stats - you can use named ranges
in PHStat and Data Analysis Toolpack)2. Note that Pivot tables
can provide all descriptive statistics except median, quartiles,
IQR. If Zscores indicate that there is an outlier on one side,
students should not be using the mean, but as a work around,
you can ask them to note that, discuss what it means and then
use the mean/SD anyway; OR you can require them to manually
create those separately from the pivot table (or don't use a pivot
table, use the data analysis toolpack or PHSTat).3. Instructions
for producing a histogram/frequency table with a Pivot Table:a.
Create a pivot table using the numeric variable (age) as the row
labelb. Group the row label - Group button on ribbon. Choose
chunks in dialog box.make sure you click in the data, not the
header, or the button will be greyed outPlay with the beginning,
end value and chunks to make bins common sense, i.e., 1-10,
not 1-11c. Add anything you want to the Values box. Add items
multiple times to get multiple stats about the same item.d. To
work with data, it is frequently easier to copy pivot table data
and paste as - paste as values.e. Word of warning: If you divide
data into subcategories - chunks of salary for women, men - if
there are no values for a category, Excel won't list it - you have
to manually put a zero in for the value.4. Getting Excel stuff
into Word for a report: It might be easier to paste as a picture
object - easier to manipulate.
PercentDifferenceCount of GenderColumn LabelsRow
LabelsFemaleMaleGrand
Total316.98%5.97%10.83%533.96%25.37%29.17%733.96%35.8
2%35.00%913.21%22.39%18.33%111.89%10.45%6.67%Grand
Total100.00%100.00%100.00%Count of GenderColumn
LabelsRow
LabelsFemaleMale317%6%96%534%25%29%734%36%5%913
%22%52%112%10%139%
Percent difference in Male to female
Proportions
3 5 7 9 11 0.95950920245398763
0.28951115329852861 5.3268765133171914E-2
0.51582278481012667 1.3881278538812787 3 5
7 9 11 3 5 7 9 11
3 5 7 9 11 1
Job Levels
LevelGenderRow LabelsAverage of
Salary338484.6153846154Female37555.5555555556Male40575
546345.7142857143Female45250Male47505.882352941275480
9.5238095238Female57194.4444444444Male53020.8333333333
965740.9090909091Female62371.4285714286Male67313.33333
333331174825Female67500Male75871.4285714286Grand
Total53910.8333333333
Average salary of gender on each level
Total
Female Male Female Male Female Male Female Male
Female Male 3 5 7 9 11
37555.555555555555 40575 45250
47505.882352941175 57194.444444444445
53020.833333333336 62371.428571428572
67313.333333333328 67500 75871.428571428565
BiVariateDistributionChartAverage of SalaryColumn
LabelsRow LabelsFemaleMaleGrand Total30000-
3999936938.46153846153780037177.777777777840000-
4999945878.57142857144568045761.764705882350000-
5999955533.333333333354321.428571428654948.27586206960
000-6999964812.564578.947368421164648.148148148170000-
799997070075671.42857142867418080000-
900008170081700Grand
Total50681.132075471756465.67164179153910.8333333333
Gender average salary comparison by salary level
Female 30000-39999 40000-49999 50000-59999 60000-
69999 70000-79999 80000-90000 36938.461538461539
4587 8.571428571428 55533.333333333336
64812.5 70700 Male 30000-39999 40000-49999
50000-59999 60000-69999 70000-79999 80000-90000
37800 45680 54321.428571428572
64578.947368421053 75671.428571428565 81700
Salary ranges
Average salary
GenderDescriptiveStatsTableOfContents!A1Gender/salary
comparison - descriptive statisticsRun descriptive statistics
twice - once with named range "malesalary" and again with
"femalesalary", then copy and paste them next to each
otherColumn1Column1Comparing male and female salary<==
table title centered across columnsStatisticMaleFemale<==row
headers differentiated from
dataMean56465.671641791Mean50681.1320754717Mean$
56,466$ 50,681<==number formattingStandard
Error1474.68546001Standard Error1515.0288634913Standard
Error$ 1,475$ 1,515<==all statistics that are NOT being used
are REMOVEDMedian56000Median49000Median$ 56,000$
49,000Mode45600Mode39800Standard Deviation$ 12,071$
11,030Standard Deviation12070.8207177324Standard
Deviation11029.5766116484Range$ 48,900$ 40,800Sample
Variance145704712.799638Sample
Variance121651560.232221Minimum$ 33,400$
31,200Kurtosis-0.8044449928Kurtosis-
0.9313514963Maximum$ 82,300$
72,000Skewness0.3244762148Skewness0.1887693789Count675
3Range48900Range40800Minimum33400Minimum31200Maxim
um82300Maximum72000Sum3783200Sum2686100Count67Coun
t53
GenderDescriptiveStats (2)TableOfContents!A1Gender/salary
comparison - descriptive statisticsRun descriptive statistics
twice - once with named range "malesalary" and again with
"femalesalary", then copy and paste them next to each
otherTable 1<== Start with labeleling each table by number,
sequentially (charts too - call them "Figure
x")Column1Column1Comparing male and female salary<==
table title centered across columns or left justified, meaningful,
not abstractStatisticMaleaFemale<==row headers differentiated
from data (bold); lines above and below column
headersMean56465.671641791Mean50681.1320754717Count67
53<==If you want to show subsets of statistics, use an italicized
header, indent followingStandard Error1474.68546001Standard
Error1515.0288634913Measures of central
tendency<==indented to show part of type of
statisticMedian56000Median49000Mean$ 56,466$
50,681<==number formattingMode45600Mode39800Median$
56,000$ 49,000Standard Deviation12070.8207177324Standard
Deviation11029.5766116484Measures of central
variance90%Sample Variance145704712.799638Sample
Variance121651560.232221Standard Deviation$ 12,071$
11,030Kurtosis-0.8044449928Kurtosis-0.9313514963Minimum$
33,400$
31,2000.9375Skewness0.3244762148Skewness0.1887693789Ma
ximum$ 82,300$
72,0000.7162162162Range48900Range40800Range$ 48,900$
40,8000.9137387481Minimum33400Minimum31200Test for
outliersMaximum82300Maximum72000Zscore of Minimum-1.9-
1.8Sum3783200Sum2686100Zscore of
Maximum2.11.9Count67Count53Source: Random sample of
120 RJCorp employees, June 2015<==Note: All statistics that
are NOT being used are REMOVEDa Notation if needed
(superscript used after header "Male" above as an example
SalaryDistributionHistogramTable of contentsSalary
histogram/distributionRow LabelsCount of Salary30000-
399991840000-499993450000-599992960000-699992770000-
799991080000-900002Grand Total120Row LabelsCount of
Salary30-39K1840-49K3450-59K2960-69K2770-79K1080-89K2
Histogram of salary
Total 30000-39999 40000-49999 50000-59999 60000-
69999 70000-79999 80000-90000 18 34 29 27 10
2
Salary levels (in dollars)
Number of employees
Figure 1: Distribution of salaries in RJ Corp
Count of Salary 30-39K 40-49K 50-59K 60-69K
70-79K 80-89K 18 34 29 27 10 2
Salary
Number of employees
GenderDescriptiveStatistics (2Categorical variable descriptive
statistics produced through a pivot tablePivot table outputRow
LabelsCount of GenderCount of
Gender2Female5344.17%12%Male6755.83%Grand
Total120100.00%Copy, paste special, paste as a value:Row
LabelsCount of GenderCount of
Gender2Female530.4416666667Male670.5583333333Grand
Total1201Format in an attractive manner by standards of good
table formatting (see Chapter 9, or PowerPoint)Note: I've used
format as a table from the Home ribbon, the selected "Convert
to Range" button to get rid of special drop downs.Table
1Gender descriptive statistics<==Title centered across columns
or left justified, bold; meaningfulGenderCountPercent of
total<==Column/row headers formatted to distinguish from
data, centeredFemale5344%<==Number formatting used -
percentage formatting in this caseMale6756%Grand
Total120100%0.2641509434
SalaryDescriptiveStatistics (2Table of contentsSalary
descriptive statisticsColumn1Table 2Salary descriptive
statistics<== table title centered across columns or left
justified;
meaningfulMean53910.8333333333StatisticFigures<==row /
column headers differentiated from dataStandard
Error1088.9229612112Mean$ 53,911<==number
formattingMedian53100Median$ 53,100<==all statistics that
are NOT being used are REMOVEDMode48100Standard
Deviation$ 11,929Standard
Deviation11928.5533848133Range$ 51,100Sample
Variance142290385.854342Minimum$ 31,200Kurtosis-
0.6661524346Maximum$
82,300Skewness0.3069257671Count120Range51100Minimum31
200Maximum82300Sum6469300Count120
Formatted output from Data Analysis Toolpack, Descriptive
Statistics function
GenderAgeSalaryAverage of SalaryColumn LabelsAverage of
SalaryColumn LabelsRow LabelsFemaleMaleRow
LabelsFemaleMale<20$31,20030000-
3999936938.46153846153780020-29$39,000$41,06040000-
4999945878.57142857144568030-39$48,564$49,44750000-
5999955533.333333333354321.428571428640-
49$54,873$54,84060000-6999964812.564578.947368421150-
59$56,638$63,91470000-799997070075671.428571428660-
69$52,089$62,55080000-900008170070-80$59,220
Comparing gender average salary by age group
Female < 20 20-29 30-39 40-49 50-59
60-69 70-80 31200 39000
48563.63636363636 54872.727272727272
56638.461538461539 52088.888888888891 Male <
20 20-29 30-39 40-49 50-59 60-69
70-80 41060 49446.666666666664 54840
63914.285714285717 62550 59220
Age groups
Average salary
GenderSalaryAvgRow LabelsAverage of SalaryCount of
SalaryPercent differenceFemale$50,68153-
10.24%Male$56,46667Grand Total$53,911120GenderAverage
of SalaryCount of SalaryPercent differenceFemale$ 50,68153-
10%Male$ 56,46667
Average of Salary Female Male 50681.132075471702
56465.671641791043
AgeAnalysisPivot table producing descriptive statistics for
chunks of age (age histogram)TableOfContents!A1Row
LabelsCount of AgeAverage of SalaryStdDev of SalaryMin of
SalaryMax of
Salary<201$31,200ERROR:#DIV/0!$31,200$31,20020-
2913$39,792$4,773$33,300$48,10030-
3926$49,073$7,724$34,200$70,00040-
4926$54,854$8,235$38,600$75,50050-
5934$61,132$11,434$38,700$82,30060-
6915$56,273$13,295$39,200$77,50070-
805$59,220$15,388$39,900$76,000Grand
Total120$53,911$11,929$31,200$82,300Row LabelsCount of
AgeAverage of SalaryStdDev of SalaryMin of SalaryMax of
Salaryrangecoefficient of variationnegative Zscorepositive
Zscore15-245$ 35,920$ 4,670$ 31,200$ 42,100$
10,90013%-1.011.3225-3417$ 44,888$ 6,832$ 34,600$
57,700$ 23,10015%-1.511.8835-4426$ 51,165$ 9,192$
34,200$ 75,500$ 41,30018%-1.852.6545-5435$ 56,926$
9,876$ 38,600$ 79,000$ 40,40017%-1.862.2455-6428$
59,293$ 12,956$ 39,200$ 82,300$ 43,10022%-1.551.7865-
759$ 60,411$ 13,371$ 39,900$ 76,000$ 36,10022%-
1.531.17Instructions:1. Create a pivot table using the numeric
variable (age) as the row label2. Group the row label - Group
button on ribbon. Choose chunks in dialog box.3. Add anything
you want to the Values box. Add items multiple times to get
multiple stats about the same item.4. To work with data, it is
frequently easier to copy pivot table data and paste as - paste as
values.
copy this, paste as values below
Age Line Fit Plot
Salary 19 28 29 26 22 28 38 35 28 27 36
28 36 33 49 38 45 47 30 39 60 47 62
39 53 57 43 61 33 44 51 49 47 53 39
48 49 54 48 50 50 50 51 53 62 57 56
58 60 61 64 66 67 24 20 24 31 27 39
37 35 30 39 37 40 28 42 31 33 59 49
58 54 41 32 50 45 40 56 40 59 56 48
42 38 36 49 49 36 54 36 38 48 47 51
49 51 52 52 49 54 55 56 56 57 57 58
59 59 60 62 63 63 68 69 70 71 72 73
74 31200 40400 42600 39800 33300
35600 34200 43600 37600 34600 37700
48100 38900 46700 58000 52200 46500
52300 50000 54200 47000 57500 47700
49000 70100 60000 48600 57000 57700
47800 47600 59000 72000 43500 70000
54100 55500 60000 52300 67000 58000
38700 62100 65500 43200 67500 56700
39600 39200 58500 39800 67500 68900
39600 33400 42100 54100 46100 56300
45600 48500 54600 50100 47100 46800
44100 56100 37500 45500 43500 45000
67500 62000 56700 48100 45000 50000
75500 66000 62200 47500 53000 56700
54900 53200 45600 56300 43300 46400
64300 61000 48100 38600 56000 60500
64500 52500 79000 76500 60000 62500
72200 61500 68700 82300 67800 61000
67800 81100 45600 77500 68000 73000
68000 43200 76000 69500 39900 64200
46500 Predicted Salary 19 28 29 26 22 28
38 35 28 27 36 28 36 33 49 38 45 47
30 39 60 47 62 39 53 57 43 61 33 44
51 49 47 53 39 48 49 54 48 50 50 50
51 53 62 57 56 58 60 61 64 66 67 24
20 24 31 27 39 37 35 30 39 37 40 28
42 31 33 59 49 58 54 41 32 50 45 40
56 40 59 56 48 42 38 36 49 49 36 54
36 38 48 47 51 49 51 52 52 49 54 55
56 56 57 57 58 59 59 60 62 63 63 68
69 70 71 72 73 74 1
Age
Salary
Simply create formulas here referencing values to the left
VariableDescriptiveStatsPHStatTableOfContents!A1PHStat
ouput - Descriptive Statistics for
HumanResources.xlsxDescriptive
SummarySalaryAgeYrsWorkJGClassEthnicityGenderMean$53,9
11476.476.620.320.56Median$53,100496701Mode$48,10049370
1Minimum$31,200191300Maximum$82,30074181111Range$51,
1005517811Variance142290385.8543167.781515.94854.59130.
21820.2487Standard
Deviation$11,92912.95313.99362.14270.46710.4987Coeff. of
Variation22.13%27.56%61.76%32.38%147.51%89.31%Skewnes
s0.3069-0.09860.85450.18340.7982-0.2379Kurtosis-0.6662-
0.72830.0532-0.5082-1.3862-
1.9766Count120120120120120120Standard
Error1088.92301.18240.36460.19560.04260.0455Descriptive
statistics
summarySalaryGenderMean$53,9110.56Median$53,1001Mode$
48,1001Minimum$31,2000Maximum$82,3001Range$51,1001Sta
ndard Deviation$11,9290.4987Coeff. of
Variation22.13%89.31%Count120120
Students should get rid of anything that is not covered in the
course and they don't understand in the output.
Tables should have headers differentiated, number formatting
done, centered data.
GenderAnalysisTableOfContents!A1Analysis of varibles in
terms of gender via pivot tableRow LabelsCount of
GenderPercentAverage of SalaryStdDev of SalaryAverage of
AgeAverage of YrsWorkAverage of JGClassAverage of
EthnicityCODEFemale5344.17%$50,681$11,03045.35.36.00.2M
ale6755.83%$56,466$12,07148.37.47.10.4Grand
Total120100.00%$53,911$11,92947.06.56.60.3Instructions:1.
Create a pivot table using the categorical variable (gender) as
the row label2. Add anything you want to the Values box. Add
items multiple times to get multiple stats about the same item.3.
To work with data, it is frequently easier to copy pivot table
data and paste as - paste as values.Descriptive
StatisticsEndogenous variablesOther independent
variablesSalaryJGClassAgeYrsWorkEthnicityCODEFemaleMale
FemaleMaleFemaleMaleFemaleMaleFemaleMaleMean$
50,681$ 56,4665.987.1245.3448.315.307.390.210.40Standard
Error$ 1,515$
1,4750.270.261.721.610.450.530.060.06Median$ 49,000$
56,0005748495700Mode$ 39,800$
45,6005728493900Standard Deviation$ 11,030$
12,0711.992.1412.5513.213.244.300.410.49Range$ 40,800$
48,900884854141711Minimum$ 31,200$
33,4003319201100Maximum$ 72,000$
82,30011116774151811Count53675367536753675367Coefficien
t of
variance22%21%33%30%28%27%61%58%197%123%Zscore
negative$ (1.77)$ (1.91)-1.50-1.92-2.10-2.14-1.33-1.48-0.51-
0.82Zscore positive$ 1.93$
2.142.531.811.731.942.992.471.941.21Quartile 1$ 40,400$
46,25055363834nanaQuartile 3$ 58,000$
65,25079545479nanaInter Quartile Range$ 17,600$
19,00024181645nanaNote: I created special named ranges in the
data to make it easier - e.g., SalaryFemale, SalaryMale
SalaryPivotTableTableOfContents!A1Analysis of variables in
terms of chunks of salaryRow LabelsCount of SalaryAverage of
AgeAverage of EthnicityCODEAverage of Gender codeAverage
of YrsWorkAverage of JGClass30000-
399991838.170.440.284.224.0040000-
499993443.650.380.595.595.7150000-
599992944.930.240.485.556.4560000-
699992756.190.330.708.008.3370000-
799991053.300.100.7010.309.4080000-
89999258.000.001.0015.0011.00Grand
Total120470.31666666670.55833333336.46666666676.6166666
667Instructions:1. Create a pivot table using the numeric
variable (age) as the row label2. Group the row label - Group
button on ribbon. Choose chunks in dialog box.3. Add anything
you want to the Values box. Add items multiple times to get
multiple stats about the same item.4. To work with data, it is
frequently easier to copy pivot table data and paste as - paste as
values.
GenderCompareDescriptivesTableOfContents!A1Table
comparing descriptve statistics for all variables in terms of
genderSalaryAgeYrsWorkJGClassEthnicityCODEFemaleMaleFe
maleMaleFemaleMaleFemaleMaleFemaleMaleMean$ 50,681$
56,46645.348.35.37.46.07.10.20.4Standard Error$ 1,515$
1,4751.71.60.40.50.30.30.10.1Median$ 49,000$
56,0004849575700Mode$ 39,800$
45,6002849395700Standard Deviation$ 11,030$
12,07112.513.23.24.32.02.10.40.5Sample
Variance121651560.232221145704712.799638157.38243831641
74.551786521910.522496371618.5137946633.94194484764.591
5875170.16763425250.2442333786Kurtosis-0.9313514963-
0.8044449928-0.92511818-0.68184286471.0936677151-
0.4368448489-0.4548349394-0.56765894360.2105423988-
1.8936805556Skewness0.18876937890.3244762148-
0.2357663046-
0.04283899741.17274434330.57474266330.21092724420.10688
051461.48460232580.4046946723Range$ 40,800$
48,900485414178811Minimum$ 31,200$
33,4001920113300Maximum$ 72,000$
82,30067741518111111Sum26861003783200240332372814953
174771127Count53675367536753675367MaleSalaryAgeYrsWor
kJGClassEthnicityCODEMean56465.671641791Mean48.313432
8358Mean7.3880597015Mean7.1194029851Mean0.4029850746
Standard Error1474.68546001Standard
Error1.6140788534Standard Error0.5256665231Standard
Error0.2617845621Standard
Error0.0603761071Median56000Median49Median7Median7Med
ian0Mode45600Mode49Mode9Mode7Mode0Standard
Deviation12070.8207177324Standard
Deviation13.211804817Standard
Deviation4.3027659317Standard
Deviation2.1427989913Standard Deviation0.4941997355Sample
Variance145704712.799638Sample
Variance174.5517865219Sample Variance18.513794663Sample
Variance4.591587517Sample Variance0.2442333786Kurtosis-
0.8044449928Kurtosis-0.6818428647Kurtosis-
0.4368448489Kurtosis-0.5676589436Kurtosis-
1.8936805556Skewness0.3244762148Skewness-
0.0428389974Skewness0.5747426633Skewness0.1068805146Sk
ewness0.4046946723Range48900Range54Range17Range8Range
1Minimum33400Minimum20Minimum1Minimum3Minimum0Ma
ximum82300Maximum74Maximum18Maximum11Maximum1Su
m3783200Sum3237Sum495Sum477Sum27Count67Count67Coun
t67Count67Count67
PivotTableCreatePercentPolygonTableOfContents!A1Pivot table
used to create percent polygon - comparing percents of males
vs. females in terms of chunks of ageRow LabelsCount of
AgeCount of Age2Female5344.17%FemaleMale<2011.89%15-
243.77%4.48%20-29815.09%25-3418.87%10.45%30-
391120.75%35-4418.87%23.88%40-491120.75%45-
5433.96%25.37%50-591324.53%55-6420.75%25.37%60-
69916.98%65-753.77%10.45%Male6755.83%20-2957.46%30-
391522.39%40-491522.39%50-592131.34%60-6968.96%70-
8057.46%Grand Total120100.00%Instructions1. Pivot table
created using gender and then age as row labels2. Group age
row labels3. Create a count column (not necessary)4. Drag age
again to the values box. 5. Chage values - click Show Values
As, choose Percent Of Parent Row Total6. Copy data, paste as
values, then create a line chart with that- you will have to check
the row labels - if there are no values in a chunk, Excel will not
…
StudentSurveyVariableListVariables and measures Count=192
casesSurveys from semesters Fall 16 through Spring 17, from
Prof. William Colucci and Daphne Hanrahan's BUGN280
coursesVariable labelVariable full referenceScale (if any)type
of variabledateWhen the survey was taken
nanominalClassLevelWhat is your class designation?nanominal
or ordinalGenderWhat is your gender?nanominalTransferIs
Montclair the only college you have attended,or are you a
transfer student?nanominalFullPartTimeAre you a full-time or
part-time student at MSU?nanominalClassesTakingHow many 3-
credit classes are you taking this
semester?naordinalHoursWorkHow many hours/week do you
work? Answer with an average. Please use only numbers, e.g. 5,
11, etc.naordinalWhat is your majorWhat is your
major?nanominalChoiceOfMajorHow strongly do you feel about
your choice of major? On a scale of 1 to 7, 1 is uncertain and 7
is very enthousiatic/passionate.On a scale of 1 to 7, 1 is
uncertain and 7 is very
enthousiatic/passionate.nominalHSAverageGradeWhat is your
overall average high school
grade?nanumericMontclairGPAWhat is your Montclair
GPA?nanumericAgeWhat is your age? Use numbers
only.nanumericComputerTypeIs your primary school computer a
PC or Mac?nanumericConfidentStatsHow confident are you of
your mastery of business statistics now that you have taken
INFO 240 (or equivelent for transfer students)?1 is not at all
confident and 7 is extremely
confident.numericConfidentWritingHow confident are you of
your mastery of business writing now that you have taken the
prerequisite writing course?1 is not at all confident and 7 is
extremely confident.numericConfidentSpeakingHow confident
are you of your mastery of public speaking? 1 is not at all
confident and 7 is extremely
confident.numericInterestInCampaignHow interested are/were
you in the 2016 Presidential campaign? 1 is not at all interested
and 7 is extremely passionate.nominalPartyWhat political party
do you identify with?nanominalHaveVotedHave you ever
voted?nanominalWillVoteWill you vote in the presidential
election?nanominalHoursStudyPerWeekHow many hours do you
study for all courses per week on
average?nanumericCommuteDormDo you commute or live in a
dorm?nacategoricalMediaWhich media do you use the
most?nanominal
StudentSurveyDatasectionsection_idsubmitted4719453: What is
your class designation?4719454: What is your gender?4719455:
Is Montclair the only college you have attended, or are you a
transfer student?4719469: Do you commute or live in a
dorm?4719456: Are you a full-time or part-time student at
MSU?4719458: How many hours/week do you work for pay?
 Answer with an average.  4719457: How many 3-credit
classes are you taking this semester?4719459: What is your
major?4719460: How strongly do you feel about your choice of
major? Â On a scale of 1 to 7, 1 is uncertain and 7 is very
enthousiatic/passionate.4719462: What is your Montclair
GPA?4719461: What is your overall average high school
grade?4719463: What is your age? Use numbers only.4719464:
Is your primary school computer a PC or Mac?4719465: How
confident are you of your mastery of business statistics now that
you have taken INFO 240 (or equivelent for transfer students)?
 1 is not at all confident and 7 is extremely
confident.4719466: How confident are you of your mastery of
business writing now that you have taken the prerequisite
writing course? Â 1 is not at all confident and 7 is extremely
confident.
4719467: How confident are you of your mastery of public
speaking? Â 1 is not at all confident and 7 is extremely
confident.
4719468: How many hours a week do you study on average?Â
Please use numbers only.4719470:
Which media do you use the most?
Check the box next to each media you use at least a couple of
times a week.
4719471: Did you vote in the last presidential
election?4719472: Have you ever
voted?ElectionInterestNOTICE THERE IS AN EMPTY ROW
BELOW THIS ROW - AN EMPTY ROW/COLUMN AROUND
A CONTINUOUS BODY OF DATA IS AUTOMATICALLY
RECOGNIZED BY EXCEL AS THE DATA YOU ARE GOING
TO ADDRESS WITH A PIVOT TABLE (UNLESS YOU HAVE
HIGHLIGHTED A FEW CELLS - SO JUST CLICK ON ONE
CELL IN THE BODY OF THE DATA TO START A PIVOT
TABLE.sectionsection_idsubmittedClassClassNumGenderGende
rNumTransferTransferNumCommuteDormCommuteDormNumF
TPTHoursPayClassesNumMajorMajorFeelMSUGPAHSAverage
AgePCMacConfStatsConfWritingConfSPeakingHoursStudyWee
kSocialMediaTopVoteLastElectionEverVotedElectionInterestBU
GN280_22SP16Junior3Male1Transfer0Full
Time20463.7521Mac353Yes6BUGN280_22SP16Junior3Female0
Montclair only1Full
Time30412.121Mac341No4BUGN280_22SP16Junior3Male1Tra
nsfer0Full
Time40463.222Mac561Yes3BUGN280_22SP16Junior3Male1Tra
nsfer0Full
Time40462.931PC422No4BUGN280_22SP16Junior3Female0Tra
nsfer0Full
Time50452.821Mac453No5BUGN280_22SP16Junior3Male1Tra
nsfer0Full
Time50473.224PC177Yes4BUGN280_22SP16Sophmore2Male1
Transfer0Full
Time30463.319PC464No5BUGN280_22SP16Senior4Male1Tran
sfer0Full
Time45372.833Mac455Yes1BUGN280_22SP16Junior3Male1Tra
nsfer0Full
Time0372.922Mac777Yes7BUGN280_22SP16Junior3Male1Tran
sfer0Part
Time45363.4529Mac666Yes5BUGN280_22SP16Junior3Female0
Transfer0Part
Time6037324PC467Yes7BUGN280_22SU162016-06-13
22:26:45 UTCSenior4Female0Transfer0Commute0Full
Time06Marketing63.279034Mac5476Facebook7BUGN280_13S
P162016-01-28 19:46:01
UTCSenior4Female0Transfer0Commute0Full
Time386Management73.48522Mac56510InstagramNo3BUGN28
0_22SU162016-06-13 22:31:04
UTCSenior4Female0Transfer0Live in dorm1Full
Time406Marketing62.98522Mac5347Instagram7BUGN280_13S
P162016-01-28 19:48:01 UTCJunior3Male1Montclair only1Live
in dorm1Full
Time06Other22.67520PC33710FacebookNo4BUGN280_15SP16
2016-01-27 22:40:36
UTCJunior3Female0Transfer0Commute0Full
Time166Accounting63.269021Mac77720InstagramYes5BUGN2
80_13SP162016-01-28 19:50:11
UTCJunior3Female0Transfer0Commute0Full
Time406Other73.38026Mac45310InstagramNo1BUGN280_15SP
162016-01-27 22:43:30 UTCJunior3Female0Montclair
only1Live in dorm1Full
Time186Marketing43.49520Mac46618InstagramNo4BUGN280_
04SP162016-01-28 15:23:35 UTCJunior3Female0Transfer0Live
in dorm1Full
Time206Management73.148021PC34510InstagramNo1BUGN28
0_13SP162016-01-28 19:47:01 UTCJunior3Female0Montclair
only1Commute0Full
Time136Finance73.179022PC57520ReadItNo6BUGN280_15SP1
62016-01-27 22:44:13
UTCJunior3Female0Transfer0Commute0Full
Time306Finance63.328022Neither65515SnapChatYes5BUGN28
0_04SP162016-01-28 15:22:51 UTCJunior3Male1Transfer0Live
in dorm1Full
Time06Marketing63.58521PC5362SnapChatYes1BUGN280_04S
P162016-01-28 15:23:24 UTCJunior3Male1Transfer0Live in
dorm1Full
Time06Finance538520PC3566TwitterNo6BUGN280_16SP16201
6-01-26 23:15:52 UTCJunior3Male1Transfer0Commute0Full
Time206749520PC56714Yes7BUGN280_16SP162016-01-26
23:15:10 UTCJunior3Male1Transfer0Commute0Full
Time40663.29525PC66530No6BUGN280_22SP16Junior3Femal
e0Montclair only1Full
Time20652.820Mac544No4BUGN280_22SP16Junior3Female0T
ransfer0Full
Time30663.9522Mac554No3BUGN280_04SP162016-01-28
15:22:20 UTCSophmore2Female0Montclair only1Commute0Full
Time17.56Marketing63.29519Mac1568InstagramYes5BUGN280
_15SP162016-01-27 22:43:37 UTCSophmore2Male1Montclair
only1Commute0Full
Time226Accounting43.529519PC4557InstagramNo2BUGN280_
13SP162016-01-28 19:46:53 UTCSophmore2Female0Montclair
only1Commute0Full
Time406Finance73.29019Mac47515InstagramNo2BUGN280_04
SP162016-01-28 15:22:51 UTCSophmore2Female0Montclair
only1Live in dorm1Full
Time126Marketing52.78519Mac45310SnapChatNo6BUGN280_
22SP16Sophmore2Male1Montclair only1Full
Time30663.3419Mac577No7BUGN280_13SP162016-01-28
19:48:50 UTCFreshman1Male1Montclair only1Commute0Full
Time206Accounting73.759019Mac34220SnapChatNo4BUGN28
0_16SP162016-01-26 23:14:21
UTCFreshman1Female0Montclair only1Live in dorm1Full
Time15663.48018PC35115No5BUGN280_22SP16Freshman1Ma
le1Montclair only1Full
Time0663.6318Mac553No4BUGN280_13SP162016-01-28
19:47:00 UTCJunior3Male1Montclair only1Commute0Full
Time05Marketing52.48521PC5446FacebookNo5BUGN280_04S
P162016-01-28 15:25:40
UTCJunior3Female0Transfer0Commute0Full
Time205Accounting53.58522PC5547FacebookNo6BUGN280_1
5SP162016-01-27 22:46:52 UTCJunior3Female0Transfer0Live
in dorm1Full
Time305Marketing73.49021Neither54315FacebookYes6BUGN2
80_13SP162016-01-28 19:45:06
UTCJunior3Male1Transfer0Commute0Full
Time255Finance63.57522Mac5566InstagramYes1BUGN280_15
SP162016-01-27 22:44:13
UTCJunior3Male1Transfer0Commute0Full
Time42.55Information
Management648025Mac65510LinkedInNo3BUGN280_15SP162
016-01-27 22:41:28 UTCJunior3Male1Transfer0Commute0Full
Time145Accounting53.38022PC3566ReadItNo6BUGN280_13SP
162016-01-28 19:53:00 UTCJunior3Male1Montclair
only1Commute0Full
Time135Marketing538520PC2553SnapChatNo1BUGN280_13SP
162016-01-28 19:48:15
UTCJunior3Female0Transfer0Commute0Full
Time205Other73.19023PC55320SnapChatYes6BUGN280_15SP
162016-01-27 22:41:08
UTCJunior3Male1Transfer0Commute0Full
Time335Marketing53.29022Mac3345SnapChatYes3BUGN280_1
3SP162016-01-28 19:47:15 UTCJunior3Male1Transfer0Live in
dorm1Full
Time05Management639022Mac45413SnapChatNo2BUGN280_1
3SP162016-01-28 19:44:33
UTCJunior3Female0Transfer0Commute0Full
Time155Accounting33.69521Mac67115TwitterNo2BUGN280_1
3SP162016-01-28 19:51:39 UTCJunior3Male1Transfer0Live in
dorm1Full
Time05Finance53.498521Mac5349TwitterNo4BUGN280_16SP1
62016-01-26 23:15:04
UTCJunior3Male1Transfer0Commute0Full
Time40562.88523Mac4551Yes4BUGN280_16SP162016-01-26
23:16:07 UTCJunior3Male1Transfer0Live in dorm1Full
Time15553.099024PC5435Yes6BUGN280_22SP16Junior3Male
1Transfer0Full
Time17.5562.822PC456Yes1BUGN280_22SP16Junior3Female0
Transfer0Full
Time27573.5421PC755No4BUGN280_22SP16Junior3Male1Mo
ntclair only1Full
Time30563.221Mac455Yes6BUGN280_22SP16Junior3Male1Mo
ntclair only1Full
Time40572.821PC557No5BUGN280_22SP16Junior3Male1Mont
clair only1Full
Time4555321PC645No5BUGN280_04SP162016-01-28 15:24:07
UTCSophmore2Female0Montclair only1Commute0Full
Time85Management63.488518PC45110FacebookNo6BUGN280
_15SP162016-01-27 22:41:34 UTCSophmore2Female0Montclair
only1Live in dorm1Full
Time05Finance43.38519PC3528FacebookNo2BUGN280_15SP1
62016-01-27 22:42:27 UTCSophmore2Female0Montclair
only1Live in dorm1Full
Time85Management53.39020Mac31310FacebookYes3BUGN280
_04SP162016-01-28 15:23:29 UTCSophmore2Male1Montclair
only1Commute0Full
Time105Marketing73.5448519Mac2668InstagramNo1BUGN280
_13SP162016-01-28 19:54:34
UTCSophmore2Male1Transfer0Commute0Full
Time245Marketing52.98520PC4443InstagramNo5BUGN280_04
SP162016-01-28 15:22:33
UTCSophmore2Male1Transfer0Commute0Full
Time255Management63.79020PC57310InstagramNo2BUGN280
_04SP162016-01-28 15:23:42 UTCSophmore2Male1Montclair
only1Live in dorm1Full
Time405Management63.59019Mac4667InstagramNo4BUGN280
_04SP162016-01-28 15:22:52
UTCSophmore2Male1Transfer0Live in dorm1Full
Time55Marketing63.38519PC5648Newspapers/news magazines
- on the webNo6BUGN280_15SP162016-01-27 22:43:29
UTCSophmore2Female0Montclair only1Live in dorm1Full
Time05Marketing63.69519Mac4658SnapChatNo2BUGN280_15
SP162016-01-27 22:41:35 UTCSophmore2Female0Montclair
only1Live in dorm1Full
Time05Finance72.99019PC44610SnapChatNo5BUGN280_15SP
162016-01-27 22:42:56 UTCSophmore2Male1Montclair
only1Live in dorm1Full
Time45Management63.58519PC56622SnapChatNo4BUGN280_
04SP162016-01-28 15:24:54
UTCSophmore2Female0Transfer0Live in dorm1Full
Time245Management78519PC45410SnapChatNo1BUGN280_04
SP162016-01-28 15:22:11 UTCSophmore2Female0Montclair
only1Commute0Full
Time255Management53.79019Mac15310TwitterNo3BUGN280_
15SP162016-01-27 22:43:17 UTCSophmore2Female0Montclair
only1Live in dorm1Full
Time125Marketing63.79020Mac36513TwitterNo4BUGN280_13
SP162016-01-28 19:45:37 UTCSophmore2Female0Montclair
only1Live in dorm1Full
Time125Management53.39019Mac46310TwitterNo4BUGN280_
16SP162016-01-26 23:17:02
UTCSophmore2Male1Transfer0Commute0Part
Time11553.19019PC4764No7BUGN280_16SP162016-01-26
23:15:21 UTCSophmore2Male1Montclair only1Commute0Full
Time20573.19019Mac4753No5BUGN280_16SP162016-01-26
23:14:30 UTCSophmore2Male1Transfer0Commute0Full
Time32553.679019Mac4444No7BUGN280_22SP16Sophmore2F
emale0Montclair only1Full
Time15553.219Mac454No4BUGN280_22SP16Sophmore2Femal
e0Montclair only1Full
Time20553.819Mac555No5BUGN280_22SP16Sophmore2Femal
e0Montclair only1Full
Time24553.119PC151No6BUGN280_22SP16Sophmore2Female
0Montclair only1Full
Time25533.31419PC152No4BUGN280_13SP162016-01-28
19:48:37 UTCFreshman1Male1Montclair only1Commute0Full
Time245Accounting63.769018Mac55525FacebookNo3BUGN28
0_13SP162016-01-28 19:50:35
UTCFreshman1Female0Montclair only1Commute0Full
Time05Accounting73.9449519Mac46514SnapChatNo4BUGN28
0_04SP162016-01-28 15:22:32
UTCFreshman1Female0Montclair only1Commute0Full
Time205Accounting53.49018Mac44510SnapChatNo1BUGN280
_04SP162016-01-28 15:24:01 UTCFreshman1Male1Montclair
only1Commute0Full
Time245Management52.38018Mac35518TwitterNo5BUGN280_
16SP162016-01-26 23:15:32 UTCFreshman1Female0Montclair
only1Live in dorm1Full
Time0552.68518Mac4528No4BUGN280_16SP162016-01-26
23:15:44 UTCFreshman1Male1Montclair only1Live in
dorm1Full
Time0563.559519PC6535No4BUGN280_16SP162016-01-26
23:15:23 UTCFreshman1Male1Montclair only1Live in
dorm1Full
Time0533.0069019Mac5541No4BUGN280_15SP162016-01-27
22:41:47 UTCSenior4Female0Transfer0Commute0Full
Time504Accounting63.459521PC66516SnapChatNo3BUGN280
_04SP162016-01-28 15:22:27 UTCSenior4Female0Montclair
only1Commute0Full
Time204Marketing63.49021PC5555TwitterYes5BUGN280_13S
P162016-01-28 20:00:01 UTCJunior3Female0Montclair
only1Commute0Full
Time204Other42.28521PC37612FacebookYes7BUGN280_22SU
162016-06-13 22:24:25
UTCJunior3Male1Transfer0Commute0Full
Time204Management53.39025PC55510Facebook6BUGN280_04
SP162016-01-28 15:23:21
UTCJunior3Male1Transfer0Commute0Full
Time04Finance69022PC6765InstagramYes6BUGN280_15SP162
016-01-27 22:41:56 UTCJunior3Male1Transfer0Commute0Full
Time254Marketing63.58521PC2552InstagramNo2BUGN280_04
SP162016-01-28 15:24:57
UTCJunior3Male1Transfer0Commute0Full
Time04Finance53.088521Mac4716SnapChatYes4BUGN280_15
SP162016-01-27 22:41:51
UTCJunior3Female0Transfer0Commute0Full
Time304Accounting79023PC4325SnapChatYes2BUGN280_13S
P162016-01-28 19:48:28
UTCJunior3Male1Transfer0Commute0Full
Time104Management52.28522PC5624TwitterYes6BUGN280_1
5SP162016-01-27 22:45:13
UTCJunior3Female0Transfer0Commute0Full
Time304Management43.348523Mac45115TwitterNo4BUGN280
_16SP162016-01-26 23:19:11 UTCJunior3Male1Montclair
only1Commute0Full
Time0432.99021PC5347Yes5BUGN280_16SP162016-01-26
23:16:05 UTCJunior3Male1Montclair only1Commute0Full
Time154538520Mac5434No4BUGN280_16SP162016-01-26
23:15:43 UTCJunior3Female0Transfer0Commute0Full
Time30463.29025PC46610Yes5BUGN280_16SP162016-01-26
23:14:38 UTCJunior3Male1Transfer0Commute0Full
Time35453.77526Mac5466Yes6BUGN280_16SP162016-01-26
23:15:02 UTCJunior3Male1Transfer0Commute0Full
Time40453.78533PC4468Yes4BUGN280_13SP162016-01-28
19:46:11 UTCSophmore2Female0Montclair only1Commute0Full
Time304Accounting238020PC5734InstagramYes1BUGN280_15
SP162016-01-27 22:41:22
UTCSophmore2Male1Transfer0Commute0Full
Time354Accounting52.98522PC2518InstagramYes4BUGN280_
13SP162016-01-28 19:46:23 UTCSophmore2Male1Montclair
only1Commute0Full
Time04Other42.898020Neither4333TwitterNo3BUGN280_16SP
162016-01-26 23:16:28 UTCSophmore2Male1Montclair
only1Live in dorm1Full
Time0442.58020Mac3456Yes1BUGN280_13SP162016-01-28
19:46:43 UTCFreshman1Male1Montclair only1Commute0Full
Time164Accounting72.4958518Mac5555TwitterNo3BUGN280_
22SU162016-06-13 22:23:54
UTCSenior4Female0Transfer0Commute0Full
Time03Marketing52.98522PC45713Instagram7BUGN280_22SU
162016-06-13 22:30:32
UTCSophmore2Female0Transfer0Commute0Part
Time403Information
Management73.859037Mac6544Facebook5BUGN280_13SP1620
16-01-28 19:50:46
UTCFreshman1Male1Transfer0Commute0Full
Time403Accounting73.58528PC4446Newspapers/news
magazines - on the webNo7BUGN280_22SU162016-06-13
22:24:11 UTCSenior4Male1Transfer0Commute0Full
Time62Finance53.19021Mac3521SnapChat1BUGN280_22SU16
2016-06-13 22:25:37
UTCJunior3Female0Transfer0Commute0Full
Time02Finance52.58521PC65410Facebook6BUGN280_22SU16
2016-06-13 22:25:49 UTCJunior3Male1Transfer0Commute0Full
Time352Finance72.888520PC35715Facebook5BUGN280_15SP1
62016-01-27 22:42:05
UTCJunior3Male1Transfer0Commute0Part
Time252Finance72.97022PC45315InstagramYes4BUGN280_22
SU162016-06-13 22:25:06 UTCJunior3Female0Montclair
only1Commute0Full
Time302Marketing73.29019Mac4573Instagram5BUGN280_22S
U162016-06-13 22:28:29 UTCJunior3Female0Montclair
only1Live in dorm1Full
Time202Finance52.88521Mac66415Twitter1BUGN280_16SP16
2016-01-26 23:17:20
UTCJunior3Female0Transfer0Commute0Part
Time50173.58046PC3643Yes1BUGN280_22SU162016-06-13
22:26:10 UTCSophmore2Female0Transfer0Commute0Full
Time401Management73.39531PC55514Facebook6BUGN280_04
SP162016-01-28 15:21:55
UTCSophmore2Female0Transfer0Live in dorm1Full
Time01Management42.948519Mac3465SnapChatNo1BUGN280
_08FA191107572019-10-26 04:37:40
UTCJunior3Female0Transfer0Commute0Full
Time146Marketing449522Mac3546FacebookNoNo3BUGN280_
08FA191107572019-10-28 01:06:51
UTCJunior3Male1Montclair only1Commute0Full
Time06Management63.68520Mac2666InstagramNoNo4BUGN28
0_10FA191107642019-10-28 12:08:36
UTCJunior3Female0Montclair only1Commute0Full
Time146Management638520PC6557Newspapers/news
magazines - on the
webYesYes7BUGN280_12FA191107952019-10-28 15:15:29
UTCJunior3Female0Transfer0Commute0Full
Time146Management63.27521PC51120Other magazines -
onlineNoNo1BUGN280_10FA191107642019-10-28 18:36:48
UTCJunior3Female0Transfer0Commute0Full
Time366Hospitality428021PC4646.5Other magazines -
onlineNoYes3BUGN280_08FA191107572019-10-26 15:53:57
UTCJunior3Female0Montclair only1Live in dorm1Full
Time346Other73.8659019PC3538PintrestNoYes6BUGN280_12
FA191107952019-10-27 23:52:39
UTCJunior3Female0Transfer0Commute0Full
Time266Management62.957025Mac66415SnapChatNoNo4BUG
N280_08FA191107572019-10-29 18:08:40
UTCJunior3Female0Montclair only1Commute0Full
Time146Management53.5458520Mac54320YouTubeNoYes5BU
GN280_08FA191107572019-10-27 21:38:15
UTCJunior3Male1Montclair only1Commute0Full
Time206Marketing13.28520PC33710YouTubeNoNo1BUGN280
_03FA191107432019-10-26 12:16:34
UTCSophmore2Male1Montclair only1Live in dorm1Full
Time146Accounting53.3568519Mac67510InstagramNoNo4BUG
N280_10FA191107642019-10-28 00:58:40
UTCSophmore2Male1Montclair only1Commute0Full
Time366Marketing53.49019Mac56414ReadItNoYes6BUGN280_
12FA191107952019-10-26 01:10:39
UTCSophmore2Male1Transfer0Commute0Full
Time06Finance53.48523Neither2257YouTubeYesYes5BUGN28
0_03FA191107432019-10-27 18:31:01
UTCSenior4Male1Transfer0Commute0Full
Time305Marketing53.49523Mac55715FacebookYesYes4BUGN
280_12FA191107952019-10-28 03:10:25
UTCSenior4Male1Transfer0Commute0Full
Time185Management53.59521Mac7775InstagramNoYes3BUGN
280_08FA191107572019-10-27 20:28:24
UTCSenior4Male1Transfer0Commute0Full
Time205Other73.38522Mac5665SnapChatNoNo1BUGN280_03F
A191107432019-10-28 02:13:20
UTCSenior4Female0Transfer0Commute0Full
Time505Other73.759036Mac5447TwitterYesYes7BUGN280_12
FA191107952019-10-28 02:12:49
UTCSenior4Male1Transfer0Commute0Full
Time285Marketing538022Mac3367.00TwitterNoYes7BUGN280
_08FA191107572019-10-27 23:28:54
UTCJunior3Male1Montclair only1Commute0Full
Time305Finance43.538020Mac3651FacebookNoNo2BUGN280_
03FA191107432019-10-27 19:30:16
UTCJunior3Female0Transfer0Live in dorm1Full
Time05Hospitality73.549521Mac47611FacebookYesYes6BUGN
280_03FA191107432019-10-26 19:58:03
UTCJunior3Male1Transfer0Commute0Full
Time05Marketing53.48520PC6555FacebookNoYes7BUGN280_
12FA191107952019-10-27 22:52:04
UTCJunior3Male1Montclair only1Live in dorm1Full
Time05Other53.4218020PC4418.00FacebookNoNo5BUGN280_
10FA191107642019-10-28 00:48:32
UTCJunior3Male1Montclair only1Commute0Full
Time05Other639020Mac11720InstagramNoNo1BUGN280_12F
A191107952019-10-28 01:07:42
UTCJunior3Male1Transfer0Commute0Full
Time405Finance53.48523Mac4558.00InstagramNoNo1BUGN28
0_03FA191107432019-10-28 03:33:37
UTCJunior3Female0Montclair only1Live in dorm1Full
Time105Management63.3089021Mac15230InstagramNoNo2BU
GN280_08FA191107572019-10-26 14:45:17
UTCJunior3Male1Montclair only1Commute0Full
Time225Marketing52.89020Mac55610InstagramNoYes7BUGN2
80_08FA191107572019-10-27 21:06:24
UTCJunior3Female0Transfer0Commute0Full
Time305Management53.588020Mac3436InstagramNoNo2BUGN
280_10FA191107642019-10-27 21:37:09
UTCJunior3Male1Transfer0Live in dorm1Full
Time45Marketing73.69020Mac6657InstagramNoYes7BUGN280
_08FA191107572019-10-27 14:32:08
UTCJunior3Female0Transfer0Live in dorm1Full
Time165Management73.0178522PC3363LinkedInYesYes2BUG
N280_03FA191107432019-10-28 03:55:03
UTCJunior3Female0Transfer0Commute0Full
Time265Accounting73.759526Mac75513.00Newspapers/news
magazines - on the webNoNo7BUGN280_08FA191107572019-
10-28 01:39:43 UTCJunior3Female0Montclair
only1Commute0Full
Time285Marketing53.38520Mac6655Newspapers/news
magazines - on the webNoYes6BUGN280_03FA191107432019-
10-26 14:50:55 UTCJunior3Male1Transfer0Commute0Full
Time345Management53.829521PC36710Newspapers/news
magazines - on the
webYesYes3BUGN280_03FA191107432019-10-27 19:14:46
UTCJunior3Male1Montclair only1Live in dorm1Full
Time125Marketing63.78520Mac67614Newspapers/news
magazines - on the webNoYes7BUGN280_03FA191107432019-
10-27 07:00:45 UTCJunior3Female0Montclair
only1Commute0Full
Time165Marketing53.48520Mac4542Newspapers/news
magazines - on the webNoNo7BUGN280_10FA191107642019-
10-25 19:48:28 UTCJunior3Male1Transfer0Commute0Full
Time205Marketing53.69021Mac54310Newspapers/news
magazines - on the webNoNo1BUGN280_10FA191107642019-
10-28 02:21:41 UTCJunior3Female0Transfer0Commute0Full
Time505Marketing63.29521PC5657Other magazines -
onlineYesYes6BUGN280_03FA191107432019-10-27 16:13:08
UTCJunior3Female0Montclair only1Commute0Full
Time125Marketing43.19021Mac5547Other magazines -
onlineYesYes5BUGN280_12FA191107952019-10-27 11:38:38
UTCJunior3Other1Transfer0Commute0Full
Time505Finance53.49020Neither6655SnapChatNoNo6BUGN28
0_10FA191107642019-10-27 22:09:54
UTCJunior3Male1Transfer0Commute0Full
Time125Finance73.29021Mac5565TwitterYesYes5BUGN280_0
8FA191107572019-10-27 19:51:39 UTCJunior3Male1Montclair
only1Commute0Full
Time205Management33.568520Mac4520TwitterNoNo1BUGN28
0_12FA191107952019-10-27 17:52:09
UTCJunior3Female0Transfer0Commute0Full
Time145Marketing63.59021Mac26710YouTubeYesYes5BUGN2
80_12FA191107952019-10-26 14:29:28
UTCJunior3Female0Transfer0Live in dorm1Full
Time05Marketing53.47021PC57410YouTubeNoYes6BUGN280_
10FA191107642019-10-26 16:22:45
UTCSophmore2Male1Montclair only1Commute0Full
Time125Other52.5569519Mac6554InstagramNoNo2BUGN280_
03FA191107432019-10-28 02:50:13
UTCSophmore2Female0Montclair only1Live in dorm1Full
Time45Marketing43.58519Mac43410InstagramNoYes3BUGN28
0_03FA191107432019-10-27 15:22:05
UTCSophmore2Female0Montclair only1Commute0Full
Time85Management63.59520PC4534Newspapers/news
magazines - on the
webYesYes5BUGN280_08FA191107572019-10-27 23:45:04
UTCSophmore2Female0Montclair only1Live in dorm1Full
Time105Other53.9449520Mac55530PintrestNoNo3BUGN280_0
8FA191107572019-10-26 19:47:02
UTCSophmore2Female0Montclair only1Commute0Full
Time05Accounting53.7398519PC2545SnapChatNoNo1BUGN28
0_08FA191107572019-10-26 05:29:55
UTCSophmore2Male1Montclair only1Live in dorm1Full
Time05Management52.89019PC4573SnapChatNoNo1BUGN280
_12FA191107952019-10-28 03:20:29
UTCSophmore2Female0Montclair only1Live in dorm1Full
Time205Marketing539019Mac44415TwitterNoYes7BUGN280_0
3FA191107432019-10-28 14:10:48
UTCSophmore2Female0Montclair only1Commute0Full
Time05Other53.79020PC5552.5TwitterYesYes5BUGN280_03F
A191107432019-10-26 20:56:29
UTCSophmore2Male1Montclair only1Commute0Full
Time05Finance12.88520Mac34412YouTubeNoNo5BUGN280_0
3FA191107432019-10-26 05:25:39
UTCSophmore2Male1Montclair only1Commute0Full
Time05Management53.59520PC6775YouTubeNoNo1BUGN280
_08FA191107572019-10-26 17:46:58
UTCFreshman1Male1Montclair only1Commute0Full
Time05Accounting73.8139020PC77612InstagramNoNo6BUGN2
80_12FA191107952019-10-28 12:53:22
UTCSenior4Male1Transfer0Commute0Full
Time404Management539032PC4646InstagramYesYes7BUGN28
0_03FA191107432019-10-27 16:42:20
UTCSenior4Male1Transfer0Commute0Full
Time204Marketing62.68023Mac46710Newspapers/news
magazines - on the
webYesYes4BUGN280_03FA191107432019-10-28 03:02:05
UTCJunior3Male1Montclair only1Live in dorm1Full
Time124Marketing73.38521Mac55510FacebookYesYes5BUGN
280_08FA191107572019-10-28 00:00:46
UTCJunior3Female0Montclair only1Commute0Full
Time124Other73.69020Mac3334InstagramNoYes5BUGN280_12
FA191107952019-10-28 03:55:14 UTCJunior3Male1Montclair
only1Commute0Full
Time144Finance73.189020Mac5642InstagramNoNo6BUGN280_
10FA191107642019-10-26 19:33:11
UTCJunior3Male1Transfer0Commute0Full
Time104Marketing43.177021PC2525InstagramYesYes7BUGN2
80_03FA191107432019-10-28 03:04:49
UTCJunior3Male1Montclair only1Live in …
Scatter Plot
Scatter Plot of MPG based on Weight (in Lbs) of Vehicle
MPG4595 4015 4085 3705 3305 4115 4505 5465 3920 3485 3785
3885 4505 4065 5025 3170 5100 3565 4095 4085 5810 4730
4000 3680 2560 2920 3280 3880 3265 3710 5935 5715 4830
4420 4105 4720 3350 3335 4755 3185 3895 5150 4600 3950
4340 3480 4540 3605 6325 4905 3480 3585 4420 2810 3505
3650 2370 4615 4510 2855 4940 2590 3835 2945 4345 3345
3800 4610 3635 3890 3880 3860 3890 5245 3380 4690 3575
4550 3870 3430 2615 3660 4725 4310 2875 3750 5705 3670
3915 4825 3510 4515 4235 3870 4620 3625 6245 4415 2000
4025 4585 2510 3085 2830 3480 3355 4060 3845 5575 4845
4490 4235 3315 4180 3320 2690 3345 4195 3430 3925 3640
3215 5715 3555 4190 4875 4550 3010 2780 4480 3540 3630
2925 3000 3305 3015 3370 3545 3335 5015 3065 3915 2890
3120 3260 3540 3545 4280 2840 3650 2995 4190 4345 3600
3280 3620 2595 4350 4490 2950 3485 4550 2410 3155 3330
3465 3245 3465 3850 3555 4950 17 18 18 23 25 21
17 15 20 24 22 19 18 19 17 26 15 18
19 17 13 16 18 17 27 23 21 18 23 20
14 14 15 18 16 16 20 23 17 22 17 12
16 19 16 15 16 19 13 15 20 20 16 31
21 21 34 19 17 25 14 28 19 27 18 23
18 17 19 19 19 19 19 13 22 14 20 15
18 23 28 21 17 15 28 18 13 23 20 15
24 21 19 21 16 20 13 17 29 18 16 27
18 30 23 23 18 21 15 16 17 17 21 16
23 30 23 17 23 19 20 25 13 21 19 15
18 26 29 17 22 20 23 27 20 22 23 21
20 16 24 17 26 23 22 18 21 16 27 18
22 17 16 22 24 21 29 17 18 44 23 18
34 25 24 24 23 22 20 20 16
X
Y
PlotDataWeight
(lb)MPG459517401518408518370523330525411521450517546
51539202034852437852238851945051840651950251731702651
00153565184095194085175810134730164000183680172560272
92023328021388018326523371020593514571514483015442018
41051647201633502033352347551731852238951751501246001
63950194340163480154540163605196325134905153480203585
20442016281031350521365021237034461519451017285525494
01425902838351929452743451833452338001846101736351938
90193880193860193890195245133380224690143575204550153
87018343023261528366021472517431015287528375018570513
36702339152048251535102445152142351938702146201636252
06245134415172000294025184585162510273085182830303480
23335523406018384521557515484516449017423517331521418
01633202326903033452341951734302339251936402032152557
15133555214190194875154550183010262780294480173540223
63020292523300027330520301522337023354521333520501516
30652439151728902631202332602235401835452142801628402
73650182995224190174345163600223280243620212595294350
17449018295044348523455018241034315525333024346524324
523346522385020355520495016
SLRDataWeight
(lb)MPG459517401518408518370523330525411521450517546
51539202034852437852238851945051840651950251731702651
00153565184095194085175810134730164000183680172560272
92023328021388018326523371020593514571514483015442018
41051647201633502033352347551731852238951751501246001
63950194340163480154540163605196325134905153480203585
20442016281031350521365021237034461519451017285525494
01425902838351929452743451833452338001846101736351938
90193880193860193890195245133380224690143575204550153
87018343023261528366021472517431015287528375018570513
36702339152048251535102445152142351938702146201636252
06245134415172000294025184585162510273085182830303480
23335523406018384521557515484516449017423517331521418
01633202326903033452341951734302339251936402032152557
15133555214190194875154550183010262780294480173540223
63020292523300027330520301522337023354521333520501516
30652439151728902631202332602235401835452142801628402
73650182995224190174345163600223280243620212595294350
17449018295044348523455018241034315525333024346524324
523346522385020355520495016
SLRSimple Linear Regression Analysisof MPG by Weight of
VehicleCalculationsb1, b0 Coefficients-
0.004939.0902Regression Statisticsb1, b0 Standard
Error0.00020.9786Multiple R0.8357R Square, Standard
Error0.69842.5757R Square0.6984F, Residual
df391.3038169.0000Adjusted R Square0.6966Regression SS,
Residual SS2595.98921121.1804Standard
Error2.5757Observations171Confidence level95%t Critical
Value1.9741ANOVAHalf Width b01.9318dfSSMSFSignificance
FHalf Width
b10.0005Regression12595.98922595.9892391.30380.0000Resid
ual1691121.18046.6342Total1703717.1696CoefficientsStandard
Errort StatP-valueLower 95%Upper 95%Lower 95%Upper
95%Intercept39.09020.978639.94570.000037.158441.022137.15
8441.02207Weight (lb)-0.00490.0002-19.78140.0000-0.0054-
0.0044-0.0054-0.00439
DataCopy3Weight
(lb)45954015408537053305411545055465392034853785388545
05406550253170510035654095408558104730400036802560292
03280388032653710593557154830442041054720335033354755
31853895515046003950434034804540360563254905348035854
42028103505365023704615451028554940259038352945434533
45380046103635389038803860389052453380469035754550387
03430261536604725431028753750570536703915482535104515
42353870462036256245441520004025458525103085283034803
35540603845557548454490423533154180332026903345419534
30392536403215571535554190487545503010278044803540363
02925300033053015337035453335501530653915289031203260
35403545428028403650299541904345360032803620259543504
490295034854550241031553330346532453465385035554950
CompleteStatistics3WeightWeight
(lb)Mean3886.7251461988Median3800Mode3480Minimum2000
Maximum6325Range4325Variance641611.5652Standard
Deviation801.0066Coeff. of
Variation20.61%Skewness0.5476Kurtosis0.3268Count171Stand
ard Error61.2545
DataCopy2Asia or
EuropeUS17151818181923172513211617181517202724232221
19181823192017142614311521182116341619201723251728221
91727121816231918161715191619191913191519201820231628
14211317221514282018152313201615202413211719162123292
21820162327271823302123202316182421171523162217201720
21163023172319202513211915182629172022262322182116271
822171622242129171844231834252424
CompleteStats 2 GpsMPG by Origin of VehicleAsia or
EuropeUSMean2118Median2118Mode1816Minimum1312Maxim
um4427Range3115Variance23.984212.7341Standard
Deviation4.89743.5685Coeff. of
Variation22.99%19.59%Skewness1.44080.3862Kurtosis3.6098-
0.4992Count10665Standard Error0.47570.4426
DataCopyMPG1718182325211715202422191819172615181917
13161817272321182320141415181616202317221712161916151
61913152020163121213419172514281927182318171919191919
13221420151823282117152818132320152421192116201317291
81627183023231821151617172116233023172319202513211915
18262917222023272022232120162417262322182116271822171
6222421291718442318342524242322202016
CompleteStatsMPGMPGMean20Median19Mode18Minimum12M
aximum44Range32Variance21.8657Standard
Deviation4.6761Coeff. of
Variation23.23%Skewness1.3054Kurtosis3.5781Count171Stand
ard Error0.3576
FiveNumbersMPGFive-Number SummaryMinimum12First
Quartile17Median19Third Quartile23Maximum44
BoxPlot
MPG
MPG
12 12 12 0.5 1 1.5 17 17 17 0.5 1 1.5 19
19 19 0.5 1 1.5 23 23 23 0.5 1 1.5 44
44 44 0.5 1 1.5 12 44 1 1 17 23
0.5 0.5 17 23 1.5 1.5
ForBoxPlot120.5121121.5170.5171171.5190.5191191.5230.523
1231.5440.5441441.5121441170.5230.5171.5231.5
FiveNumbers 2 GpsMPG based on Origin of VehicleFive-
Number SummaryAsia or EuropeUSMinimum1312First
Quartile1816Median20.518Third Quartile2420.5Maximum4427
BoxPlot 2 Gps
MPG based on Origin of Vehicle
Asia or Europe
13 13 13 0.5 1 1.5 18 18 18 0.5 1 1.5
20.5 20.5 20.5 0.5 1 1.5 24 24 24 0.5 1
1.5 44 44 44 0.5 1 1.5 13 44 1 1 18
24 0.5 0.5 18 24 1.5 1.5
US
12 12 12 2 2.5 3 16 16 16 2 2.5 3 18
18 18 2 2.5 3 20.5 20.5 20.5 2 2.5 3 27
27 27 2 2.5 3 12 27 2.5 2.5 16 20.5 2
2 16 20.5 3 3
ForBoxPlot2130.5122131122.5131.5123180.5162181162.5181.5
16320.50.518220.51182.520.51.5183240.520.5224120.52.5241.
520.53440.5272441272.5441.5273131122.5441272.5180.516224
0.520.52181.5163241.520.53
FiveNumbers3WeightFive-Number SummaryMinimum2000First
Quartile3335Median3800Third Quartile4480Maximum6325
BoxPlot3
Weight
Weight (lb)
2000 2000 2000 0.5 1 1.5 3335 3335 3335 0.5 1 1.5
3800 3800 3800 0.5 1 1.5 4480 4480 4480 0.5 1
1.5 6325 6325 6325 0.5 1 1.5 2000 6325 1 1
3335 4480 0.5 0.5 3335 4480 1.5 1.5
ForBoxPlot320000.52000120001.533350.53335133351.538000.
53800138001.544800.54480144801.563250.56325163251.52000
16325133350.544800.533351.544801.5
DataCopy4OriginAsia or EuropeAsia or EuropeAsia or
EuropeAsia or EuropeAsia or EuropeAsia or EuropeAsia or
EuropeAsia or
EuropeUSUSUSUSUSUSUSUSUSUSUSUSUSUSUSUSUSUSU
SUSUSUSUSUSUSUSUSUSUSUSUSUSUSUSUSUSUSAsia or
EuropeAsia or EuropeAsia or EuropeAsia or EuropeAsia or
EuropeAsia or EuropeAsia or EuropeUSAsia or EuropeAsia or
EuropeAsia or EuropeAsia or EuropeAsia or EuropeAsia or
EuropeAsia or EuropeAsia or EuropeUSUSUSUSUSAsia or
EuropeAsia or EuropeAsia or EuropeAsia or EuropeAsia or
EuropeAsia or EuropeAsia or EuropeAsia or EuropeUSAsia or
EuropeAsia or EuropeAsia or EuropeAsia or EuropeAsia or
EuropeAsia or EuropeAsia or EuropeUSUSUSUSAsia or
EuropeAsia or EuropeAsia or EuropeAsia or EuropeAsia or
EuropeAsia or EuropeAsia or EuropeUSUSAsia or EuropeAsia
or EuropeAsia or EuropeAsia or EuropeAsia or EuropeAsia or
EuropeAsia or EuropeAsia or EuropeAsia or EuropeAsia or
EuropeAsia or EuropeUSUSUSUSAsia or EuropeAsia or
EuropeUSUSUSUSUSUSAsia or EuropeAsia or EuropeAsia or
EuropeAsia or EuropeAsia or EuropeAsia or EuropeAsia or
EuropeAsia or EuropeUSUSUSUSUS
Bar Chart
Origin of Vehicle
Total Asia or Europe US 106 65
Origin
OneWayTableOrigin of VehicleCount of OriginOriginTotalAsia
or Europe106US65Grand Total171
SideBySide
Auto Type by Origin of Vehicle
4 Door Hatchback Asia or Europe US 6 1 4 Door SUV
Asia or Europe US 33 27 Coupe Asia or Europe
US 17 6 Minivan Asia or Europe US 4 3
Sedan Asia or Europe US 40 25 Wagon Asia or
Europe US 6 3
TwoWayTableOrigin and Auto TypeCount of OriginType
AutoOrigin4 Door Hatchback4 Door
SUVCoupeMinivanSedanWagonGrand TotalAsia or
Europe633174406106US1276325365Grand Total760237659171
Variable INFOAutomobile features taken from a sample of 171
car modelsSourceBerenson, Levine, Krehbiel Basic Business
Statistics: Concepts and Applications (12 ed.),
PearsonVariablesMake/ModelMPGMiles Per
GallonLengthCargoWidthCargo storage width in
inchesHeightWheelBaseWheel base distance in
inchesWeightMaxLoadMaximum car load in
poundsCargoVolVolume of trunk space in cubic inches
feetHPHorsepowerAccto60Time in seconds to accelerate to 60
miles per hourBreakfr60Distance in feet to stop vehicle when
applying the breaks at 60 miles per hourTrngCircDistance in
feet to turn the vehicle 360 degreesOriginUS, Asia or
EuropeTypeAutoType of automobileTransmissionType of
transmission
DATAAutomobile comparison studey
dataMake/ModelMPGLength (in)CargoWidth (in)Height
(in)WheelBase (in)Weight (lb)MaxLoad
(lb)CargoVol(cuft)HPAccto60(sec)Breakfr60(ft)TrngCirc(ft)Ori
ginType AutoTransmissionAcura
MDX1719179661084595116036300813940Asia or Europe4
Door SUVAuto 5Acura
RDX1818174651044015870302407.414541Asia or Europe4
Door SUVAuto 5Acura
RL1819473571104085850133006.914843Asia or
EuropeSedanAuto 5Acura
TL2319574571093705850132706.713842Asia or
EuropeSedanAuto 5Audi
A32516977561023305990202007.314935Asia or Europe4 Door
HatchbackSeq 6Audi
A621194715711241151100162557.714440Asia or
EuropeSedanAuto 6Audi
A817204755712145051210183307.614041Asia or
EuropeSedanAuto 6Audi
Q715200786811854651325373508.214640Asia or Europe4 Door
SUVAuto 6Audi S420181725610439201145133405.314038Asia
or EuropeSedanMan 6BMW 3 Series sedan 328i 6-
cyl24178725610934851060112157.414237Asia or
EuropeWagonAuto 6BMW 5
Series22191735811437851100143005.814939Asia or
EuropeSedanAuto 6BMW 6
Series1919073541093885840133605.613340Asia or
EuropeCoupeAuto 6BMW 7
Series18204755912345051060183256.915442Asia or
EuropeSedanAuto 6BMW
X319180736611040651005332607.914039Asia or Europe4 Door
SUVAuto 6BMW
X517191767011650251350362608.614242Asia or Europe4 Door
SUVAuto 6BMW Z42616170509831705502225612633Asia or
EuropeCoupeMan 6Buick
Enclave15201787011951001335442758.915343US4 Door
SUVAuto 6Buick
LaCrosse181987357111356591516200916040USSedanAuto
4Buick
Lucerne1920374581164095925171979.217544USSedanAuto
4Cadillac
DTS17208755811640851095192757.618046USSedanAuto
4Cadillac Escalade13203797511658101330474037.518142US4
Door SUVAuto 6Cadillac
SRX16195736811647301285372558.315242US4 Door SUVAuto
5Cadillac
STS1819673581164000890142557.114640USSedanAuto
5Cadillac
XLR171787250106368040043206.414541USCoupeAuto
5Chevrolet Aveo hatchback 1LT 4-
cyl271546659982560860710311.214635USSedanMan
5Chevrolet Cobalt sedan LT 4-
cyl2318068571032920890141458.815237USSedanAuto
4Chevrolet Corvette convertible Base V8
MT211757349106328039011400514542USCoupeMan
6Chevrolet Equinox18189716911338801115371859.115343US4
Door SUVAuto 5Chevrolet
HHR2317669651043265820301729.215941US4 Door SUVAuto
4Chevrolet
Impala2020073591113710945192427.815541USSedanAuto
4Chevrolet
Suburban14222797713059351460613209.116545US4 Door
SUVAuto 4Chevrolet Tahoe LT
V81420279771165715158051320916842US4 Door SUVAuto
4Chevrolet
TrailBlazer15192757511348301020392919.115939US4 Door
SUVAuto 4Chevrolet
Uplander18205727212144201410512408.815343USMinivanAut
o 4Chrysler 300 C
V81619774581204105865163406.413941USSedanAuto
5Chrysler Pacifica16199796711647201000362538.614642US4
Door SUVAuto 6Chrysler PT
Cruiser2016967611033350865321808.116541USSedanAuto
4Chrysler Sebring sedan Touring 4-
cyl23191735910933358251317310.215640USSedanAuto
4Chrysler Town &
Country17203776912147551150622518.817242USMinivanAuto
6Dodge Caliber SXT 4-cyl
CVT22174696010431858652017210.315739US4 Door
HatchbackCVTDodge Charger SXT
V6172007558120389586516340613441USSedanAuto 5Dodge
Durango12201767411951501455453357.616743US4 Door
SUVAuto 5Dodge Grand
Caravan162037769121460011506219710.318242USMinivanAut
o 6Dodge
Magnum1919874581203950865302508.816641USWagonAuto
4Dodge Nitro16179736910943401150402109.116739US4 Door
SUVAuto 4Dodge
Viper15176754899348046565104.213043USCoupeMan 6Ford
Edge1618676671114540910362658.315939US4 Door SUVAuto
6Ford Escape191757070103360510003820010.521540US4 Door
SUVAuto 4Ford
Expedition13221797713163251570733009.116645US4 Door
SUVAuto 6Ford Explorer XLT
V615193747311449051275482109.716338US4 Door SUVAuto
5Ford Fusion SEL
V6201907256107348085016221814342USSedanAuto 6Ford
Mustang coupe GT Premium V8
MT2018874551073585720133005.514439USCoupeMan 5Ford
Taurus X16200756711344201150382638.515242USSedanAuto
6Honda Civic sedan EX 4-
cyl3117769571062810850131408.613639Asia or
EuropeSedanMan 5Honda CR-
V21178726610335058502616610.613939Asia or Europe4 Door
SUVAuto 5Honda
Element21170727010136506754716610.416236Asia or Europe4
Door SUVAuto 5Honda Fit Sport 4-cyl
MT341626760982370850241099.914436Asia or Europe4 Door
HatchbackMan 5Honda
Odyssey19201776911846151320672558.614440Asia or
EuropeMinivanAuto 5Honda
Pilot17191797310945101320482558.215740Asia or Europe4
Door SUVAuto 5Honda
S200025162695195285540052405.813436Asia or
EuropeCoupeMan 6Hummer
H314187757411249409403822011.517037US4 Door SUVAuto
4Hyundai Accent GLS 4-
cyl2816967589825908501211012.515336Asia or
EuropeSedanAuto 4Hyundai
Azera1919373591093835860172637.114441Asia or
EuropeSedanAuto 5Hyundai Elantra GLS 4-
cyl27177705810429458501413810.415237Asia or
EuropeSedanAuto 4Hyundai Santa
Fe18184746810643451120382428.513939Asia or Europe4 Door
SUVAuto 5Hyundai Sonata GLS 4-
cyl23189725810733458601616210.513339Asia or
EuropeSedanAuto 4Hyundai
Tucson18170716610438008603117310.114339Asia or Europe4
Door SUVAuto 4Hyundai
Veracruz17191776911046101160422608.615441Asia or
Europe4 Door SUVAuto 6Infiniti G sedan Journey
V61918770571123635900143062.213238Asia or
EuropeSedanAuto 5Infiniti M M35
V61919371591143890860132756.914139Asia or
EuropeSedanAuto 5Jaguar S-
Type1919272561153880905142946.314240Asia or
EuropeSedanAuto 6Jaguar
XJ1920073571193860880172947.114341Asia or
EuropeSedanAuto 6Jaguar
XK191898252108389070510300713838Asia or
EuropeCoupeAuto 6Jeep
Commander13189757211052451100393307.316041US4 Door
SUVAuto 5Jeep
Compass22173696510433809252717210.116338US4 Door
SUVCVTJeep Grand
Cherokee14186736710946901050332358.815940US4 Door
SUVAuto 5Jeep
Patriot20174696410435759253017210.816838US4 Door
SUVCVTJeep
Wrangler15173747111645508503520510.717243US4 Door
SUVAuto 4Kia
Amanti1819773591103870860162009.116041Asia or
EuropeSedanAuto 5Kia Optima EX
V62318671581073430825151629.214239Asia or
EuropeSedanAuto 5Kia Rio sedan LX 4-
cyl281676758982615850911012.815035Asia or
EuropeSedanAuto 4Kia
Rondo2117972651063660825331829.616339Asia or
EuropeWagonAuto 5Kia
Sedona1720278691194725115565244915243Asia or
EuropeMinivanAuto 5Kia
Sorento1518173681074310880321929.515539Asia or Europe4
Door SUVAuto 4Kia Spectra EX 4-
cyl2817668581032875850121389.515337Asia or
EuropeSedanMan 5Kia
Sportage18170716610437508603117311.317238Asia or
Europe4 Door SUVAuto 4Land Rover
LR313191757411457051475523009.114539US4 Door SUVAuto
6Lexus ES2319172571093670900152726.414039Asia or
EuropeSedanAuto 6Lexus GS 300
V62019072571123915815132457.414738Asia or
EuropeSedanAuto 6Lexus
GX1518874731104825122540235813641Asia or Europe4 Door
SUVAuto 5Lexus IS2418071561083510825132047.713435Asia
or EuropeSedanAuto 6Lexus
LS2120374581224515825183806.215340Asia or
EuropeSedanAuto 8Lexus RX 350
V61918673661074235925332707.314140Asia or Europe4 Door
SUVAuto 5Lexus SC211797253103387064582886.514438Asia
or EuropeCoupeAuto 6Lincoln
MKX1618776671114620910372658.216241US4 Door SUVAuto
6Lincoln
MKZ2019172571073625875162636.913542USSedanAuto
6Lincoln Navigator13208797811962451525573008.816742US4
Door SUVAuto 6Lincoln Town
Car17215785911844151100212398.715442USSedanAuto 4Lotus
Elise29149684491200055041904.613237Asia or
EuropeCoupeMan 6Mazda CX-
71818474651084025850282449.114041Asia or Europe4 Door
SUVAuto 6Mazda CX-
916200766811345851190382633.216140Asia or Europe4 Door
SUVAuto 6Mazda MX-5
Miata27157684992251034051706.713833Asia or
EuropeCoupeMan 6Mazda RX-
8181747053106308568082386.713038Asia or EuropeCoupeMan
6Mazda Mazda3 sedan i 4-cyl
MT3017869581042830850111488.614036Asia or
EuropeSedanMan 5Mazda
Mazda5231826964108348010203915710.315437Asia or
EuropeWagonAuto 4Mazda
Mazda62318770571053355850151609.614541Asia or
EuropeSedanAuto 4Mercedes-Benz
CLS1819474551124060915163026.113338Asia or
EuropeSedanAuto 7Mercedes-Benz E-Class sedan E350
V621190725811238451010162686.515238Asia or
EuropeSedanAuto 7Mercedes-Benz GL-
Class15200767212155751210463357.415442Asia or Europe4
Door SUVAuto 7Mercedes-Benz M-
Class16189757011548451165412687.814338Asia or Europe4
Door SUVAuto 7Mercedes-Benz S-
Class1720573581254490113516382615440Asia or
EuropeSedanAuto 7Mercedes-Benz
SL1717972511014235570103825.313236Asia or
EuropeCoupeAuto 7Mercedes-Benz
SLK211617051963315525102686.213034Asia or
EuropeCoupeMan 6Mercury Grand
Marquis1621278571154180110021239815142USSedanAuto
4Mercury Milan Base 4-
cyl2319172561073320850161609.514440USSedanAuto 5Mini
Cooper 30146665597269081561727.215437Asia or
EuropeCoupeMan 6Mitsubishi Eclipse hatchback GS 4-cyl
MT2318072541013345660161629.314942Asia or
EuropeCoupeMan 5Mitsubishi
Endeavor1719074701084195970402158.214741Asia or Europe4
Door SUVAuto 4Mitsubishi Galant ES 4-
cyl2319072581083430825131609.114843Asia or
EuropeSedanAuto 4Mitsubishi Outlander XLS
V619183716610539251155342208.314238Asia or Europe4 Door
SUVAuto 6Nissan
350Z201697252104364045042876.213037Asia or
EuropeCoupeMan 6Nissan Altima sedan 2.5 S 4-cyl
CVT2519071581093215900161758.114239Asia or
EuropeSedanCVTNissan
Armada13208797612357151375593177.214044Asia or Europe4
Door SUVAuto 5Nissan
Maxima2119173581093555900142556.815044Asia or
EuropeSedanCVTNissan
Murano191897467111419090031245814640Asia or Europe4
Door SUVCVTNissan
Pathfinder1518873701124875112548270817243Asia or Europe4
Door SUVAuto 5Nissan
Quest18204787012445501205602358.415345Asia or
EuropeMinivanAuto 5Nissan Sentra 2.0 S 4-cyl
CVT2618071601063010850131409.616438Asia or
EuropeSedanCVTNissan Versa hatchback 1.8 S 4-cyl
MT2916967601022780860181229.518737Asia or
EuropeSedanMan 6Nissan
Xterra1717973751064480920462617.715840Asia or Europe4
Door SUVAuto 5Pontiac G6 sedan GT
V62218971571123540890141699.415642USSedanAuto 4Pontiac
Grand Prix2019872561113630915162008.316941USSedanAuto
4Pontiac
Solstice23157715095292535541777.214836USCoupeMan
5Pontiac
Vibe27173706110230008502412610.715038USWagonAuto
4Porsche 91120176715293330566053554.412737Asia or
EuropeCoupeMan 6Porsche
Boxster22172705195301542092406.512337Asia or
EuropeCoupeMan 5Saab 9-3 sedan 2.0T 4-
cyl231826857105337093015210813637USSedanAuto 5Saab 9-
52119071571063545930162607.213940USSedanAuto 5Saturn
Aura XE 4-
cyl2019070581123335915162248.116042USSedanAuto 4Saturn
Outlook16201787011950151320492758.816242US4 Door
SUVAuto 6Saturn
Sky24161715095306542542606.215637USCoupeMan 5Saturn
Vue1718073671073915915282578.216242US4 Door SUVAuto
6Scion tC2617469561062890865131608.814737Asia or
EuropeCoupeMan 5Scion
xB2316769641023120850341589.414837Asia or
EuropeWagonAuto 4Subaru Forester 2.5X 4-
cyl221776865993260900321731014238Asia or Europe4 Door
SUVAuto 4Subaru
Legacy1818668561053540850112503.115138Asia or
EuropeSedanAuto 5Subaru Outback wagon 2.5i 4-
cyl21189706310535459003116811.815838Asia or
EuropeWagonAuto 4Subaru
Tribeca16192746610842801155362568.616240Asia or Europe4
Door SUVAuto 5Suzuki
Forenza2717768571022840875121269.515736Asia or Europe4
Door HatchbackMan 5Suzuki Grand
Vitara1817771671043650905251859.514738Asia or Europe4
Door SUVAuto 5Suzuki SX4 Sport 4-
cyl2216369639829958151614312.215037Asia or Europe4 Door
HatchbackAuto 4Suzuki XL-
717197726911241901190372527.714744Asia or Europe4 Door
SUVAuto 5Toyota
4Runner16189747211043451035452398.214640Asia or Europe4
Door SUVAuto 4Toyota
Avalon2219773591113600875142806.715541Asia or
EuropeSedanAuto 5Toyota Camry LE 4-
cyl2418972581093280900151589.615138Asia or
EuropeSedanAuto 5Toyota Camry
Human Resources data analysis document table of contents

More Related Content

Similar to Human Resources data analysis document table of contents

In Section 1 on the Data page, complete each column of the spreads.docx
In Section 1 on the Data page, complete each column of the spreads.docxIn Section 1 on the Data page, complete each column of the spreads.docx
In Section 1 on the Data page, complete each column of the spreads.docxsleeperharwell
 
De vry math 399 ilabs &amp; discussions latest 2016
De vry math 399 ilabs &amp; discussions latest 2016De vry math 399 ilabs &amp; discussions latest 2016
De vry math 399 ilabs &amp; discussions latest 2016lenasour
 
De vry math 399 ilabs &amp; discussions latest 2016 november
De vry math 399 ilabs &amp; discussions latest 2016 novemberDe vry math 399 ilabs &amp; discussions latest 2016 november
De vry math 399 ilabs &amp; discussions latest 2016 novemberlenasour
 
Excel Slope Instruction
Excel Slope InstructionExcel Slope Instruction
Excel Slope Instructiontotoros_girl
 
Problem I - Write your first name, middle name, and last name in c.docx
Problem I - Write your first name, middle name, and last name in c.docxProblem I - Write your first name, middle name, and last name in c.docx
Problem I - Write your first name, middle name, and last name in c.docxanitramcroberts
 
Correlations and Scatterplots MS Excel Lesson 2 Grade 8.ppt
Correlations and Scatterplots MS Excel Lesson 2 Grade 8.pptCorrelations and Scatterplots MS Excel Lesson 2 Grade 8.ppt
Correlations and Scatterplots MS Excel Lesson 2 Grade 8.pptJoshuaCasas7
 
100-Excel-Tips.pdf
100-Excel-Tips.pdf100-Excel-Tips.pdf
100-Excel-Tips.pdfBudSmoker2
 
LabsLab5Lab5_Excel_SH.htmlLab 5 SpreadsheetsLearning Outcomes.docx
LabsLab5Lab5_Excel_SH.htmlLab 5 SpreadsheetsLearning Outcomes.docxLabsLab5Lab5_Excel_SH.htmlLab 5 SpreadsheetsLearning Outcomes.docx
LabsLab5Lab5_Excel_SH.htmlLab 5 SpreadsheetsLearning Outcomes.docxDIPESH30
 
Sheet1NAMEYOUR DATAPOPULATION VARIABLESAMPLETYPE OF VARIABLEME.docx
Sheet1NAMEYOUR DATAPOPULATION VARIABLESAMPLETYPE OF VARIABLEME.docxSheet1NAMEYOUR DATAPOPULATION VARIABLESAMPLETYPE OF VARIABLEME.docx
Sheet1NAMEYOUR DATAPOPULATION VARIABLESAMPLETYPE OF VARIABLEME.docxmaoanderton
 
MANDATORY STANDARDS FOR ALL EXCEL STAT PACKS Consult Thi.docx
MANDATORY STANDARDS FOR ALL EXCEL STAT PACKS Consult Thi.docxMANDATORY STANDARDS FOR ALL EXCEL STAT PACKS Consult Thi.docx
MANDATORY STANDARDS FOR ALL EXCEL STAT PACKS Consult Thi.docxendawalling
 
Data Coding and Data Management using SPSS
Data Coding and Data Management using SPSSData Coding and Data Management using SPSS
Data Coding and Data Management using SPSSMelba Shaya Sweety
 
DataIDSalaryCompa-ratioMidpoint AgePerformance RatingServiceGender.docx
DataIDSalaryCompa-ratioMidpoint AgePerformance RatingServiceGender.docxDataIDSalaryCompa-ratioMidpoint AgePerformance RatingServiceGender.docx
DataIDSalaryCompa-ratioMidpoint AgePerformance RatingServiceGender.docxwhittemorelucilla
 
27 Excel Hacks to Make You a Superstar
27 Excel Hacks to Make You a Superstar27 Excel Hacks to Make You a Superstar
27 Excel Hacks to Make You a SuperstarAlan Murray
 
DataIDSalaryCompa-ratioMidpoint AgePerformance RatingServiceGender.docx
DataIDSalaryCompa-ratioMidpoint AgePerformance RatingServiceGender.docxDataIDSalaryCompa-ratioMidpoint AgePerformance RatingServiceGender.docx
DataIDSalaryCompa-ratioMidpoint AgePerformance RatingServiceGender.docxsimonithomas47935
 

Similar to Human Resources data analysis document table of contents (20)

In Section 1 on the Data page, complete each column of the spreads.docx
In Section 1 on the Data page, complete each column of the spreads.docxIn Section 1 on the Data page, complete each column of the spreads.docx
In Section 1 on the Data page, complete each column of the spreads.docx
 
De vry math 399 ilabs &amp; discussions latest 2016
De vry math 399 ilabs &amp; discussions latest 2016De vry math 399 ilabs &amp; discussions latest 2016
De vry math 399 ilabs &amp; discussions latest 2016
 
De vry math 399 ilabs &amp; discussions latest 2016 november
De vry math 399 ilabs &amp; discussions latest 2016 novemberDe vry math 399 ilabs &amp; discussions latest 2016 november
De vry math 399 ilabs &amp; discussions latest 2016 november
 
Preparing Data
Preparing DataPreparing Data
Preparing Data
 
Spreadsheets
SpreadsheetsSpreadsheets
Spreadsheets
 
Excel Slope Instruction
Excel Slope InstructionExcel Slope Instruction
Excel Slope Instruction
 
Problem I - Write your first name, middle name, and last name in c.docx
Problem I - Write your first name, middle name, and last name in c.docxProblem I - Write your first name, middle name, and last name in c.docx
Problem I - Write your first name, middle name, and last name in c.docx
 
Correlations and Scatterplots MS Excel Lesson 2 Grade 8.ppt
Correlations and Scatterplots MS Excel Lesson 2 Grade 8.pptCorrelations and Scatterplots MS Excel Lesson 2 Grade 8.ppt
Correlations and Scatterplots MS Excel Lesson 2 Grade 8.ppt
 
100-Excel-Tips.pdf
100-Excel-Tips.pdf100-Excel-Tips.pdf
100-Excel-Tips.pdf
 
Dealing with data-excel
Dealing with data-excelDealing with data-excel
Dealing with data-excel
 
LabsLab5Lab5_Excel_SH.htmlLab 5 SpreadsheetsLearning Outcomes.docx
LabsLab5Lab5_Excel_SH.htmlLab 5 SpreadsheetsLearning Outcomes.docxLabsLab5Lab5_Excel_SH.htmlLab 5 SpreadsheetsLearning Outcomes.docx
LabsLab5Lab5_Excel_SH.htmlLab 5 SpreadsheetsLearning Outcomes.docx
 
stats
statsstats
stats
 
Sheet1NAMEYOUR DATAPOPULATION VARIABLESAMPLETYPE OF VARIABLEME.docx
Sheet1NAMEYOUR DATAPOPULATION VARIABLESAMPLETYPE OF VARIABLEME.docxSheet1NAMEYOUR DATAPOPULATION VARIABLESAMPLETYPE OF VARIABLEME.docx
Sheet1NAMEYOUR DATAPOPULATION VARIABLESAMPLETYPE OF VARIABLEME.docx
 
MANDATORY STANDARDS FOR ALL EXCEL STAT PACKS Consult Thi.docx
MANDATORY STANDARDS FOR ALL EXCEL STAT PACKS Consult Thi.docxMANDATORY STANDARDS FOR ALL EXCEL STAT PACKS Consult Thi.docx
MANDATORY STANDARDS FOR ALL EXCEL STAT PACKS Consult Thi.docx
 
Data Coding and Data Management using SPSS
Data Coding and Data Management using SPSSData Coding and Data Management using SPSS
Data Coding and Data Management using SPSS
 
DataIDSalaryCompa-ratioMidpoint AgePerformance RatingServiceGender.docx
DataIDSalaryCompa-ratioMidpoint AgePerformance RatingServiceGender.docxDataIDSalaryCompa-ratioMidpoint AgePerformance RatingServiceGender.docx
DataIDSalaryCompa-ratioMidpoint AgePerformance RatingServiceGender.docx
 
27 Excel Hacks to Make You a Superstar
27 Excel Hacks to Make You a Superstar27 Excel Hacks to Make You a Superstar
27 Excel Hacks to Make You a Superstar
 
Lab 4 Excel Basics.ppt
Lab 4 Excel Basics.pptLab 4 Excel Basics.ppt
Lab 4 Excel Basics.ppt
 
Lab 4 excel basics
Lab 4 excel basicsLab 4 excel basics
Lab 4 excel basics
 
DataIDSalaryCompa-ratioMidpoint AgePerformance RatingServiceGender.docx
DataIDSalaryCompa-ratioMidpoint AgePerformance RatingServiceGender.docxDataIDSalaryCompa-ratioMidpoint AgePerformance RatingServiceGender.docx
DataIDSalaryCompa-ratioMidpoint AgePerformance RatingServiceGender.docx
 

More from perryk1

Take a few moments to research the contextual elements surrounding P.docx
Take a few moments to research the contextual elements surrounding P.docxTake a few moments to research the contextual elements surrounding P.docx
Take a few moments to research the contextual elements surrounding P.docxperryk1
 
Table of Contents Section 2 Improving Healthcare Quality from.docx
Table of Contents Section 2 Improving Healthcare Quality from.docxTable of Contents Section 2 Improving Healthcare Quality from.docx
Table of Contents Section 2 Improving Healthcare Quality from.docxperryk1
 
Take a company and build a unique solution not currently offered. Bu.docx
Take a company and build a unique solution not currently offered. Bu.docxTake a company and build a unique solution not currently offered. Bu.docx
Take a company and build a unique solution not currently offered. Bu.docxperryk1
 
Tackling a Crisis Head-onThis week, we will be starting our .docx
Tackling a Crisis Head-onThis week, we will be starting our .docxTackling a Crisis Head-onThis week, we will be starting our .docx
Tackling a Crisis Head-onThis week, we will be starting our .docxperryk1
 
take a look at the latest Presidential Order that relates to str.docx
take a look at the latest Presidential Order that relates to str.docxtake a look at the latest Presidential Order that relates to str.docx
take a look at the latest Presidential Order that relates to str.docxperryk1
 
Table of Contents-Perioperative Care.-Perioperative Med.docx
Table of Contents-Perioperative Care.-Perioperative Med.docxTable of Contents-Perioperative Care.-Perioperative Med.docx
Table of Contents-Perioperative Care.-Perioperative Med.docxperryk1
 
Take a look at the sculptures by Giacometti and Moore in your te.docx
Take a look at the sculptures by Giacometti and Moore in your te.docxTake a look at the sculptures by Giacometti and Moore in your te.docx
Take a look at the sculptures by Giacometti and Moore in your te.docxperryk1
 
Table of ContentsLOCAL PEOPLE PERCEPTION TOWARDS SUSTAINABLE TOU.docx
Table of ContentsLOCAL PEOPLE PERCEPTION TOWARDS SUSTAINABLE TOU.docxTable of ContentsLOCAL PEOPLE PERCEPTION TOWARDS SUSTAINABLE TOU.docx
Table of ContentsLOCAL PEOPLE PERCEPTION TOWARDS SUSTAINABLE TOU.docxperryk1
 
Table of Contents Title PageWELCOMETHE VAJRA.docx
Table of Contents Title PageWELCOMETHE VAJRA.docxTable of Contents Title PageWELCOMETHE VAJRA.docx
Table of Contents Title PageWELCOMETHE VAJRA.docxperryk1
 
Take a few minutes to reflect on this course. How has your think.docx
Take a few minutes to reflect on this course. How has your think.docxTake a few minutes to reflect on this course. How has your think.docx
Take a few minutes to reflect on this course. How has your think.docxperryk1
 
Taiwan The Tail That Wags DogsMichael McDevittAsia Po.docx
Taiwan The Tail That Wags DogsMichael McDevittAsia Po.docxTaiwan The Tail That Wags DogsMichael McDevittAsia Po.docx
Taiwan The Tail That Wags DogsMichael McDevittAsia Po.docxperryk1
 
TABLE 1-1 Milestones of Medicine and Medical Education 1700–2015 ■.docx
TABLE 1-1 Milestones of Medicine and Medical Education 1700–2015 ■.docxTABLE 1-1 Milestones of Medicine and Medical Education 1700–2015 ■.docx
TABLE 1-1 Milestones of Medicine and Medical Education 1700–2015 ■.docxperryk1
 
Tackling wicked problems A public policy perspective Ple.docx
Tackling wicked problems  A public policy perspective Ple.docxTackling wicked problems  A public policy perspective Ple.docx
Tackling wicked problems A public policy perspective Ple.docxperryk1
 
Tahira Longus Week 2 Discussion PostThe Public Administration.docx
Tahira Longus Week 2 Discussion PostThe Public Administration.docxTahira Longus Week 2 Discussion PostThe Public Administration.docx
Tahira Longus Week 2 Discussion PostThe Public Administration.docxperryk1
 
Tabular and Graphical PresentationsStatistics (exercises).docx
Tabular and Graphical PresentationsStatistics (exercises).docxTabular and Graphical PresentationsStatistics (exercises).docx
Tabular and Graphical PresentationsStatistics (exercises).docxperryk1
 
Table 4-5 CSFs for ERP ImplementationCritical Success Fact.docx
Table 4-5 CSFs for ERP ImplementationCritical Success Fact.docxTable 4-5 CSFs for ERP ImplementationCritical Success Fact.docx
Table 4-5 CSFs for ERP ImplementationCritical Success Fact.docxperryk1
 
Table 7.7 Comparative Financial Statistics Universal Office Fur.docx
Table 7.7 Comparative Financial Statistics Universal Office Fur.docxTable 7.7 Comparative Financial Statistics Universal Office Fur.docx
Table 7.7 Comparative Financial Statistics Universal Office Fur.docxperryk1
 
Tajfel and Turner (in chapter two of our reader) give us the followi.docx
Tajfel and Turner (in chapter two of our reader) give us the followi.docxTajfel and Turner (in chapter two of our reader) give us the followi.docx
Tajfel and Turner (in chapter two of our reader) give us the followi.docxperryk1
 
tabOccupational Safety & Health for Technologists, Enginee.docx
tabOccupational Safety & Health for Technologists, Enginee.docxtabOccupational Safety & Health for Technologists, Enginee.docx
tabOccupational Safety & Health for Technologists, Enginee.docxperryk1
 
Tableau Homework 3 – Exploring Chart Types with QVC Data .docx
Tableau Homework 3 – Exploring Chart Types with QVC Data  .docxTableau Homework 3 – Exploring Chart Types with QVC Data  .docx
Tableau Homework 3 – Exploring Chart Types with QVC Data .docxperryk1
 

More from perryk1 (20)

Take a few moments to research the contextual elements surrounding P.docx
Take a few moments to research the contextual elements surrounding P.docxTake a few moments to research the contextual elements surrounding P.docx
Take a few moments to research the contextual elements surrounding P.docx
 
Table of Contents Section 2 Improving Healthcare Quality from.docx
Table of Contents Section 2 Improving Healthcare Quality from.docxTable of Contents Section 2 Improving Healthcare Quality from.docx
Table of Contents Section 2 Improving Healthcare Quality from.docx
 
Take a company and build a unique solution not currently offered. Bu.docx
Take a company and build a unique solution not currently offered. Bu.docxTake a company and build a unique solution not currently offered. Bu.docx
Take a company and build a unique solution not currently offered. Bu.docx
 
Tackling a Crisis Head-onThis week, we will be starting our .docx
Tackling a Crisis Head-onThis week, we will be starting our .docxTackling a Crisis Head-onThis week, we will be starting our .docx
Tackling a Crisis Head-onThis week, we will be starting our .docx
 
take a look at the latest Presidential Order that relates to str.docx
take a look at the latest Presidential Order that relates to str.docxtake a look at the latest Presidential Order that relates to str.docx
take a look at the latest Presidential Order that relates to str.docx
 
Table of Contents-Perioperative Care.-Perioperative Med.docx
Table of Contents-Perioperative Care.-Perioperative Med.docxTable of Contents-Perioperative Care.-Perioperative Med.docx
Table of Contents-Perioperative Care.-Perioperative Med.docx
 
Take a look at the sculptures by Giacometti and Moore in your te.docx
Take a look at the sculptures by Giacometti and Moore in your te.docxTake a look at the sculptures by Giacometti and Moore in your te.docx
Take a look at the sculptures by Giacometti and Moore in your te.docx
 
Table of ContentsLOCAL PEOPLE PERCEPTION TOWARDS SUSTAINABLE TOU.docx
Table of ContentsLOCAL PEOPLE PERCEPTION TOWARDS SUSTAINABLE TOU.docxTable of ContentsLOCAL PEOPLE PERCEPTION TOWARDS SUSTAINABLE TOU.docx
Table of ContentsLOCAL PEOPLE PERCEPTION TOWARDS SUSTAINABLE TOU.docx
 
Table of Contents Title PageWELCOMETHE VAJRA.docx
Table of Contents Title PageWELCOMETHE VAJRA.docxTable of Contents Title PageWELCOMETHE VAJRA.docx
Table of Contents Title PageWELCOMETHE VAJRA.docx
 
Take a few minutes to reflect on this course. How has your think.docx
Take a few minutes to reflect on this course. How has your think.docxTake a few minutes to reflect on this course. How has your think.docx
Take a few minutes to reflect on this course. How has your think.docx
 
Taiwan The Tail That Wags DogsMichael McDevittAsia Po.docx
Taiwan The Tail That Wags DogsMichael McDevittAsia Po.docxTaiwan The Tail That Wags DogsMichael McDevittAsia Po.docx
Taiwan The Tail That Wags DogsMichael McDevittAsia Po.docx
 
TABLE 1-1 Milestones of Medicine and Medical Education 1700–2015 ■.docx
TABLE 1-1 Milestones of Medicine and Medical Education 1700–2015 ■.docxTABLE 1-1 Milestones of Medicine and Medical Education 1700–2015 ■.docx
TABLE 1-1 Milestones of Medicine and Medical Education 1700–2015 ■.docx
 
Tackling wicked problems A public policy perspective Ple.docx
Tackling wicked problems  A public policy perspective Ple.docxTackling wicked problems  A public policy perspective Ple.docx
Tackling wicked problems A public policy perspective Ple.docx
 
Tahira Longus Week 2 Discussion PostThe Public Administration.docx
Tahira Longus Week 2 Discussion PostThe Public Administration.docxTahira Longus Week 2 Discussion PostThe Public Administration.docx
Tahira Longus Week 2 Discussion PostThe Public Administration.docx
 
Tabular and Graphical PresentationsStatistics (exercises).docx
Tabular and Graphical PresentationsStatistics (exercises).docxTabular and Graphical PresentationsStatistics (exercises).docx
Tabular and Graphical PresentationsStatistics (exercises).docx
 
Table 4-5 CSFs for ERP ImplementationCritical Success Fact.docx
Table 4-5 CSFs for ERP ImplementationCritical Success Fact.docxTable 4-5 CSFs for ERP ImplementationCritical Success Fact.docx
Table 4-5 CSFs for ERP ImplementationCritical Success Fact.docx
 
Table 7.7 Comparative Financial Statistics Universal Office Fur.docx
Table 7.7 Comparative Financial Statistics Universal Office Fur.docxTable 7.7 Comparative Financial Statistics Universal Office Fur.docx
Table 7.7 Comparative Financial Statistics Universal Office Fur.docx
 
Tajfel and Turner (in chapter two of our reader) give us the followi.docx
Tajfel and Turner (in chapter two of our reader) give us the followi.docxTajfel and Turner (in chapter two of our reader) give us the followi.docx
Tajfel and Turner (in chapter two of our reader) give us the followi.docx
 
tabOccupational Safety & Health for Technologists, Enginee.docx
tabOccupational Safety & Health for Technologists, Enginee.docxtabOccupational Safety & Health for Technologists, Enginee.docx
tabOccupational Safety & Health for Technologists, Enginee.docx
 
Tableau Homework 3 – Exploring Chart Types with QVC Data .docx
Tableau Homework 3 – Exploring Chart Types with QVC Data  .docxTableau Homework 3 – Exploring Chart Types with QVC Data  .docx
Tableau Homework 3 – Exploring Chart Types with QVC Data .docx
 

Recently uploaded

Kisan Call Centre - To harness potential of ICT in Agriculture by answer farm...
Kisan Call Centre - To harness potential of ICT in Agriculture by answer farm...Kisan Call Centre - To harness potential of ICT in Agriculture by answer farm...
Kisan Call Centre - To harness potential of ICT in Agriculture by answer farm...Krashi Coaching
 
SOCIAL AND HISTORICAL CONTEXT - LFTVD.pptx
SOCIAL AND HISTORICAL CONTEXT - LFTVD.pptxSOCIAL AND HISTORICAL CONTEXT - LFTVD.pptx
SOCIAL AND HISTORICAL CONTEXT - LFTVD.pptxiammrhaywood
 
Industrial Policy - 1948, 1956, 1973, 1977, 1980, 1991
Industrial Policy - 1948, 1956, 1973, 1977, 1980, 1991Industrial Policy - 1948, 1956, 1973, 1977, 1980, 1991
Industrial Policy - 1948, 1956, 1973, 1977, 1980, 1991RKavithamani
 
Separation of Lanthanides/ Lanthanides and Actinides
Separation of Lanthanides/ Lanthanides and ActinidesSeparation of Lanthanides/ Lanthanides and Actinides
Separation of Lanthanides/ Lanthanides and ActinidesFatimaKhan178732
 
Activity 01 - Artificial Culture (1).pdf
Activity 01 - Artificial Culture (1).pdfActivity 01 - Artificial Culture (1).pdf
Activity 01 - Artificial Culture (1).pdfciinovamais
 
Employee wellbeing at the workplace.pptx
Employee wellbeing at the workplace.pptxEmployee wellbeing at the workplace.pptx
Employee wellbeing at the workplace.pptxNirmalaLoungPoorunde1
 
Privatization and Disinvestment - Meaning, Objectives, Advantages and Disadva...
Privatization and Disinvestment - Meaning, Objectives, Advantages and Disadva...Privatization and Disinvestment - Meaning, Objectives, Advantages and Disadva...
Privatization and Disinvestment - Meaning, Objectives, Advantages and Disadva...RKavithamani
 
Software Engineering Methodologies (overview)
Software Engineering Methodologies (overview)Software Engineering Methodologies (overview)
Software Engineering Methodologies (overview)eniolaolutunde
 
The Most Excellent Way | 1 Corinthians 13
The Most Excellent Way | 1 Corinthians 13The Most Excellent Way | 1 Corinthians 13
The Most Excellent Way | 1 Corinthians 13Steve Thomason
 
microwave assisted reaction. General introduction
microwave assisted reaction. General introductionmicrowave assisted reaction. General introduction
microwave assisted reaction. General introductionMaksud Ahmed
 
Paris 2024 Olympic Geographies - an activity
Paris 2024 Olympic Geographies - an activityParis 2024 Olympic Geographies - an activity
Paris 2024 Olympic Geographies - an activityGeoBlogs
 
URLs and Routing in the Odoo 17 Website App
URLs and Routing in the Odoo 17 Website AppURLs and Routing in the Odoo 17 Website App
URLs and Routing in the Odoo 17 Website AppCeline George
 
POINT- BIOCHEMISTRY SEM 2 ENZYMES UNIT 5.pptx
POINT- BIOCHEMISTRY SEM 2 ENZYMES UNIT 5.pptxPOINT- BIOCHEMISTRY SEM 2 ENZYMES UNIT 5.pptx
POINT- BIOCHEMISTRY SEM 2 ENZYMES UNIT 5.pptxSayali Powar
 
Accessible design: Minimum effort, maximum impact
Accessible design: Minimum effort, maximum impactAccessible design: Minimum effort, maximum impact
Accessible design: Minimum effort, maximum impactdawncurless
 
Contemporary philippine arts from the regions_PPT_Module_12 [Autosaved] (1).pptx
Contemporary philippine arts from the regions_PPT_Module_12 [Autosaved] (1).pptxContemporary philippine arts from the regions_PPT_Module_12 [Autosaved] (1).pptx
Contemporary philippine arts from the regions_PPT_Module_12 [Autosaved] (1).pptxRoyAbrique
 
Grant Readiness 101 TechSoup and Remy Consulting
Grant Readiness 101 TechSoup and Remy ConsultingGrant Readiness 101 TechSoup and Remy Consulting
Grant Readiness 101 TechSoup and Remy ConsultingTechSoup
 
Organic Name Reactions for the students and aspirants of Chemistry12th.pptx
Organic Name Reactions  for the students and aspirants of Chemistry12th.pptxOrganic Name Reactions  for the students and aspirants of Chemistry12th.pptx
Organic Name Reactions for the students and aspirants of Chemistry12th.pptxVS Mahajan Coaching Centre
 
Beyond the EU: DORA and NIS 2 Directive's Global Impact
Beyond the EU: DORA and NIS 2 Directive's Global ImpactBeyond the EU: DORA and NIS 2 Directive's Global Impact
Beyond the EU: DORA and NIS 2 Directive's Global ImpactPECB
 

Recently uploaded (20)

Kisan Call Centre - To harness potential of ICT in Agriculture by answer farm...
Kisan Call Centre - To harness potential of ICT in Agriculture by answer farm...Kisan Call Centre - To harness potential of ICT in Agriculture by answer farm...
Kisan Call Centre - To harness potential of ICT in Agriculture by answer farm...
 
SOCIAL AND HISTORICAL CONTEXT - LFTVD.pptx
SOCIAL AND HISTORICAL CONTEXT - LFTVD.pptxSOCIAL AND HISTORICAL CONTEXT - LFTVD.pptx
SOCIAL AND HISTORICAL CONTEXT - LFTVD.pptx
 
Industrial Policy - 1948, 1956, 1973, 1977, 1980, 1991
Industrial Policy - 1948, 1956, 1973, 1977, 1980, 1991Industrial Policy - 1948, 1956, 1973, 1977, 1980, 1991
Industrial Policy - 1948, 1956, 1973, 1977, 1980, 1991
 
Separation of Lanthanides/ Lanthanides and Actinides
Separation of Lanthanides/ Lanthanides and ActinidesSeparation of Lanthanides/ Lanthanides and Actinides
Separation of Lanthanides/ Lanthanides and Actinides
 
Activity 01 - Artificial Culture (1).pdf
Activity 01 - Artificial Culture (1).pdfActivity 01 - Artificial Culture (1).pdf
Activity 01 - Artificial Culture (1).pdf
 
Employee wellbeing at the workplace.pptx
Employee wellbeing at the workplace.pptxEmployee wellbeing at the workplace.pptx
Employee wellbeing at the workplace.pptx
 
TataKelola dan KamSiber Kecerdasan Buatan v022.pdf
TataKelola dan KamSiber Kecerdasan Buatan v022.pdfTataKelola dan KamSiber Kecerdasan Buatan v022.pdf
TataKelola dan KamSiber Kecerdasan Buatan v022.pdf
 
Privatization and Disinvestment - Meaning, Objectives, Advantages and Disadva...
Privatization and Disinvestment - Meaning, Objectives, Advantages and Disadva...Privatization and Disinvestment - Meaning, Objectives, Advantages and Disadva...
Privatization and Disinvestment - Meaning, Objectives, Advantages and Disadva...
 
Software Engineering Methodologies (overview)
Software Engineering Methodologies (overview)Software Engineering Methodologies (overview)
Software Engineering Methodologies (overview)
 
Mattingly "AI & Prompt Design: The Basics of Prompt Design"
Mattingly "AI & Prompt Design: The Basics of Prompt Design"Mattingly "AI & Prompt Design: The Basics of Prompt Design"
Mattingly "AI & Prompt Design: The Basics of Prompt Design"
 
The Most Excellent Way | 1 Corinthians 13
The Most Excellent Way | 1 Corinthians 13The Most Excellent Way | 1 Corinthians 13
The Most Excellent Way | 1 Corinthians 13
 
microwave assisted reaction. General introduction
microwave assisted reaction. General introductionmicrowave assisted reaction. General introduction
microwave assisted reaction. General introduction
 
Paris 2024 Olympic Geographies - an activity
Paris 2024 Olympic Geographies - an activityParis 2024 Olympic Geographies - an activity
Paris 2024 Olympic Geographies - an activity
 
URLs and Routing in the Odoo 17 Website App
URLs and Routing in the Odoo 17 Website AppURLs and Routing in the Odoo 17 Website App
URLs and Routing in the Odoo 17 Website App
 
POINT- BIOCHEMISTRY SEM 2 ENZYMES UNIT 5.pptx
POINT- BIOCHEMISTRY SEM 2 ENZYMES UNIT 5.pptxPOINT- BIOCHEMISTRY SEM 2 ENZYMES UNIT 5.pptx
POINT- BIOCHEMISTRY SEM 2 ENZYMES UNIT 5.pptx
 
Accessible design: Minimum effort, maximum impact
Accessible design: Minimum effort, maximum impactAccessible design: Minimum effort, maximum impact
Accessible design: Minimum effort, maximum impact
 
Contemporary philippine arts from the regions_PPT_Module_12 [Autosaved] (1).pptx
Contemporary philippine arts from the regions_PPT_Module_12 [Autosaved] (1).pptxContemporary philippine arts from the regions_PPT_Module_12 [Autosaved] (1).pptx
Contemporary philippine arts from the regions_PPT_Module_12 [Autosaved] (1).pptx
 
Grant Readiness 101 TechSoup and Remy Consulting
Grant Readiness 101 TechSoup and Remy ConsultingGrant Readiness 101 TechSoup and Remy Consulting
Grant Readiness 101 TechSoup and Remy Consulting
 
Organic Name Reactions for the students and aspirants of Chemistry12th.pptx
Organic Name Reactions  for the students and aspirants of Chemistry12th.pptxOrganic Name Reactions  for the students and aspirants of Chemistry12th.pptx
Organic Name Reactions for the students and aspirants of Chemistry12th.pptx
 
Beyond the EU: DORA and NIS 2 Directive's Global Impact
Beyond the EU: DORA and NIS 2 Directive's Global ImpactBeyond the EU: DORA and NIS 2 Directive's Global Impact
Beyond the EU: DORA and NIS 2 Directive's Global Impact
 

Human Resources data analysis document table of contents

  • 1. TableOfContentsTable of contents with hyperlinks for this documentExcluding standard worksheets that come with the original dataSheet namePurposeNotesOnDataPrep!A1Tips and tricks for students in doing data analysis in ExcelSalaryPivotTable!A1Using a histogram of salary to compare other variables in terms of chunks of salaryDescriptiveStatsForFrequency!A1Example of producing descriptive stats for chunks of a numeric variable (grouping, frequency table as 'categories')VariableDescriptiveStatsPHStat!A1Example of descriptive stats produced by PHStat and then edited, items removed that are not neededCorrelations!A1Instructor reference for how all variables are inter- relatedRegressionAge!A1Example of regression output highighting output to pay attention toSPSSRegressionAllEnter!A1Instructor reference - regressing salary on all independent variables to discern stongest, independent predictorsPivotTableCreatePercentPolygon!A1Example of comparing distributions between two categories with different number of cases or different scales, i.e., version of percent polygonAnalysis resultsGender univariate descriptive statisticsGenderAnalysis!A1Gender/Salary; Gender/Job Grade Classification analysis; Gender/other independent variables Salary histogram, distributionCompare gender/salary descriptive statisticsGenderCompareDescriptives!A1Comparison Table gender descriptive statistics in terms of all variables. This might be something worth doing.EthnicitySalaryAnalysis!A1Ethnicity/Salary analysisOptionalEthnicitySalaryAnalysis!A1Optional ethnicity/salary analysis - distribution of ethnicity over chunks of salary, percent polygonEthnicityJGClassAnalysis!A1Ethnicity/Job Grade Classification analysisAgeSalaryAnalysis!A1Age/Salary
  • 2. analysisAgeJobGradeClassAnalysis!A1Age/Job grade classification analysisYearsWorkedSalaryAnalysis!A1Years worked/Salary analysisYears worked/Job grade classification analysisRelationship between endogenous variablesJob grade classification/Salary analysisRelationship between independent variablesPercentPolygonGenderYearsWorked!A1Compare years worked distribution by gender; Example of comparing distributions between two categories with different number of cases or different scales, i.e., version of percent polygon Standard sheets that come with the dataVariable INFO'!A1Information on variablesHuman Resources DATA'!A1DataCross-Class-Table'!A1Summary Table'!A1Histogram!A1% Polygons 2 Groups'!A1Freq. & % Distribution'!A1 Variable INFOTableOfContents!A1The data are a random sample of 120 responses to a survey conducted by the VP of Human Resources at a large company.Source:INFO 501 class at Montclair State UniversityVariablesSalaryin thousands of dollars (K)Age in years YrsWorkin years JGClassjob-grade classification of 1, 3, 5, 7, 9, 11 (lowest skill job to highest skill job)Ethnicity1=Minority0=Not MinorityGender(Male, Female)Named ranges created in this worksheet - use these names to address the data more quickly then manually selecting dataUse the name of the range in dialog boxes rather than clicking and dragging ranges.Example of using names instead of manual ranges:50681.1320754717Female salary56465.671641791male salary-10%Percent difference Human Resources DATATableOfContents!A1SalaryAgeYrsWorkJGClassEthnicity CODEGender codeEthnicityGender$31,200191310MinorityFemale$40,400283 300Not MinorityFemale$42,600293510MinorityFemale$39,800262500N ot MinorityFemale$33,300222310MinorityFemale$35,600284300N ot
  • 3. MinorityFemale$34,200386310MinorityFemale$43,600353500N ot MinorityFemale$37,600285510MinorityFemale$34,600276310M inorityFemale$37,700361300Not MinorityFemale$48,100283500Not MinorityFemale$38,900362500Not MinorityFemale$46,7003310510MinorityFemale$58,000493900 Not MinorityFemale$52,200386500Not MinorityFemale$46,500453700Not MinorityFemale$52,300472700Not MinorityFemale$50,000308500Not MinorityFemale$54,200396710MinorityFemale$47,0006010500 Not MinorityFemale$57,500473700Not MinorityFemale$47,700624900Not MinorityFemale$49,000399500Not MinorityFemale$70,100535700Not MinorityFemale$60,000577700Not MinorityFemale$48,600432700Not MinorityFemale$57,000615700Not MinorityFemale$57,700337700Not MinorityFemale$47,800448700Not MinorityFemale$47,600513500Not MinorityFemale$59,000496900Not MinorityFemale$72,000473700Not MinorityFemale$43,500537710MinorityFemale$70,0003912900 Not MinorityFemale$54,100483500Not MinorityFemale$55,500495500Not MinorityFemale$60,000546700Not MinorityFemale$52,300484300Not MinorityFemale$67,000505700Not MinorityFemale$58,0005015710MinorityFemale$38,700503300 Not MinorityFemale$62,100513700Not MinorityFemale$65,500539900Not MinorityFemale$43,200623500Not MinorityFemale$67,50057121110MinorityFemale$56,70056670 0Not MinorityFemale$39,600583500Not
  • 4. MinorityFemale$39,2006014500Not MinorityFemale$58,500618700Not MinorityFemale$39,800645500Not MinorityFemale$67,500662900Not MinorityFemale$68,900675900Not MinorityFemale$39,600241501Not MinorityMale$33,400202311MinorityMale$42,100242511Minor ityMale$54,100311711MinorityMale$46,100274501Not MinorityMale$56,300392711MinorityMale$45,600373511Minor ityMale$48,500352711MinorityMale$54,600307701Not MinorityMale$50,100394701Not MinorityMale$47,100376501Not MinorityMale$46,800402501Not MinorityMale$44,100283711MinorityMale$56,100424701Not MinorityMale$37,500315301Not MinorityMale$45,500339501Not MinorityMale$43,500599711MinorityMale$45,000495701Not MinorityMale$67,500587701Not MinorityMale$62,000546911MinorityMale$56,700414701Not MinorityMale$48,100326301Not MinorityMale$45,000502711MinorityMale$50,000455711Minor ityMale$75,5004012901Not MinorityMale$66,0005641111MinorityMale$62,2004014911Min orityMale$47,500595711MinorityMale$53,000568501Not MinorityMale$56,700487701Not MinorityMale$54,900423501Not MinorityMale$53,200384711MinorityMale$45,600369711Minor ityMale$56,300492501Not MinorityMale$43,300492301Not MinorityMale$46,400365711MinorityMale$64,300543501Not MinorityMale$61,000367901Not MinorityMale$48,100389711MinorityMale$38,600486511Minor ityMale$56,0004714711MinorityMale$60,500519701Not MinorityMale$64,500497711MinorityMale$52,500519501Not MinorityMale$79,00052151101Not MinorityMale$76,500527901Not MinorityMale$60,000499901Not
  • 5. MinorityMale$62,500548911MinorityMale$72,20055151111Min orityMale$61,500569701Not MinorityMale$68,7005610901Not MinorityMale$82,30057151101Not MinorityMale$67,800575901Not MinorityMale$61,0005812711MinorityMale$67,800597911Mino rityMale$81,10059151101Not MinorityMale$45,6006016501Not MinorityMale$77,50062101101Not MinorityMale$68,000639901Not MinorityMale$73,00063151101Not MinorityMale$68,000688901Not MinorityMale$43,2006910501Not MinorityMale$76,000709901Not MinorityMale$69,5007118901Not MinorityMale$39,900728511MinorityMale$64,2007315911Mino rityMale$46,5007410501Not MinorityMale NotesOnDataPrepTips and tricks1. It will make the student's life easier to create named ranges in the data for the ranges they need. Simply sort, highlight the range, and in the box upper left, type in a name. Use that name in functions and formulas (e.g., quartile(), or descriptive stats - you can use named ranges in PHStat and Data Analysis Toolpack)2. Note that Pivot tables can provide all descriptive statistics except median, quartiles, IQR. If Zscores indicate that there is an outlier on one side, students should not be using the mean, but as a work around, you can ask them to note that, discuss what it means and then use the mean/SD anyway; OR you can require them to manually create those separately from the pivot table (or don't use a pivot table, use the data analysis toolpack or PHSTat).3. Instructions for producing a histogram/frequency table with a Pivot Table:a. Create a pivot table using the numeric variable (age) as the row labelb. Group the row label - Group button on ribbon. Choose chunks in dialog box.make sure you click in the data, not the header, or the button will be greyed outPlay with the beginning, end value and chunks to make bins common sense, i.e., 1-10, not 1-11c. Add anything you want to the Values box. Add items multiple times to get multiple stats about the same item.d. To
  • 6. work with data, it is frequently easier to copy pivot table data and paste as - paste as values.e. Word of warning: If you divide data into subcategories - chunks of salary for women, men - if there are no values for a category, Excel won't list it - you have to manually put a zero in for the value.4. Getting Excel stuff into Word for a report: It might be easier to paste as a picture object - easier to manipulate. PercentDifferenceCount of GenderColumn LabelsRow LabelsFemaleMaleGrand Total316.98%5.97%10.83%533.96%25.37%29.17%733.96%35.8 2%35.00%913.21%22.39%18.33%111.89%10.45%6.67%Grand Total100.00%100.00%100.00%Count of GenderColumn LabelsRow LabelsFemaleMale317%6%96%534%25%29%734%36%5%913 %22%52%112%10%139% Percent difference in Male to female Proportions 3 5 7 9 11 0.95950920245398763 0.28951115329852861 5.3268765133171914E-2 0.51582278481012667 1.3881278538812787 3 5 7 9 11 3 5 7 9 11 3 5 7 9 11 1 Job Levels LevelGenderRow LabelsAverage of Salary338484.6153846154Female37555.5555555556Male40575 546345.7142857143Female45250Male47505.882352941275480 9.5238095238Female57194.4444444444Male53020.8333333333 965740.9090909091Female62371.4285714286Male67313.33333 333331174825Female67500Male75871.4285714286Grand
  • 7. Total53910.8333333333 Average salary of gender on each level Total Female Male Female Male Female Male Female Male Female Male 3 5 7 9 11 37555.555555555555 40575 45250 47505.882352941175 57194.444444444445 53020.833333333336 62371.428571428572 67313.333333333328 67500 75871.428571428565 BiVariateDistributionChartAverage of SalaryColumn LabelsRow LabelsFemaleMaleGrand Total30000- 3999936938.46153846153780037177.777777777840000- 4999945878.57142857144568045761.764705882350000- 5999955533.333333333354321.428571428654948.27586206960 000-6999964812.564578.947368421164648.148148148170000- 799997070075671.42857142867418080000- 900008170081700Grand Total50681.132075471756465.67164179153910.8333333333 Gender average salary comparison by salary level Female 30000-39999 40000-49999 50000-59999 60000- 69999 70000-79999 80000-90000 36938.461538461539 4587 8.571428571428 55533.333333333336 64812.5 70700 Male 30000-39999 40000-49999 50000-59999 60000-69999 70000-79999 80000-90000 37800 45680 54321.428571428572 64578.947368421053 75671.428571428565 81700
  • 8. Salary ranges Average salary GenderDescriptiveStatsTableOfContents!A1Gender/salary comparison - descriptive statisticsRun descriptive statistics twice - once with named range "malesalary" and again with "femalesalary", then copy and paste them next to each otherColumn1Column1Comparing male and female salary<== table title centered across columnsStatisticMaleFemale<==row headers differentiated from dataMean56465.671641791Mean50681.1320754717Mean$ 56,466$ 50,681<==number formattingStandard Error1474.68546001Standard Error1515.0288634913Standard Error$ 1,475$ 1,515<==all statistics that are NOT being used are REMOVEDMedian56000Median49000Median$ 56,000$ 49,000Mode45600Mode39800Standard Deviation$ 12,071$ 11,030Standard Deviation12070.8207177324Standard Deviation11029.5766116484Range$ 48,900$ 40,800Sample Variance145704712.799638Sample Variance121651560.232221Minimum$ 33,400$ 31,200Kurtosis-0.8044449928Kurtosis- 0.9313514963Maximum$ 82,300$ 72,000Skewness0.3244762148Skewness0.1887693789Count675 3Range48900Range40800Minimum33400Minimum31200Maxim um82300Maximum72000Sum3783200Sum2686100Count67Coun t53 GenderDescriptiveStats (2)TableOfContents!A1Gender/salary comparison - descriptive statisticsRun descriptive statistics twice - once with named range "malesalary" and again with "femalesalary", then copy and paste them next to each
  • 9. otherTable 1<== Start with labeleling each table by number, sequentially (charts too - call them "Figure x")Column1Column1Comparing male and female salary<== table title centered across columns or left justified, meaningful, not abstractStatisticMaleaFemale<==row headers differentiated from data (bold); lines above and below column headersMean56465.671641791Mean50681.1320754717Count67 53<==If you want to show subsets of statistics, use an italicized header, indent followingStandard Error1474.68546001Standard Error1515.0288634913Measures of central tendency<==indented to show part of type of statisticMedian56000Median49000Mean$ 56,466$ 50,681<==number formattingMode45600Mode39800Median$ 56,000$ 49,000Standard Deviation12070.8207177324Standard Deviation11029.5766116484Measures of central variance90%Sample Variance145704712.799638Sample Variance121651560.232221Standard Deviation$ 12,071$ 11,030Kurtosis-0.8044449928Kurtosis-0.9313514963Minimum$ 33,400$ 31,2000.9375Skewness0.3244762148Skewness0.1887693789Ma ximum$ 82,300$ 72,0000.7162162162Range48900Range40800Range$ 48,900$ 40,8000.9137387481Minimum33400Minimum31200Test for outliersMaximum82300Maximum72000Zscore of Minimum-1.9- 1.8Sum3783200Sum2686100Zscore of Maximum2.11.9Count67Count53Source: Random sample of 120 RJCorp employees, June 2015<==Note: All statistics that are NOT being used are REMOVEDa Notation if needed (superscript used after header "Male" above as an example SalaryDistributionHistogramTable of contentsSalary histogram/distributionRow LabelsCount of Salary30000- 399991840000-499993450000-599992960000-699992770000- 799991080000-900002Grand Total120Row LabelsCount of Salary30-39K1840-49K3450-59K2960-69K2770-79K1080-89K2 Histogram of salary
  • 10. Total 30000-39999 40000-49999 50000-59999 60000- 69999 70000-79999 80000-90000 18 34 29 27 10 2 Salary levels (in dollars) Number of employees Figure 1: Distribution of salaries in RJ Corp Count of Salary 30-39K 40-49K 50-59K 60-69K 70-79K 80-89K 18 34 29 27 10 2 Salary Number of employees GenderDescriptiveStatistics (2Categorical variable descriptive statistics produced through a pivot tablePivot table outputRow LabelsCount of GenderCount of Gender2Female5344.17%12%Male6755.83%Grand Total120100.00%Copy, paste special, paste as a value:Row LabelsCount of GenderCount of Gender2Female530.4416666667Male670.5583333333Grand Total1201Format in an attractive manner by standards of good table formatting (see Chapter 9, or PowerPoint)Note: I've used format as a table from the Home ribbon, the selected "Convert to Range" button to get rid of special drop downs.Table 1Gender descriptive statistics<==Title centered across columns or left justified, bold; meaningfulGenderCountPercent of total<==Column/row headers formatted to distinguish from
  • 11. data, centeredFemale5344%<==Number formatting used - percentage formatting in this caseMale6756%Grand Total120100%0.2641509434 SalaryDescriptiveStatistics (2Table of contentsSalary descriptive statisticsColumn1Table 2Salary descriptive statistics<== table title centered across columns or left justified; meaningfulMean53910.8333333333StatisticFigures<==row / column headers differentiated from dataStandard Error1088.9229612112Mean$ 53,911<==number formattingMedian53100Median$ 53,100<==all statistics that are NOT being used are REMOVEDMode48100Standard Deviation$ 11,929Standard Deviation11928.5533848133Range$ 51,100Sample Variance142290385.854342Minimum$ 31,200Kurtosis- 0.6661524346Maximum$ 82,300Skewness0.3069257671Count120Range51100Minimum31 200Maximum82300Sum6469300Count120 Formatted output from Data Analysis Toolpack, Descriptive Statistics function GenderAgeSalaryAverage of SalaryColumn LabelsAverage of SalaryColumn LabelsRow LabelsFemaleMaleRow LabelsFemaleMale<20$31,20030000- 3999936938.46153846153780020-29$39,000$41,06040000- 4999945878.57142857144568030-39$48,564$49,44750000- 5999955533.333333333354321.428571428640- 49$54,873$54,84060000-6999964812.564578.947368421150- 59$56,638$63,91470000-799997070075671.428571428660- 69$52,089$62,55080000-900008170070-80$59,220 Comparing gender average salary by age group Female < 20 20-29 30-39 40-49 50-59 60-69 70-80 31200 39000 48563.63636363636 54872.727272727272
  • 12. 56638.461538461539 52088.888888888891 Male < 20 20-29 30-39 40-49 50-59 60-69 70-80 41060 49446.666666666664 54840 63914.285714285717 62550 59220 Age groups Average salary GenderSalaryAvgRow LabelsAverage of SalaryCount of SalaryPercent differenceFemale$50,68153- 10.24%Male$56,46667Grand Total$53,911120GenderAverage of SalaryCount of SalaryPercent differenceFemale$ 50,68153- 10%Male$ 56,46667 Average of Salary Female Male 50681.132075471702 56465.671641791043 AgeAnalysisPivot table producing descriptive statistics for chunks of age (age histogram)TableOfContents!A1Row LabelsCount of AgeAverage of SalaryStdDev of SalaryMin of SalaryMax of Salary<201$31,200ERROR:#DIV/0!$31,200$31,20020- 2913$39,792$4,773$33,300$48,10030- 3926$49,073$7,724$34,200$70,00040- 4926$54,854$8,235$38,600$75,50050- 5934$61,132$11,434$38,700$82,30060- 6915$56,273$13,295$39,200$77,50070- 805$59,220$15,388$39,900$76,000Grand Total120$53,911$11,929$31,200$82,300Row LabelsCount of AgeAverage of SalaryStdDev of SalaryMin of SalaryMax of
  • 13. Salaryrangecoefficient of variationnegative Zscorepositive Zscore15-245$ 35,920$ 4,670$ 31,200$ 42,100$ 10,90013%-1.011.3225-3417$ 44,888$ 6,832$ 34,600$ 57,700$ 23,10015%-1.511.8835-4426$ 51,165$ 9,192$ 34,200$ 75,500$ 41,30018%-1.852.6545-5435$ 56,926$ 9,876$ 38,600$ 79,000$ 40,40017%-1.862.2455-6428$ 59,293$ 12,956$ 39,200$ 82,300$ 43,10022%-1.551.7865- 759$ 60,411$ 13,371$ 39,900$ 76,000$ 36,10022%- 1.531.17Instructions:1. Create a pivot table using the numeric variable (age) as the row label2. Group the row label - Group button on ribbon. Choose chunks in dialog box.3. Add anything you want to the Values box. Add items multiple times to get multiple stats about the same item.4. To work with data, it is frequently easier to copy pivot table data and paste as - paste as values. copy this, paste as values below Age Line Fit Plot Salary 19 28 29 26 22 28 38 35 28 27 36 28 36 33 49 38 45 47 30 39 60 47 62 39 53 57 43 61 33 44 51 49 47 53 39 48 49 54 48 50 50 50 51 53 62 57 56 58 60 61 64 66 67 24 20 24 31 27 39 37 35 30 39 37 40 28 42 31 33 59 49 58 54 41 32 50 45 40 56 40 59 56 48 42 38 36 49 49 36 54 36 38 48 47 51 49 51 52 52 49 54 55 56 56 57 57 58 59 59 60 62 63 63 68 69 70 71 72 73 74 31200 40400 42600 39800 33300 35600 34200 43600 37600 34600 37700 48100 38900 46700 58000 52200 46500 52300 50000 54200 47000 57500 47700 49000 70100 60000 48600 57000 57700 47800 47600 59000 72000 43500 70000 54100 55500 60000 52300 67000 58000 38700 62100 65500 43200 67500 56700 39600 39200 58500 39800 67500 68900
  • 14. 39600 33400 42100 54100 46100 56300 45600 48500 54600 50100 47100 46800 44100 56100 37500 45500 43500 45000 67500 62000 56700 48100 45000 50000 75500 66000 62200 47500 53000 56700 54900 53200 45600 56300 43300 46400 64300 61000 48100 38600 56000 60500 64500 52500 79000 76500 60000 62500 72200 61500 68700 82300 67800 61000 67800 81100 45600 77500 68000 73000 68000 43200 76000 69500 39900 64200 46500 Predicted Salary 19 28 29 26 22 28 38 35 28 27 36 28 36 33 49 38 45 47 30 39 60 47 62 39 53 57 43 61 33 44 51 49 47 53 39 48 49 54 48 50 50 50 51 53 62 57 56 58 60 61 64 66 67 24 20 24 31 27 39 37 35 30 39 37 40 28 42 31 33 59 49 58 54 41 32 50 45 40 56 40 59 56 48 42 38 36 49 49 36 54 36 38 48 47 51 49 51 52 52 49 54 55 56 56 57 57 58 59 59 60 62 63 63 68 69 70 71 72 73 74 1 Age Salary Simply create formulas here referencing values to the left VariableDescriptiveStatsPHStatTableOfContents!A1PHStat ouput - Descriptive Statistics for HumanResources.xlsxDescriptive SummarySalaryAgeYrsWorkJGClassEthnicityGenderMean$53,9 11476.476.620.320.56Median$53,100496701Mode$48,10049370 1Minimum$31,200191300Maximum$82,30074181111Range$51, 1005517811Variance142290385.8543167.781515.94854.59130. 21820.2487Standard Deviation$11,92912.95313.99362.14270.46710.4987Coeff. of Variation22.13%27.56%61.76%32.38%147.51%89.31%Skewnes s0.3069-0.09860.85450.18340.7982-0.2379Kurtosis-0.6662-
  • 15. 0.72830.0532-0.5082-1.3862- 1.9766Count120120120120120120Standard Error1088.92301.18240.36460.19560.04260.0455Descriptive statistics summarySalaryGenderMean$53,9110.56Median$53,1001Mode$ 48,1001Minimum$31,2000Maximum$82,3001Range$51,1001Sta ndard Deviation$11,9290.4987Coeff. of Variation22.13%89.31%Count120120 Students should get rid of anything that is not covered in the course and they don't understand in the output. Tables should have headers differentiated, number formatting done, centered data. GenderAnalysisTableOfContents!A1Analysis of varibles in terms of gender via pivot tableRow LabelsCount of GenderPercentAverage of SalaryStdDev of SalaryAverage of AgeAverage of YrsWorkAverage of JGClassAverage of EthnicityCODEFemale5344.17%$50,681$11,03045.35.36.00.2M ale6755.83%$56,466$12,07148.37.47.10.4Grand Total120100.00%$53,911$11,92947.06.56.60.3Instructions:1. Create a pivot table using the categorical variable (gender) as the row label2. Add anything you want to the Values box. Add items multiple times to get multiple stats about the same item.3. To work with data, it is frequently easier to copy pivot table data and paste as - paste as values.Descriptive StatisticsEndogenous variablesOther independent variablesSalaryJGClassAgeYrsWorkEthnicityCODEFemaleMale FemaleMaleFemaleMaleFemaleMaleFemaleMaleMean$ 50,681$ 56,4665.987.1245.3448.315.307.390.210.40Standard Error$ 1,515$ 1,4750.270.261.721.610.450.530.060.06Median$ 49,000$ 56,0005748495700Mode$ 39,800$ 45,6005728493900Standard Deviation$ 11,030$ 12,0711.992.1412.5513.213.244.300.410.49Range$ 40,800$ 48,900884854141711Minimum$ 31,200$ 33,4003319201100Maximum$ 72,000$ 82,30011116774151811Count53675367536753675367Coefficien
  • 16. t of variance22%21%33%30%28%27%61%58%197%123%Zscore negative$ (1.77)$ (1.91)-1.50-1.92-2.10-2.14-1.33-1.48-0.51- 0.82Zscore positive$ 1.93$ 2.142.531.811.731.942.992.471.941.21Quartile 1$ 40,400$ 46,25055363834nanaQuartile 3$ 58,000$ 65,25079545479nanaInter Quartile Range$ 17,600$ 19,00024181645nanaNote: I created special named ranges in the data to make it easier - e.g., SalaryFemale, SalaryMale SalaryPivotTableTableOfContents!A1Analysis of variables in terms of chunks of salaryRow LabelsCount of SalaryAverage of AgeAverage of EthnicityCODEAverage of Gender codeAverage of YrsWorkAverage of JGClass30000- 399991838.170.440.284.224.0040000- 499993443.650.380.595.595.7150000- 599992944.930.240.485.556.4560000- 699992756.190.330.708.008.3370000- 799991053.300.100.7010.309.4080000- 89999258.000.001.0015.0011.00Grand Total120470.31666666670.55833333336.46666666676.6166666 667Instructions:1. Create a pivot table using the numeric variable (age) as the row label2. Group the row label - Group button on ribbon. Choose chunks in dialog box.3. Add anything you want to the Values box. Add items multiple times to get multiple stats about the same item.4. To work with data, it is frequently easier to copy pivot table data and paste as - paste as values. GenderCompareDescriptivesTableOfContents!A1Table comparing descriptve statistics for all variables in terms of genderSalaryAgeYrsWorkJGClassEthnicityCODEFemaleMaleFe maleMaleFemaleMaleFemaleMaleFemaleMaleMean$ 50,681$ 56,46645.348.35.37.46.07.10.20.4Standard Error$ 1,515$ 1,4751.71.60.40.50.30.30.10.1Median$ 49,000$ 56,0004849575700Mode$ 39,800$ 45,6002849395700Standard Deviation$ 11,030$ 12,07112.513.23.24.32.02.10.40.5Sample
  • 17. Variance121651560.232221145704712.799638157.38243831641 74.551786521910.522496371618.5137946633.94194484764.591 5875170.16763425250.2442333786Kurtosis-0.9313514963- 0.8044449928-0.92511818-0.68184286471.0936677151- 0.4368448489-0.4548349394-0.56765894360.2105423988- 1.8936805556Skewness0.18876937890.3244762148- 0.2357663046- 0.04283899741.17274434330.57474266330.21092724420.10688 051461.48460232580.4046946723Range$ 40,800$ 48,900485414178811Minimum$ 31,200$ 33,4001920113300Maximum$ 72,000$ 82,30067741518111111Sum26861003783200240332372814953 174771127Count53675367536753675367MaleSalaryAgeYrsWor kJGClassEthnicityCODEMean56465.671641791Mean48.313432 8358Mean7.3880597015Mean7.1194029851Mean0.4029850746 Standard Error1474.68546001Standard Error1.6140788534Standard Error0.5256665231Standard Error0.2617845621Standard Error0.0603761071Median56000Median49Median7Median7Med ian0Mode45600Mode49Mode9Mode7Mode0Standard Deviation12070.8207177324Standard Deviation13.211804817Standard Deviation4.3027659317Standard Deviation2.1427989913Standard Deviation0.4941997355Sample Variance145704712.799638Sample Variance174.5517865219Sample Variance18.513794663Sample Variance4.591587517Sample Variance0.2442333786Kurtosis- 0.8044449928Kurtosis-0.6818428647Kurtosis- 0.4368448489Kurtosis-0.5676589436Kurtosis- 1.8936805556Skewness0.3244762148Skewness- 0.0428389974Skewness0.5747426633Skewness0.1068805146Sk ewness0.4046946723Range48900Range54Range17Range8Range 1Minimum33400Minimum20Minimum1Minimum3Minimum0Ma ximum82300Maximum74Maximum18Maximum11Maximum1Su m3783200Sum3237Sum495Sum477Sum27Count67Count67Coun t67Count67Count67
  • 18. PivotTableCreatePercentPolygonTableOfContents!A1Pivot table used to create percent polygon - comparing percents of males vs. females in terms of chunks of ageRow LabelsCount of AgeCount of Age2Female5344.17%FemaleMale<2011.89%15- 243.77%4.48%20-29815.09%25-3418.87%10.45%30- 391120.75%35-4418.87%23.88%40-491120.75%45- 5433.96%25.37%50-591324.53%55-6420.75%25.37%60- 69916.98%65-753.77%10.45%Male6755.83%20-2957.46%30- 391522.39%40-491522.39%50-592131.34%60-6968.96%70- 8057.46%Grand Total120100.00%Instructions1. Pivot table created using gender and then age as row labels2. Group age row labels3. Create a count column (not necessary)4. Drag age again to the values box. 5. Chage values - click Show Values As, choose Percent Of Parent Row Total6. Copy data, paste as values, then create a line chart with that- you will have to check the row labels - if there are no values in a chunk, Excel will not … TableOfContentsTable of contents with hyperlinks for this documentExcluding standard worksheets that come with the original dataSheet namePurposeNotesOnDataPrep!A1Tips and tricks for students in doing data analysis in ExcelSalaryPivotTable!A1Using a histogram of salary to compare other variables in terms of chunks of salaryDescriptiveStatsForFrequency!A1Example of producing descriptive stats for chunks of a numeric variable (grouping, frequency table as 'categories')VariableDescriptiveStatsPHStat!A1Example of descriptive stats produced by PHStat and then edited, items removed that are not neededCorrelations!A1Instructor reference for how all variables are inter- relatedRegressionAge!A1Example of regression output highighting output to pay attention toSPSSRegressionAllEnter!A1Instructor reference - regressing salary on all independent variables to discern stongest, independent
  • 19. predictorsPivotTableCreatePercentPolygon!A1Example of comparing distributions between two categories with different number of cases or different scales, i.e., version of percent polygonAnalysis resultsGender univariate descriptive statisticsGenderAnalysis!A1Gender/Salary; Gender/Job Grade Classification analysis; Gender/other independent variables Salary histogram, distributionCompare gender/salary descriptive statisticsGenderCompareDescriptives!A1Comparison Table gender descriptive statistics in terms of all variables. This might be something worth doing.EthnicitySalaryAnalysis!A1Ethnicity/Salary analysisOptionalEthnicitySalaryAnalysis!A1Optional ethnicity/salary analysis - distribution of ethnicity over chunks of salary, percent polygonEthnicityJGClassAnalysis!A1Ethnicity/Job Grade Classification analysisAgeSalaryAnalysis!A1Age/Salary analysisAgeJobGradeClassAnalysis!A1Age/Job grade classification analysisYearsWorkedSalaryAnalysis!A1Years worked/Salary analysisYears worked/Job grade classification analysisRelationship between endogenous variablesJob grade classification/Salary analysisRelationship between independent variablesPercentPolygonGenderYearsWorked!A1Compare years worked distribution by gender; Example of comparing distributions between two categories with different number of cases or different scales, i.e., version of percent polygon Standard sheets that come with the dataVariable INFO'!A1Information on variablesHuman Resources DATA'!A1DataCross-Class-Table'!A1Summary Table'!A1Histogram!A1% Polygons 2 Groups'!A1Freq. & % Distribution'!A1 Variable INFOTableOfContents!A1The data are a random sample of 120 responses to a survey conducted by the VP of Human Resources at a large company.Source:INFO 501 class at Montclair State UniversityVariablesSalaryin thousands of dollars (K)Age in years YrsWorkin years JGClassjob-grade classification of 1, 3, 5, 7, 9, 11 (lowest skill job to highest
  • 20. skill job)Ethnicity1=Minority0=Not MinorityGender(Male, Female)Named ranges created in this worksheet - use these names to address the data more quickly then manually selecting dataUse the name of the range in dialog boxes rather than clicking and dragging ranges.Example of using names instead of manual ranges:50681.1320754717Female salary56465.671641791male salary-10%Percent difference Human Resources DATATableOfContents!A1SalaryAgeYrsWorkJGClassEthnicity CODEGender codeEthnicityGender$31,200191310MinorityFemale$40,400283 300Not MinorityFemale$42,600293510MinorityFemale$39,800262500N ot MinorityFemale$33,300222310MinorityFemale$35,600284300N ot MinorityFemale$34,200386310MinorityFemale$43,600353500N ot MinorityFemale$37,600285510MinorityFemale$34,600276310M inorityFemale$37,700361300Not MinorityFemale$48,100283500Not MinorityFemale$38,900362500Not MinorityFemale$46,7003310510MinorityFemale$58,000493900 Not MinorityFemale$52,200386500Not MinorityFemale$46,500453700Not MinorityFemale$52,300472700Not MinorityFemale$50,000308500Not MinorityFemale$54,200396710MinorityFemale$47,0006010500 Not MinorityFemale$57,500473700Not MinorityFemale$47,700624900Not MinorityFemale$49,000399500Not MinorityFemale$70,100535700Not MinorityFemale$60,000577700Not MinorityFemale$48,600432700Not MinorityFemale$57,000615700Not MinorityFemale$57,700337700Not
  • 21. MinorityFemale$47,800448700Not MinorityFemale$47,600513500Not MinorityFemale$59,000496900Not MinorityFemale$72,000473700Not MinorityFemale$43,500537710MinorityFemale$70,0003912900 Not MinorityFemale$54,100483500Not MinorityFemale$55,500495500Not MinorityFemale$60,000546700Not MinorityFemale$52,300484300Not MinorityFemale$67,000505700Not MinorityFemale$58,0005015710MinorityFemale$38,700503300 Not MinorityFemale$62,100513700Not MinorityFemale$65,500539900Not MinorityFemale$43,200623500Not MinorityFemale$67,50057121110MinorityFemale$56,70056670 0Not MinorityFemale$39,600583500Not MinorityFemale$39,2006014500Not MinorityFemale$58,500618700Not MinorityFemale$39,800645500Not MinorityFemale$67,500662900Not MinorityFemale$68,900675900Not MinorityFemale$39,600241501Not MinorityMale$33,400202311MinorityMale$42,100242511Minor ityMale$54,100311711MinorityMale$46,100274501Not MinorityMale$56,300392711MinorityMale$45,600373511Minor ityMale$48,500352711MinorityMale$54,600307701Not MinorityMale$50,100394701Not MinorityMale$47,100376501Not MinorityMale$46,800402501Not MinorityMale$44,100283711MinorityMale$56,100424701Not MinorityMale$37,500315301Not MinorityMale$45,500339501Not MinorityMale$43,500599711MinorityMale$45,000495701Not MinorityMale$67,500587701Not MinorityMale$62,000546911MinorityMale$56,700414701Not MinorityMale$48,100326301Not
  • 22. MinorityMale$45,000502711MinorityMale$50,000455711Minor ityMale$75,5004012901Not MinorityMale$66,0005641111MinorityMale$62,2004014911Min orityMale$47,500595711MinorityMale$53,000568501Not MinorityMale$56,700487701Not MinorityMale$54,900423501Not MinorityMale$53,200384711MinorityMale$45,600369711Minor ityMale$56,300492501Not MinorityMale$43,300492301Not MinorityMale$46,400365711MinorityMale$64,300543501Not MinorityMale$61,000367901Not MinorityMale$48,100389711MinorityMale$38,600486511Minor ityMale$56,0004714711MinorityMale$60,500519701Not MinorityMale$64,500497711MinorityMale$52,500519501Not MinorityMale$79,00052151101Not MinorityMale$76,500527901Not MinorityMale$60,000499901Not MinorityMale$62,500548911MinorityMale$72,20055151111Min orityMale$61,500569701Not MinorityMale$68,7005610901Not MinorityMale$82,30057151101Not MinorityMale$67,800575901Not MinorityMale$61,0005812711MinorityMale$67,800597911Mino rityMale$81,10059151101Not MinorityMale$45,6006016501Not MinorityMale$77,50062101101Not MinorityMale$68,000639901Not MinorityMale$73,00063151101Not MinorityMale$68,000688901Not MinorityMale$43,2006910501Not MinorityMale$76,000709901Not MinorityMale$69,5007118901Not MinorityMale$39,900728511MinorityMale$64,2007315911Mino rityMale$46,5007410501Not MinorityMale NotesOnDataPrepTips and tricks1. It will make the student's life easier to create named ranges in the data for the ranges they need. Simply sort, highlight the range, and in the box upper left, type in a name. Use that name in functions and formulas (e.g., quartile(), or descriptive stats - you can use named ranges
  • 23. in PHStat and Data Analysis Toolpack)2. Note that Pivot tables can provide all descriptive statistics except median, quartiles, IQR. If Zscores indicate that there is an outlier on one side, students should not be using the mean, but as a work around, you can ask them to note that, discuss what it means and then use the mean/SD anyway; OR you can require them to manually create those separately from the pivot table (or don't use a pivot table, use the data analysis toolpack or PHSTat).3. Instructions for producing a histogram/frequency table with a Pivot Table:a. Create a pivot table using the numeric variable (age) as the row labelb. Group the row label - Group button on ribbon. Choose chunks in dialog box.make sure you click in the data, not the header, or the button will be greyed outPlay with the beginning, end value and chunks to make bins common sense, i.e., 1-10, not 1-11c. Add anything you want to the Values box. Add items multiple times to get multiple stats about the same item.d. To work with data, it is frequently easier to copy pivot table data and paste as - paste as values.e. Word of warning: If you divide data into subcategories - chunks of salary for women, men - if there are no values for a category, Excel won't list it - you have to manually put a zero in for the value.4. Getting Excel stuff into Word for a report: It might be easier to paste as a picture object - easier to manipulate. PercentDifferenceCount of GenderColumn LabelsRow LabelsFemaleMaleGrand Total316.98%5.97%10.83%533.96%25.37%29.17%733.96%35.8 2%35.00%913.21%22.39%18.33%111.89%10.45%6.67%Grand Total100.00%100.00%100.00%Count of GenderColumn LabelsRow LabelsFemaleMale317%6%96%534%25%29%734%36%5%913 %22%52%112%10%139% Percent difference in Male to female Proportions 3 5 7 9 11 0.95950920245398763
  • 24. 0.28951115329852861 5.3268765133171914E-2 0.51582278481012667 1.3881278538812787 3 5 7 9 11 3 5 7 9 11 3 5 7 9 11 1 Job Levels LevelGenderRow LabelsAverage of Salary338484.6153846154Female37555.5555555556Male40575 546345.7142857143Female45250Male47505.882352941275480 9.5238095238Female57194.4444444444Male53020.8333333333 965740.9090909091Female62371.4285714286Male67313.33333 333331174825Female67500Male75871.4285714286Grand Total53910.8333333333 Average salary of gender on each level Total Female Male Female Male Female Male Female Male Female Male 3 5 7 9 11 37555.555555555555 40575 45250 47505.882352941175 57194.444444444445 53020.833333333336 62371.428571428572 67313.333333333328 67500 75871.428571428565 BiVariateDistributionChartAverage of SalaryColumn LabelsRow LabelsFemaleMaleGrand Total30000- 3999936938.46153846153780037177.777777777840000- 4999945878.57142857144568045761.764705882350000-
  • 25. 5999955533.333333333354321.428571428654948.27586206960 000-6999964812.564578.947368421164648.148148148170000- 799997070075671.42857142867418080000- 900008170081700Grand Total50681.132075471756465.67164179153910.8333333333 Gender average salary comparison by salary level Female 30000-39999 40000-49999 50000-59999 60000- 69999 70000-79999 80000-90000 36938.461538461539 4587 8.571428571428 55533.333333333336 64812.5 70700 Male 30000-39999 40000-49999 50000-59999 60000-69999 70000-79999 80000-90000 37800 45680 54321.428571428572 64578.947368421053 75671.428571428565 81700 Salary ranges Average salary GenderDescriptiveStatsTableOfContents!A1Gender/salary comparison - descriptive statisticsRun descriptive statistics twice - once with named range "malesalary" and again with "femalesalary", then copy and paste them next to each otherColumn1Column1Comparing male and female salary<== table title centered across columnsStatisticMaleFemale<==row headers differentiated from dataMean56465.671641791Mean50681.1320754717Mean$ 56,466$ 50,681<==number formattingStandard Error1474.68546001Standard Error1515.0288634913Standard Error$ 1,475$ 1,515<==all statistics that are NOT being used
  • 26. are REMOVEDMedian56000Median49000Median$ 56,000$ 49,000Mode45600Mode39800Standard Deviation$ 12,071$ 11,030Standard Deviation12070.8207177324Standard Deviation11029.5766116484Range$ 48,900$ 40,800Sample Variance145704712.799638Sample Variance121651560.232221Minimum$ 33,400$ 31,200Kurtosis-0.8044449928Kurtosis- 0.9313514963Maximum$ 82,300$ 72,000Skewness0.3244762148Skewness0.1887693789Count675 3Range48900Range40800Minimum33400Minimum31200Maxim um82300Maximum72000Sum3783200Sum2686100Count67Coun t53 GenderDescriptiveStats (2)TableOfContents!A1Gender/salary comparison - descriptive statisticsRun descriptive statistics twice - once with named range "malesalary" and again with "femalesalary", then copy and paste them next to each otherTable 1<== Start with labeleling each table by number, sequentially (charts too - call them "Figure x")Column1Column1Comparing male and female salary<== table title centered across columns or left justified, meaningful, not abstractStatisticMaleaFemale<==row headers differentiated from data (bold); lines above and below column headersMean56465.671641791Mean50681.1320754717Count67 53<==If you want to show subsets of statistics, use an italicized header, indent followingStandard Error1474.68546001Standard Error1515.0288634913Measures of central tendency<==indented to show part of type of statisticMedian56000Median49000Mean$ 56,466$ 50,681<==number formattingMode45600Mode39800Median$ 56,000$ 49,000Standard Deviation12070.8207177324Standard Deviation11029.5766116484Measures of central variance90%Sample Variance145704712.799638Sample Variance121651560.232221Standard Deviation$ 12,071$ 11,030Kurtosis-0.8044449928Kurtosis-0.9313514963Minimum$ 33,400$ 31,2000.9375Skewness0.3244762148Skewness0.1887693789Ma
  • 27. ximum$ 82,300$ 72,0000.7162162162Range48900Range40800Range$ 48,900$ 40,8000.9137387481Minimum33400Minimum31200Test for outliersMaximum82300Maximum72000Zscore of Minimum-1.9- 1.8Sum3783200Sum2686100Zscore of Maximum2.11.9Count67Count53Source: Random sample of 120 RJCorp employees, June 2015<==Note: All statistics that are NOT being used are REMOVEDa Notation if needed (superscript used after header "Male" above as an example SalaryDistributionHistogramTable of contentsSalary histogram/distributionRow LabelsCount of Salary30000- 399991840000-499993450000-599992960000-699992770000- 799991080000-900002Grand Total120Row LabelsCount of Salary30-39K1840-49K3450-59K2960-69K2770-79K1080-89K2 Histogram of salary Total 30000-39999 40000-49999 50000-59999 60000- 69999 70000-79999 80000-90000 18 34 29 27 10 2 Salary levels (in dollars) Number of employees Figure 1: Distribution of salaries in RJ Corp Count of Salary 30-39K 40-49K 50-59K 60-69K 70-79K 80-89K 18 34 29 27 10 2 Salary Number of employees
  • 28. GenderDescriptiveStatistics (2Categorical variable descriptive statistics produced through a pivot tablePivot table outputRow LabelsCount of GenderCount of Gender2Female5344.17%12%Male6755.83%Grand Total120100.00%Copy, paste special, paste as a value:Row LabelsCount of GenderCount of Gender2Female530.4416666667Male670.5583333333Grand Total1201Format in an attractive manner by standards of good table formatting (see Chapter 9, or PowerPoint)Note: I've used format as a table from the Home ribbon, the selected "Convert to Range" button to get rid of special drop downs.Table 1Gender descriptive statistics<==Title centered across columns or left justified, bold; meaningfulGenderCountPercent of total<==Column/row headers formatted to distinguish from data, centeredFemale5344%<==Number formatting used - percentage formatting in this caseMale6756%Grand Total120100%0.2641509434 SalaryDescriptiveStatistics (2Table of contentsSalary descriptive statisticsColumn1Table 2Salary descriptive statistics<== table title centered across columns or left justified; meaningfulMean53910.8333333333StatisticFigures<==row / column headers differentiated from dataStandard Error1088.9229612112Mean$ 53,911<==number formattingMedian53100Median$ 53,100<==all statistics that are NOT being used are REMOVEDMode48100Standard Deviation$ 11,929Standard Deviation11928.5533848133Range$ 51,100Sample Variance142290385.854342Minimum$ 31,200Kurtosis- 0.6661524346Maximum$ 82,300Skewness0.3069257671Count120Range51100Minimum31 200Maximum82300Sum6469300Count120 Formatted output from Data Analysis Toolpack, Descriptive Statistics function
  • 29. GenderAgeSalaryAverage of SalaryColumn LabelsAverage of SalaryColumn LabelsRow LabelsFemaleMaleRow LabelsFemaleMale<20$31,20030000- 3999936938.46153846153780020-29$39,000$41,06040000- 4999945878.57142857144568030-39$48,564$49,44750000- 5999955533.333333333354321.428571428640- 49$54,873$54,84060000-6999964812.564578.947368421150- 59$56,638$63,91470000-799997070075671.428571428660- 69$52,089$62,55080000-900008170070-80$59,220 Comparing gender average salary by age group Female < 20 20-29 30-39 40-49 50-59 60-69 70-80 31200 39000 48563.63636363636 54872.727272727272 56638.461538461539 52088.888888888891 Male < 20 20-29 30-39 40-49 50-59 60-69 70-80 41060 49446.666666666664 54840 63914.285714285717 62550 59220 Age groups Average salary GenderSalaryAvgRow LabelsAverage of SalaryCount of SalaryPercent differenceFemale$50,68153- 10.24%Male$56,46667Grand Total$53,911120GenderAverage of SalaryCount of SalaryPercent differenceFemale$ 50,68153- 10%Male$ 56,46667 Average of Salary Female Male 50681.132075471702 56465.671641791043
  • 30. AgeAnalysisPivot table producing descriptive statistics for chunks of age (age histogram)TableOfContents!A1Row LabelsCount of AgeAverage of SalaryStdDev of SalaryMin of SalaryMax of Salary<201$31,200ERROR:#DIV/0!$31,200$31,20020- 2913$39,792$4,773$33,300$48,10030- 3926$49,073$7,724$34,200$70,00040- 4926$54,854$8,235$38,600$75,50050- 5934$61,132$11,434$38,700$82,30060- 6915$56,273$13,295$39,200$77,50070- 805$59,220$15,388$39,900$76,000Grand Total120$53,911$11,929$31,200$82,300Row LabelsCount of AgeAverage of SalaryStdDev of SalaryMin of SalaryMax of Salaryrangecoefficient of variationnegative Zscorepositive Zscore15-245$ 35,920$ 4,670$ 31,200$ 42,100$ 10,90013%-1.011.3225-3417$ 44,888$ 6,832$ 34,600$ 57,700$ 23,10015%-1.511.8835-4426$ 51,165$ 9,192$ 34,200$ 75,500$ 41,30018%-1.852.6545-5435$ 56,926$ 9,876$ 38,600$ 79,000$ 40,40017%-1.862.2455-6428$ 59,293$ 12,956$ 39,200$ 82,300$ 43,10022%-1.551.7865- 759$ 60,411$ 13,371$ 39,900$ 76,000$ 36,10022%- 1.531.17Instructions:1. Create a pivot table using the numeric variable (age) as the row label2. Group the row label - Group button on ribbon. Choose chunks in dialog box.3. Add anything you want to the Values box. Add items multiple times to get multiple stats about the same item.4. To work with data, it is frequently easier to copy pivot table data and paste as - paste as values. copy this, paste as values below Age Line Fit Plot Salary 19 28 29 26 22 28 38 35 28 27 36 28 36 33 49 38 45 47 30 39 60 47 62 39 53 57 43 61 33 44 51 49 47 53 39
  • 31. 48 49 54 48 50 50 50 51 53 62 57 56 58 60 61 64 66 67 24 20 24 31 27 39 37 35 30 39 37 40 28 42 31 33 59 49 58 54 41 32 50 45 40 56 40 59 56 48 42 38 36 49 49 36 54 36 38 48 47 51 49 51 52 52 49 54 55 56 56 57 57 58 59 59 60 62 63 63 68 69 70 71 72 73 74 31200 40400 42600 39800 33300 35600 34200 43600 37600 34600 37700 48100 38900 46700 58000 52200 46500 52300 50000 54200 47000 57500 47700 49000 70100 60000 48600 57000 57700 47800 47600 59000 72000 43500 70000 54100 55500 60000 52300 67000 58000 38700 62100 65500 43200 67500 56700 39600 39200 58500 39800 67500 68900 39600 33400 42100 54100 46100 56300 45600 48500 54600 50100 47100 46800 44100 56100 37500 45500 43500 45000 67500 62000 56700 48100 45000 50000 75500 66000 62200 47500 53000 56700 54900 53200 45600 56300 43300 46400 64300 61000 48100 38600 56000 60500 64500 52500 79000 76500 60000 62500 72200 61500 68700 82300 67800 61000 67800 81100 45600 77500 68000 73000 68000 43200 76000 69500 39900 64200 46500 Predicted Salary 19 28 29 26 22 28 38 35 28 27 36 28 36 33 49 38 45 47 30 39 60 47 62 39 53 57 43 61 33 44 51 49 47 53 39 48 49 54 48 50 50 50 51 53 62 57 56 58 60 61 64 66 67 24 20 24 31 27 39 37 35 30 39 37 40 28 42 31 33 59 49 58 54 41 32 50 45 40 56 40 59 56 48 42 38 36 49 49 36 54 36 38 48 47 51 49 51 52 52 49 54 55
  • 32. 56 56 57 57 58 59 59 60 62 63 63 68 69 70 71 72 73 74 1 Age Salary Simply create formulas here referencing values to the left VariableDescriptiveStatsPHStatTableOfContents!A1PHStat ouput - Descriptive Statistics for HumanResources.xlsxDescriptive SummarySalaryAgeYrsWorkJGClassEthnicityGenderMean$53,9 11476.476.620.320.56Median$53,100496701Mode$48,10049370 1Minimum$31,200191300Maximum$82,30074181111Range$51, 1005517811Variance142290385.8543167.781515.94854.59130. 21820.2487Standard Deviation$11,92912.95313.99362.14270.46710.4987Coeff. of Variation22.13%27.56%61.76%32.38%147.51%89.31%Skewnes s0.3069-0.09860.85450.18340.7982-0.2379Kurtosis-0.6662- 0.72830.0532-0.5082-1.3862- 1.9766Count120120120120120120Standard Error1088.92301.18240.36460.19560.04260.0455Descriptive statistics summarySalaryGenderMean$53,9110.56Median$53,1001Mode$ 48,1001Minimum$31,2000Maximum$82,3001Range$51,1001Sta ndard Deviation$11,9290.4987Coeff. of Variation22.13%89.31%Count120120 Students should get rid of anything that is not covered in the course and they don't understand in the output. Tables should have headers differentiated, number formatting done, centered data. GenderAnalysisTableOfContents!A1Analysis of varibles in terms of gender via pivot tableRow LabelsCount of GenderPercentAverage of SalaryStdDev of SalaryAverage of AgeAverage of YrsWorkAverage of JGClassAverage of EthnicityCODEFemale5344.17%$50,681$11,03045.35.36.00.2M ale6755.83%$56,466$12,07148.37.47.10.4Grand Total120100.00%$53,911$11,92947.06.56.60.3Instructions:1. Create a pivot table using the categorical variable (gender) as
  • 33. the row label2. Add anything you want to the Values box. Add items multiple times to get multiple stats about the same item.3. To work with data, it is frequently easier to copy pivot table data and paste as - paste as values.Descriptive StatisticsEndogenous variablesOther independent variablesSalaryJGClassAgeYrsWorkEthnicityCODEFemaleMale FemaleMaleFemaleMaleFemaleMaleFemaleMaleMean$ 50,681$ 56,4665.987.1245.3448.315.307.390.210.40Standard Error$ 1,515$ 1,4750.270.261.721.610.450.530.060.06Median$ 49,000$ 56,0005748495700Mode$ 39,800$ 45,6005728493900Standard Deviation$ 11,030$ 12,0711.992.1412.5513.213.244.300.410.49Range$ 40,800$ 48,900884854141711Minimum$ 31,200$ 33,4003319201100Maximum$ 72,000$ 82,30011116774151811Count53675367536753675367Coefficien t of variance22%21%33%30%28%27%61%58%197%123%Zscore negative$ (1.77)$ (1.91)-1.50-1.92-2.10-2.14-1.33-1.48-0.51- 0.82Zscore positive$ 1.93$ 2.142.531.811.731.942.992.471.941.21Quartile 1$ 40,400$ 46,25055363834nanaQuartile 3$ 58,000$ 65,25079545479nanaInter Quartile Range$ 17,600$ 19,00024181645nanaNote: I created special named ranges in the data to make it easier - e.g., SalaryFemale, SalaryMale SalaryPivotTableTableOfContents!A1Analysis of variables in terms of chunks of salaryRow LabelsCount of SalaryAverage of AgeAverage of EthnicityCODEAverage of Gender codeAverage of YrsWorkAverage of JGClass30000- 399991838.170.440.284.224.0040000- 499993443.650.380.595.595.7150000- 599992944.930.240.485.556.4560000- 699992756.190.330.708.008.3370000- 799991053.300.100.7010.309.4080000- 89999258.000.001.0015.0011.00Grand Total120470.31666666670.55833333336.46666666676.6166666
  • 34. 667Instructions:1. Create a pivot table using the numeric variable (age) as the row label2. Group the row label - Group button on ribbon. Choose chunks in dialog box.3. Add anything you want to the Values box. Add items multiple times to get multiple stats about the same item.4. To work with data, it is frequently easier to copy pivot table data and paste as - paste as values. GenderCompareDescriptivesTableOfContents!A1Table comparing descriptve statistics for all variables in terms of genderSalaryAgeYrsWorkJGClassEthnicityCODEFemaleMaleFe maleMaleFemaleMaleFemaleMaleFemaleMaleMean$ 50,681$ 56,46645.348.35.37.46.07.10.20.4Standard Error$ 1,515$ 1,4751.71.60.40.50.30.30.10.1Median$ 49,000$ 56,0004849575700Mode$ 39,800$ 45,6002849395700Standard Deviation$ 11,030$ 12,07112.513.23.24.32.02.10.40.5Sample Variance121651560.232221145704712.799638157.38243831641 74.551786521910.522496371618.5137946633.94194484764.591 5875170.16763425250.2442333786Kurtosis-0.9313514963- 0.8044449928-0.92511818-0.68184286471.0936677151- 0.4368448489-0.4548349394-0.56765894360.2105423988- 1.8936805556Skewness0.18876937890.3244762148- 0.2357663046- 0.04283899741.17274434330.57474266330.21092724420.10688 051461.48460232580.4046946723Range$ 40,800$ 48,900485414178811Minimum$ 31,200$ 33,4001920113300Maximum$ 72,000$ 82,30067741518111111Sum26861003783200240332372814953 174771127Count53675367536753675367MaleSalaryAgeYrsWor kJGClassEthnicityCODEMean56465.671641791Mean48.313432 8358Mean7.3880597015Mean7.1194029851Mean0.4029850746 Standard Error1474.68546001Standard Error1.6140788534Standard Error0.5256665231Standard Error0.2617845621Standard Error0.0603761071Median56000Median49Median7Median7Med ian0Mode45600Mode49Mode9Mode7Mode0Standard
  • 35. Deviation12070.8207177324Standard Deviation13.211804817Standard Deviation4.3027659317Standard Deviation2.1427989913Standard Deviation0.4941997355Sample Variance145704712.799638Sample Variance174.5517865219Sample Variance18.513794663Sample Variance4.591587517Sample Variance0.2442333786Kurtosis- 0.8044449928Kurtosis-0.6818428647Kurtosis- 0.4368448489Kurtosis-0.5676589436Kurtosis- 1.8936805556Skewness0.3244762148Skewness- 0.0428389974Skewness0.5747426633Skewness0.1068805146Sk ewness0.4046946723Range48900Range54Range17Range8Range 1Minimum33400Minimum20Minimum1Minimum3Minimum0Ma ximum82300Maximum74Maximum18Maximum11Maximum1Su m3783200Sum3237Sum495Sum477Sum27Count67Count67Coun t67Count67Count67 PivotTableCreatePercentPolygonTableOfContents!A1Pivot table used to create percent polygon - comparing percents of males vs. females in terms of chunks of ageRow LabelsCount of AgeCount of Age2Female5344.17%FemaleMale<2011.89%15- 243.77%4.48%20-29815.09%25-3418.87%10.45%30- 391120.75%35-4418.87%23.88%40-491120.75%45- 5433.96%25.37%50-591324.53%55-6420.75%25.37%60- 69916.98%65-753.77%10.45%Male6755.83%20-2957.46%30- 391522.39%40-491522.39%50-592131.34%60-6968.96%70- 8057.46%Grand Total120100.00%Instructions1. Pivot table created using gender and then age as row labels2. Group age row labels3. Create a count column (not necessary)4. Drag age again to the values box. 5. Chage values - click Show Values As, choose Percent Of Parent Row Total6. Copy data, paste as values, then create a line chart with that- you will have to check the row labels - if there are no values in a chunk, Excel will not … StudentSurveyVariableListVariables and measures Count=192 casesSurveys from semesters Fall 16 through Spring 17, from
  • 36. Prof. William Colucci and Daphne Hanrahan's BUGN280 coursesVariable labelVariable full referenceScale (if any)type of variabledateWhen the survey was taken nanominalClassLevelWhat is your class designation?nanominal or ordinalGenderWhat is your gender?nanominalTransferIs Montclair the only college you have attended,or are you a transfer student?nanominalFullPartTimeAre you a full-time or part-time student at MSU?nanominalClassesTakingHow many 3- credit classes are you taking this semester?naordinalHoursWorkHow many hours/week do you work? Answer with an average. Please use only numbers, e.g. 5, 11, etc.naordinalWhat is your majorWhat is your major?nanominalChoiceOfMajorHow strongly do you feel about your choice of major? On a scale of 1 to 7, 1 is uncertain and 7 is very enthousiatic/passionate.On a scale of 1 to 7, 1 is uncertain and 7 is very enthousiatic/passionate.nominalHSAverageGradeWhat is your overall average high school grade?nanumericMontclairGPAWhat is your Montclair GPA?nanumericAgeWhat is your age? Use numbers only.nanumericComputerTypeIs your primary school computer a PC or Mac?nanumericConfidentStatsHow confident are you of your mastery of business statistics now that you have taken INFO 240 (or equivelent for transfer students)?1 is not at all confident and 7 is extremely confident.numericConfidentWritingHow confident are you of your mastery of business writing now that you have taken the prerequisite writing course?1 is not at all confident and 7 is extremely confident.numericConfidentSpeakingHow confident are you of your mastery of public speaking? 1 is not at all confident and 7 is extremely confident.numericInterestInCampaignHow interested are/were you in the 2016 Presidential campaign? 1 is not at all interested and 7 is extremely passionate.nominalPartyWhat political party do you identify with?nanominalHaveVotedHave you ever voted?nanominalWillVoteWill you vote in the presidential
  • 37. election?nanominalHoursStudyPerWeekHow many hours do you study for all courses per week on average?nanumericCommuteDormDo you commute or live in a dorm?nacategoricalMediaWhich media do you use the most?nanominal StudentSurveyDatasectionsection_idsubmitted4719453: What is your class designation?4719454: What is your gender?4719455: Is Montclair the only college you have attended, or are you a transfer student?4719469: Do you commute or live in a dorm?4719456: Are you a full-time or part-time student at MSU?4719458: How many hours/week do you work for pay?  Answer with an average.  4719457: How many 3-credit classes are you taking this semester?4719459: What is your major?4719460: How strongly do you feel about your choice of major?  On a scale of 1 to 7, 1 is uncertain and 7 is very enthousiatic/passionate.4719462: What is your Montclair GPA?4719461: What is your overall average high school grade?4719463: What is your age? Use numbers only.4719464: Is your primary school computer a PC or Mac?4719465: How confident are you of your mastery of business statistics now that you have taken INFO 240 (or equivelent for transfer students)?  1 is not at all confident and 7 is extremely confident.4719466: How confident are you of your mastery of business writing now that you have taken the prerequisite writing course?  1 is not at all confident and 7 is extremely confident. 4719467: How confident are you of your mastery of public speaking?  1 is not at all confident and 7 is extremely confident. 4719468: How many hours a week do you study on average? Please use numbers only.4719470: Which media do you use the most? Check the box next to each media you use at least a couple of times a week. 4719471: Did you vote in the last presidential election?4719472: Have you ever
  • 38. voted?ElectionInterestNOTICE THERE IS AN EMPTY ROW BELOW THIS ROW - AN EMPTY ROW/COLUMN AROUND A CONTINUOUS BODY OF DATA IS AUTOMATICALLY RECOGNIZED BY EXCEL AS THE DATA YOU ARE GOING TO ADDRESS WITH A PIVOT TABLE (UNLESS YOU HAVE HIGHLIGHTED A FEW CELLS - SO JUST CLICK ON ONE CELL IN THE BODY OF THE DATA TO START A PIVOT TABLE.sectionsection_idsubmittedClassClassNumGenderGende rNumTransferTransferNumCommuteDormCommuteDormNumF TPTHoursPayClassesNumMajorMajorFeelMSUGPAHSAverage AgePCMacConfStatsConfWritingConfSPeakingHoursStudyWee kSocialMediaTopVoteLastElectionEverVotedElectionInterestBU GN280_22SP16Junior3Male1Transfer0Full Time20463.7521Mac353Yes6BUGN280_22SP16Junior3Female0 Montclair only1Full Time30412.121Mac341No4BUGN280_22SP16Junior3Male1Tra nsfer0Full Time40463.222Mac561Yes3BUGN280_22SP16Junior3Male1Tra nsfer0Full Time40462.931PC422No4BUGN280_22SP16Junior3Female0Tra nsfer0Full Time50452.821Mac453No5BUGN280_22SP16Junior3Male1Tra nsfer0Full Time50473.224PC177Yes4BUGN280_22SP16Sophmore2Male1 Transfer0Full Time30463.319PC464No5BUGN280_22SP16Senior4Male1Tran sfer0Full Time45372.833Mac455Yes1BUGN280_22SP16Junior3Male1Tra nsfer0Full Time0372.922Mac777Yes7BUGN280_22SP16Junior3Male1Tran sfer0Part Time45363.4529Mac666Yes5BUGN280_22SP16Junior3Female0 Transfer0Part Time6037324PC467Yes7BUGN280_22SU162016-06-13 22:26:45 UTCSenior4Female0Transfer0Commute0Full Time06Marketing63.279034Mac5476Facebook7BUGN280_13S
  • 39. P162016-01-28 19:46:01 UTCSenior4Female0Transfer0Commute0Full Time386Management73.48522Mac56510InstagramNo3BUGN28 0_22SU162016-06-13 22:31:04 UTCSenior4Female0Transfer0Live in dorm1Full Time406Marketing62.98522Mac5347Instagram7BUGN280_13S P162016-01-28 19:48:01 UTCJunior3Male1Montclair only1Live in dorm1Full Time06Other22.67520PC33710FacebookNo4BUGN280_15SP16 2016-01-27 22:40:36 UTCJunior3Female0Transfer0Commute0Full Time166Accounting63.269021Mac77720InstagramYes5BUGN2 80_13SP162016-01-28 19:50:11 UTCJunior3Female0Transfer0Commute0Full Time406Other73.38026Mac45310InstagramNo1BUGN280_15SP 162016-01-27 22:43:30 UTCJunior3Female0Montclair only1Live in dorm1Full Time186Marketing43.49520Mac46618InstagramNo4BUGN280_ 04SP162016-01-28 15:23:35 UTCJunior3Female0Transfer0Live in dorm1Full Time206Management73.148021PC34510InstagramNo1BUGN28 0_13SP162016-01-28 19:47:01 UTCJunior3Female0Montclair only1Commute0Full Time136Finance73.179022PC57520ReadItNo6BUGN280_15SP1 62016-01-27 22:44:13 UTCJunior3Female0Transfer0Commute0Full Time306Finance63.328022Neither65515SnapChatYes5BUGN28 0_04SP162016-01-28 15:22:51 UTCJunior3Male1Transfer0Live in dorm1Full Time06Marketing63.58521PC5362SnapChatYes1BUGN280_04S P162016-01-28 15:23:24 UTCJunior3Male1Transfer0Live in dorm1Full Time06Finance538520PC3566TwitterNo6BUGN280_16SP16201 6-01-26 23:15:52 UTCJunior3Male1Transfer0Commute0Full Time206749520PC56714Yes7BUGN280_16SP162016-01-26 23:15:10 UTCJunior3Male1Transfer0Commute0Full
  • 40. Time40663.29525PC66530No6BUGN280_22SP16Junior3Femal e0Montclair only1Full Time20652.820Mac544No4BUGN280_22SP16Junior3Female0T ransfer0Full Time30663.9522Mac554No3BUGN280_04SP162016-01-28 15:22:20 UTCSophmore2Female0Montclair only1Commute0Full Time17.56Marketing63.29519Mac1568InstagramYes5BUGN280 _15SP162016-01-27 22:43:37 UTCSophmore2Male1Montclair only1Commute0Full Time226Accounting43.529519PC4557InstagramNo2BUGN280_ 13SP162016-01-28 19:46:53 UTCSophmore2Female0Montclair only1Commute0Full Time406Finance73.29019Mac47515InstagramNo2BUGN280_04 SP162016-01-28 15:22:51 UTCSophmore2Female0Montclair only1Live in dorm1Full Time126Marketing52.78519Mac45310SnapChatNo6BUGN280_ 22SP16Sophmore2Male1Montclair only1Full Time30663.3419Mac577No7BUGN280_13SP162016-01-28 19:48:50 UTCFreshman1Male1Montclair only1Commute0Full Time206Accounting73.759019Mac34220SnapChatNo4BUGN28 0_16SP162016-01-26 23:14:21 UTCFreshman1Female0Montclair only1Live in dorm1Full Time15663.48018PC35115No5BUGN280_22SP16Freshman1Ma le1Montclair only1Full Time0663.6318Mac553No4BUGN280_13SP162016-01-28 19:47:00 UTCJunior3Male1Montclair only1Commute0Full Time05Marketing52.48521PC5446FacebookNo5BUGN280_04S P162016-01-28 15:25:40 UTCJunior3Female0Transfer0Commute0Full Time205Accounting53.58522PC5547FacebookNo6BUGN280_1 5SP162016-01-27 22:46:52 UTCJunior3Female0Transfer0Live in dorm1Full Time305Marketing73.49021Neither54315FacebookYes6BUGN2 80_13SP162016-01-28 19:45:06 UTCJunior3Male1Transfer0Commute0Full Time255Finance63.57522Mac5566InstagramYes1BUGN280_15
  • 41. SP162016-01-27 22:44:13 UTCJunior3Male1Transfer0Commute0Full Time42.55Information Management648025Mac65510LinkedInNo3BUGN280_15SP162 016-01-27 22:41:28 UTCJunior3Male1Transfer0Commute0Full Time145Accounting53.38022PC3566ReadItNo6BUGN280_13SP 162016-01-28 19:53:00 UTCJunior3Male1Montclair only1Commute0Full Time135Marketing538520PC2553SnapChatNo1BUGN280_13SP 162016-01-28 19:48:15 UTCJunior3Female0Transfer0Commute0Full Time205Other73.19023PC55320SnapChatYes6BUGN280_15SP 162016-01-27 22:41:08 UTCJunior3Male1Transfer0Commute0Full Time335Marketing53.29022Mac3345SnapChatYes3BUGN280_1 3SP162016-01-28 19:47:15 UTCJunior3Male1Transfer0Live in dorm1Full Time05Management639022Mac45413SnapChatNo2BUGN280_1 3SP162016-01-28 19:44:33 UTCJunior3Female0Transfer0Commute0Full Time155Accounting33.69521Mac67115TwitterNo2BUGN280_1 3SP162016-01-28 19:51:39 UTCJunior3Male1Transfer0Live in dorm1Full Time05Finance53.498521Mac5349TwitterNo4BUGN280_16SP1 62016-01-26 23:15:04 UTCJunior3Male1Transfer0Commute0Full Time40562.88523Mac4551Yes4BUGN280_16SP162016-01-26 23:16:07 UTCJunior3Male1Transfer0Live in dorm1Full Time15553.099024PC5435Yes6BUGN280_22SP16Junior3Male 1Transfer0Full Time17.5562.822PC456Yes1BUGN280_22SP16Junior3Female0 Transfer0Full Time27573.5421PC755No4BUGN280_22SP16Junior3Male1Mo ntclair only1Full Time30563.221Mac455Yes6BUGN280_22SP16Junior3Male1Mo ntclair only1Full
  • 42. Time40572.821PC557No5BUGN280_22SP16Junior3Male1Mont clair only1Full Time4555321PC645No5BUGN280_04SP162016-01-28 15:24:07 UTCSophmore2Female0Montclair only1Commute0Full Time85Management63.488518PC45110FacebookNo6BUGN280 _15SP162016-01-27 22:41:34 UTCSophmore2Female0Montclair only1Live in dorm1Full Time05Finance43.38519PC3528FacebookNo2BUGN280_15SP1 62016-01-27 22:42:27 UTCSophmore2Female0Montclair only1Live in dorm1Full Time85Management53.39020Mac31310FacebookYes3BUGN280 _04SP162016-01-28 15:23:29 UTCSophmore2Male1Montclair only1Commute0Full Time105Marketing73.5448519Mac2668InstagramNo1BUGN280 _13SP162016-01-28 19:54:34 UTCSophmore2Male1Transfer0Commute0Full Time245Marketing52.98520PC4443InstagramNo5BUGN280_04 SP162016-01-28 15:22:33 UTCSophmore2Male1Transfer0Commute0Full Time255Management63.79020PC57310InstagramNo2BUGN280 _04SP162016-01-28 15:23:42 UTCSophmore2Male1Montclair only1Live in dorm1Full Time405Management63.59019Mac4667InstagramNo4BUGN280 _04SP162016-01-28 15:22:52 UTCSophmore2Male1Transfer0Live in dorm1Full Time55Marketing63.38519PC5648Newspapers/news magazines - on the webNo6BUGN280_15SP162016-01-27 22:43:29 UTCSophmore2Female0Montclair only1Live in dorm1Full Time05Marketing63.69519Mac4658SnapChatNo2BUGN280_15 SP162016-01-27 22:41:35 UTCSophmore2Female0Montclair only1Live in dorm1Full Time05Finance72.99019PC44610SnapChatNo5BUGN280_15SP 162016-01-27 22:42:56 UTCSophmore2Male1Montclair only1Live in dorm1Full Time45Management63.58519PC56622SnapChatNo4BUGN280_ 04SP162016-01-28 15:24:54
  • 43. UTCSophmore2Female0Transfer0Live in dorm1Full Time245Management78519PC45410SnapChatNo1BUGN280_04 SP162016-01-28 15:22:11 UTCSophmore2Female0Montclair only1Commute0Full Time255Management53.79019Mac15310TwitterNo3BUGN280_ 15SP162016-01-27 22:43:17 UTCSophmore2Female0Montclair only1Live in dorm1Full Time125Marketing63.79020Mac36513TwitterNo4BUGN280_13 SP162016-01-28 19:45:37 UTCSophmore2Female0Montclair only1Live in dorm1Full Time125Management53.39019Mac46310TwitterNo4BUGN280_ 16SP162016-01-26 23:17:02 UTCSophmore2Male1Transfer0Commute0Part Time11553.19019PC4764No7BUGN280_16SP162016-01-26 23:15:21 UTCSophmore2Male1Montclair only1Commute0Full Time20573.19019Mac4753No5BUGN280_16SP162016-01-26 23:14:30 UTCSophmore2Male1Transfer0Commute0Full Time32553.679019Mac4444No7BUGN280_22SP16Sophmore2F emale0Montclair only1Full Time15553.219Mac454No4BUGN280_22SP16Sophmore2Femal e0Montclair only1Full Time20553.819Mac555No5BUGN280_22SP16Sophmore2Femal e0Montclair only1Full Time24553.119PC151No6BUGN280_22SP16Sophmore2Female 0Montclair only1Full Time25533.31419PC152No4BUGN280_13SP162016-01-28 19:48:37 UTCFreshman1Male1Montclair only1Commute0Full Time245Accounting63.769018Mac55525FacebookNo3BUGN28 0_13SP162016-01-28 19:50:35 UTCFreshman1Female0Montclair only1Commute0Full Time05Accounting73.9449519Mac46514SnapChatNo4BUGN28 0_04SP162016-01-28 15:22:32 UTCFreshman1Female0Montclair only1Commute0Full Time205Accounting53.49018Mac44510SnapChatNo1BUGN280 _04SP162016-01-28 15:24:01 UTCFreshman1Male1Montclair only1Commute0Full
  • 44. Time245Management52.38018Mac35518TwitterNo5BUGN280_ 16SP162016-01-26 23:15:32 UTCFreshman1Female0Montclair only1Live in dorm1Full Time0552.68518Mac4528No4BUGN280_16SP162016-01-26 23:15:44 UTCFreshman1Male1Montclair only1Live in dorm1Full Time0563.559519PC6535No4BUGN280_16SP162016-01-26 23:15:23 UTCFreshman1Male1Montclair only1Live in dorm1Full Time0533.0069019Mac5541No4BUGN280_15SP162016-01-27 22:41:47 UTCSenior4Female0Transfer0Commute0Full Time504Accounting63.459521PC66516SnapChatNo3BUGN280 _04SP162016-01-28 15:22:27 UTCSenior4Female0Montclair only1Commute0Full Time204Marketing63.49021PC5555TwitterYes5BUGN280_13S P162016-01-28 20:00:01 UTCJunior3Female0Montclair only1Commute0Full Time204Other42.28521PC37612FacebookYes7BUGN280_22SU 162016-06-13 22:24:25 UTCJunior3Male1Transfer0Commute0Full Time204Management53.39025PC55510Facebook6BUGN280_04 SP162016-01-28 15:23:21 UTCJunior3Male1Transfer0Commute0Full Time04Finance69022PC6765InstagramYes6BUGN280_15SP162 016-01-27 22:41:56 UTCJunior3Male1Transfer0Commute0Full Time254Marketing63.58521PC2552InstagramNo2BUGN280_04 SP162016-01-28 15:24:57 UTCJunior3Male1Transfer0Commute0Full Time04Finance53.088521Mac4716SnapChatYes4BUGN280_15 SP162016-01-27 22:41:51 UTCJunior3Female0Transfer0Commute0Full Time304Accounting79023PC4325SnapChatYes2BUGN280_13S P162016-01-28 19:48:28 UTCJunior3Male1Transfer0Commute0Full Time104Management52.28522PC5624TwitterYes6BUGN280_1 5SP162016-01-27 22:45:13
  • 45. UTCJunior3Female0Transfer0Commute0Full Time304Management43.348523Mac45115TwitterNo4BUGN280 _16SP162016-01-26 23:19:11 UTCJunior3Male1Montclair only1Commute0Full Time0432.99021PC5347Yes5BUGN280_16SP162016-01-26 23:16:05 UTCJunior3Male1Montclair only1Commute0Full Time154538520Mac5434No4BUGN280_16SP162016-01-26 23:15:43 UTCJunior3Female0Transfer0Commute0Full Time30463.29025PC46610Yes5BUGN280_16SP162016-01-26 23:14:38 UTCJunior3Male1Transfer0Commute0Full Time35453.77526Mac5466Yes6BUGN280_16SP162016-01-26 23:15:02 UTCJunior3Male1Transfer0Commute0Full Time40453.78533PC4468Yes4BUGN280_13SP162016-01-28 19:46:11 UTCSophmore2Female0Montclair only1Commute0Full Time304Accounting238020PC5734InstagramYes1BUGN280_15 SP162016-01-27 22:41:22 UTCSophmore2Male1Transfer0Commute0Full Time354Accounting52.98522PC2518InstagramYes4BUGN280_ 13SP162016-01-28 19:46:23 UTCSophmore2Male1Montclair only1Commute0Full Time04Other42.898020Neither4333TwitterNo3BUGN280_16SP 162016-01-26 23:16:28 UTCSophmore2Male1Montclair only1Live in dorm1Full Time0442.58020Mac3456Yes1BUGN280_13SP162016-01-28 19:46:43 UTCFreshman1Male1Montclair only1Commute0Full Time164Accounting72.4958518Mac5555TwitterNo3BUGN280_ 22SU162016-06-13 22:23:54 UTCSenior4Female0Transfer0Commute0Full Time03Marketing52.98522PC45713Instagram7BUGN280_22SU 162016-06-13 22:30:32 UTCSophmore2Female0Transfer0Commute0Part Time403Information Management73.859037Mac6544Facebook5BUGN280_13SP1620 16-01-28 19:50:46 UTCFreshman1Male1Transfer0Commute0Full Time403Accounting73.58528PC4446Newspapers/news
  • 46. magazines - on the webNo7BUGN280_22SU162016-06-13 22:24:11 UTCSenior4Male1Transfer0Commute0Full Time62Finance53.19021Mac3521SnapChat1BUGN280_22SU16 2016-06-13 22:25:37 UTCJunior3Female0Transfer0Commute0Full Time02Finance52.58521PC65410Facebook6BUGN280_22SU16 2016-06-13 22:25:49 UTCJunior3Male1Transfer0Commute0Full Time352Finance72.888520PC35715Facebook5BUGN280_15SP1 62016-01-27 22:42:05 UTCJunior3Male1Transfer0Commute0Part Time252Finance72.97022PC45315InstagramYes4BUGN280_22 SU162016-06-13 22:25:06 UTCJunior3Female0Montclair only1Commute0Full Time302Marketing73.29019Mac4573Instagram5BUGN280_22S U162016-06-13 22:28:29 UTCJunior3Female0Montclair only1Live in dorm1Full Time202Finance52.88521Mac66415Twitter1BUGN280_16SP16 2016-01-26 23:17:20 UTCJunior3Female0Transfer0Commute0Part Time50173.58046PC3643Yes1BUGN280_22SU162016-06-13 22:26:10 UTCSophmore2Female0Transfer0Commute0Full Time401Management73.39531PC55514Facebook6BUGN280_04 SP162016-01-28 15:21:55 UTCSophmore2Female0Transfer0Live in dorm1Full Time01Management42.948519Mac3465SnapChatNo1BUGN280 _08FA191107572019-10-26 04:37:40 UTCJunior3Female0Transfer0Commute0Full Time146Marketing449522Mac3546FacebookNoNo3BUGN280_ 08FA191107572019-10-28 01:06:51 UTCJunior3Male1Montclair only1Commute0Full Time06Management63.68520Mac2666InstagramNoNo4BUGN28 0_10FA191107642019-10-28 12:08:36 UTCJunior3Female0Montclair only1Commute0Full Time146Management638520PC6557Newspapers/news magazines - on the webYesYes7BUGN280_12FA191107952019-10-28 15:15:29
  • 47. UTCJunior3Female0Transfer0Commute0Full Time146Management63.27521PC51120Other magazines - onlineNoNo1BUGN280_10FA191107642019-10-28 18:36:48 UTCJunior3Female0Transfer0Commute0Full Time366Hospitality428021PC4646.5Other magazines - onlineNoYes3BUGN280_08FA191107572019-10-26 15:53:57 UTCJunior3Female0Montclair only1Live in dorm1Full Time346Other73.8659019PC3538PintrestNoYes6BUGN280_12 FA191107952019-10-27 23:52:39 UTCJunior3Female0Transfer0Commute0Full Time266Management62.957025Mac66415SnapChatNoNo4BUG N280_08FA191107572019-10-29 18:08:40 UTCJunior3Female0Montclair only1Commute0Full Time146Management53.5458520Mac54320YouTubeNoYes5BU GN280_08FA191107572019-10-27 21:38:15 UTCJunior3Male1Montclair only1Commute0Full Time206Marketing13.28520PC33710YouTubeNoNo1BUGN280 _03FA191107432019-10-26 12:16:34 UTCSophmore2Male1Montclair only1Live in dorm1Full Time146Accounting53.3568519Mac67510InstagramNoNo4BUG N280_10FA191107642019-10-28 00:58:40 UTCSophmore2Male1Montclair only1Commute0Full Time366Marketing53.49019Mac56414ReadItNoYes6BUGN280_ 12FA191107952019-10-26 01:10:39 UTCSophmore2Male1Transfer0Commute0Full Time06Finance53.48523Neither2257YouTubeYesYes5BUGN28 0_03FA191107432019-10-27 18:31:01 UTCSenior4Male1Transfer0Commute0Full Time305Marketing53.49523Mac55715FacebookYesYes4BUGN 280_12FA191107952019-10-28 03:10:25 UTCSenior4Male1Transfer0Commute0Full Time185Management53.59521Mac7775InstagramNoYes3BUGN 280_08FA191107572019-10-27 20:28:24 UTCSenior4Male1Transfer0Commute0Full Time205Other73.38522Mac5665SnapChatNoNo1BUGN280_03F A191107432019-10-28 02:13:20
  • 48. UTCSenior4Female0Transfer0Commute0Full Time505Other73.759036Mac5447TwitterYesYes7BUGN280_12 FA191107952019-10-28 02:12:49 UTCSenior4Male1Transfer0Commute0Full Time285Marketing538022Mac3367.00TwitterNoYes7BUGN280 _08FA191107572019-10-27 23:28:54 UTCJunior3Male1Montclair only1Commute0Full Time305Finance43.538020Mac3651FacebookNoNo2BUGN280_ 03FA191107432019-10-27 19:30:16 UTCJunior3Female0Transfer0Live in dorm1Full Time05Hospitality73.549521Mac47611FacebookYesYes6BUGN 280_03FA191107432019-10-26 19:58:03 UTCJunior3Male1Transfer0Commute0Full Time05Marketing53.48520PC6555FacebookNoYes7BUGN280_ 12FA191107952019-10-27 22:52:04 UTCJunior3Male1Montclair only1Live in dorm1Full Time05Other53.4218020PC4418.00FacebookNoNo5BUGN280_ 10FA191107642019-10-28 00:48:32 UTCJunior3Male1Montclair only1Commute0Full Time05Other639020Mac11720InstagramNoNo1BUGN280_12F A191107952019-10-28 01:07:42 UTCJunior3Male1Transfer0Commute0Full Time405Finance53.48523Mac4558.00InstagramNoNo1BUGN28 0_03FA191107432019-10-28 03:33:37 UTCJunior3Female0Montclair only1Live in dorm1Full Time105Management63.3089021Mac15230InstagramNoNo2BU GN280_08FA191107572019-10-26 14:45:17 UTCJunior3Male1Montclair only1Commute0Full Time225Marketing52.89020Mac55610InstagramNoYes7BUGN2 80_08FA191107572019-10-27 21:06:24 UTCJunior3Female0Transfer0Commute0Full Time305Management53.588020Mac3436InstagramNoNo2BUGN 280_10FA191107642019-10-27 21:37:09 UTCJunior3Male1Transfer0Live in dorm1Full Time45Marketing73.69020Mac6657InstagramNoYes7BUGN280 _08FA191107572019-10-27 14:32:08
  • 49. UTCJunior3Female0Transfer0Live in dorm1Full Time165Management73.0178522PC3363LinkedInYesYes2BUG N280_03FA191107432019-10-28 03:55:03 UTCJunior3Female0Transfer0Commute0Full Time265Accounting73.759526Mac75513.00Newspapers/news magazines - on the webNoNo7BUGN280_08FA191107572019- 10-28 01:39:43 UTCJunior3Female0Montclair only1Commute0Full Time285Marketing53.38520Mac6655Newspapers/news magazines - on the webNoYes6BUGN280_03FA191107432019- 10-26 14:50:55 UTCJunior3Male1Transfer0Commute0Full Time345Management53.829521PC36710Newspapers/news magazines - on the webYesYes3BUGN280_03FA191107432019-10-27 19:14:46 UTCJunior3Male1Montclair only1Live in dorm1Full Time125Marketing63.78520Mac67614Newspapers/news magazines - on the webNoYes7BUGN280_03FA191107432019- 10-27 07:00:45 UTCJunior3Female0Montclair only1Commute0Full Time165Marketing53.48520Mac4542Newspapers/news magazines - on the webNoNo7BUGN280_10FA191107642019- 10-25 19:48:28 UTCJunior3Male1Transfer0Commute0Full Time205Marketing53.69021Mac54310Newspapers/news magazines - on the webNoNo1BUGN280_10FA191107642019- 10-28 02:21:41 UTCJunior3Female0Transfer0Commute0Full Time505Marketing63.29521PC5657Other magazines - onlineYesYes6BUGN280_03FA191107432019-10-27 16:13:08 UTCJunior3Female0Montclair only1Commute0Full Time125Marketing43.19021Mac5547Other magazines - onlineYesYes5BUGN280_12FA191107952019-10-27 11:38:38 UTCJunior3Other1Transfer0Commute0Full Time505Finance53.49020Neither6655SnapChatNoNo6BUGN28 0_10FA191107642019-10-27 22:09:54 UTCJunior3Male1Transfer0Commute0Full Time125Finance73.29021Mac5565TwitterYesYes5BUGN280_0 8FA191107572019-10-27 19:51:39 UTCJunior3Male1Montclair
  • 50. only1Commute0Full Time205Management33.568520Mac4520TwitterNoNo1BUGN28 0_12FA191107952019-10-27 17:52:09 UTCJunior3Female0Transfer0Commute0Full Time145Marketing63.59021Mac26710YouTubeYesYes5BUGN2 80_12FA191107952019-10-26 14:29:28 UTCJunior3Female0Transfer0Live in dorm1Full Time05Marketing53.47021PC57410YouTubeNoYes6BUGN280_ 10FA191107642019-10-26 16:22:45 UTCSophmore2Male1Montclair only1Commute0Full Time125Other52.5569519Mac6554InstagramNoNo2BUGN280_ 03FA191107432019-10-28 02:50:13 UTCSophmore2Female0Montclair only1Live in dorm1Full Time45Marketing43.58519Mac43410InstagramNoYes3BUGN28 0_03FA191107432019-10-27 15:22:05 UTCSophmore2Female0Montclair only1Commute0Full Time85Management63.59520PC4534Newspapers/news magazines - on the webYesYes5BUGN280_08FA191107572019-10-27 23:45:04 UTCSophmore2Female0Montclair only1Live in dorm1Full Time105Other53.9449520Mac55530PintrestNoNo3BUGN280_0 8FA191107572019-10-26 19:47:02 UTCSophmore2Female0Montclair only1Commute0Full Time05Accounting53.7398519PC2545SnapChatNoNo1BUGN28 0_08FA191107572019-10-26 05:29:55 UTCSophmore2Male1Montclair only1Live in dorm1Full Time05Management52.89019PC4573SnapChatNoNo1BUGN280 _12FA191107952019-10-28 03:20:29 UTCSophmore2Female0Montclair only1Live in dorm1Full Time205Marketing539019Mac44415TwitterNoYes7BUGN280_0 3FA191107432019-10-28 14:10:48 UTCSophmore2Female0Montclair only1Commute0Full Time05Other53.79020PC5552.5TwitterYesYes5BUGN280_03F A191107432019-10-26 20:56:29 UTCSophmore2Male1Montclair only1Commute0Full Time05Finance12.88520Mac34412YouTubeNoNo5BUGN280_0
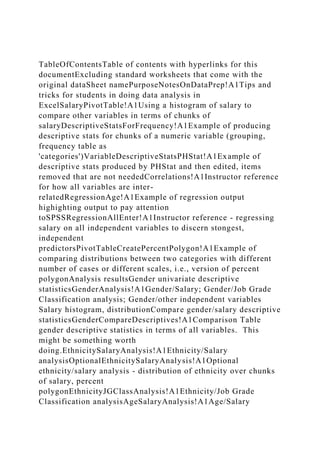
  • 51. 3FA191107432019-10-26 05:25:39 UTCSophmore2Male1Montclair only1Commute0Full Time05Management53.59520PC6775YouTubeNoNo1BUGN280 _08FA191107572019-10-26 17:46:58 UTCFreshman1Male1Montclair only1Commute0Full Time05Accounting73.8139020PC77612InstagramNoNo6BUGN2 80_12FA191107952019-10-28 12:53:22 UTCSenior4Male1Transfer0Commute0Full Time404Management539032PC4646InstagramYesYes7BUGN28 0_03FA191107432019-10-27 16:42:20 UTCSenior4Male1Transfer0Commute0Full Time204Marketing62.68023Mac46710Newspapers/news magazines - on the webYesYes4BUGN280_03FA191107432019-10-28 03:02:05 UTCJunior3Male1Montclair only1Live in dorm1Full Time124Marketing73.38521Mac55510FacebookYesYes5BUGN 280_08FA191107572019-10-28 00:00:46 UTCJunior3Female0Montclair only1Commute0Full Time124Other73.69020Mac3334InstagramNoYes5BUGN280_12 FA191107952019-10-28 03:55:14 UTCJunior3Male1Montclair only1Commute0Full Time144Finance73.189020Mac5642InstagramNoNo6BUGN280_ 10FA191107642019-10-26 19:33:11 UTCJunior3Male1Transfer0Commute0Full Time104Marketing43.177021PC2525InstagramYesYes7BUGN2 80_03FA191107432019-10-28 03:04:49 UTCJunior3Male1Montclair only1Live in … Scatter Plot Scatter Plot of MPG based on Weight (in Lbs) of Vehicle MPG4595 4015 4085 3705 3305 4115 4505 5465 3920 3485 3785 3885 4505 4065 5025 3170 5100 3565 4095 4085 5810 4730 4000 3680 2560 2920 3280 3880 3265 3710 5935 5715 4830 4420 4105 4720 3350 3335 4755 3185 3895 5150 4600 3950 4340 3480 4540 3605 6325 4905 3480 3585 4420 2810 3505 3650 2370 4615 4510 2855 4940 2590 3835 2945 4345 3345
  • 52. 3800 4610 3635 3890 3880 3860 3890 5245 3380 4690 3575 4550 3870 3430 2615 3660 4725 4310 2875 3750 5705 3670 3915 4825 3510 4515 4235 3870 4620 3625 6245 4415 2000 4025 4585 2510 3085 2830 3480 3355 4060 3845 5575 4845 4490 4235 3315 4180 3320 2690 3345 4195 3430 3925 3640 3215 5715 3555 4190 4875 4550 3010 2780 4480 3540 3630 2925 3000 3305 3015 3370 3545 3335 5015 3065 3915 2890 3120 3260 3540 3545 4280 2840 3650 2995 4190 4345 3600 3280 3620 2595 4350 4490 2950 3485 4550 2410 3155 3330 3465 3245 3465 3850 3555 4950 17 18 18 23 25 21 17 15 20 24 22 19 18 19 17 26 15 18 19 17 13 16 18 17 27 23 21 18 23 20 14 14 15 18 16 16 20 23 17 22 17 12 16 19 16 15 16 19 13 15 20 20 16 31 21 21 34 19 17 25 14 28 19 27 18 23 18 17 19 19 19 19 19 13 22 14 20 15 18 23 28 21 17 15 28 18 13 23 20 15 24 21 19 21 16 20 13 17 29 18 16 27 18 30 23 23 18 21 15 16 17 17 21 16 23 30 23 17 23 19 20 25 13 21 19 15 18 26 29 17 22 20 23 27 20 22 23 21 20 16 24 17 26 23 22 18 21 16 27 18 22 17 16 22 24 21 29 17 18 44 23 18 34 25 24 24 23 22 20 20 16 X Y PlotDataWeight (lb)MPG459517401518408518370523330525411521450517546 51539202034852437852238851945051840651950251731702651 00153565184095194085175810134730164000183680172560272 92023328021388018326523371020593514571514483015442018 41051647201633502033352347551731852238951751501246001 63950194340163480154540163605196325134905153480203585 20442016281031350521365021237034461519451017285525494 01425902838351929452743451833452338001846101736351938 90193880193860193890195245133380224690143575204550153
  • 53. 87018343023261528366021472517431015287528375018570513 36702339152048251535102445152142351938702146201636252 06245134415172000294025184585162510273085182830303480 23335523406018384521557515484516449017423517331521418 01633202326903033452341951734302339251936402032152557 15133555214190194875154550183010262780294480173540223 63020292523300027330520301522337023354521333520501516 30652439151728902631202332602235401835452142801628402 73650182995224190174345163600223280243620212595294350 17449018295044348523455018241034315525333024346524324 523346522385020355520495016 SLRDataWeight (lb)MPG459517401518408518370523330525411521450517546 51539202034852437852238851945051840651950251731702651 00153565184095194085175810134730164000183680172560272 92023328021388018326523371020593514571514483015442018 41051647201633502033352347551731852238951751501246001 63950194340163480154540163605196325134905153480203585 20442016281031350521365021237034461519451017285525494 01425902838351929452743451833452338001846101736351938 90193880193860193890195245133380224690143575204550153 87018343023261528366021472517431015287528375018570513 36702339152048251535102445152142351938702146201636252 06245134415172000294025184585162510273085182830303480 23335523406018384521557515484516449017423517331521418 01633202326903033452341951734302339251936402032152557 15133555214190194875154550183010262780294480173540223 63020292523300027330520301522337023354521333520501516 30652439151728902631202332602235401835452142801628402 73650182995224190174345163600223280243620212595294350 17449018295044348523455018241034315525333024346524324 523346522385020355520495016 SLRSimple Linear Regression Analysisof MPG by Weight of VehicleCalculationsb1, b0 Coefficients- 0.004939.0902Regression Statisticsb1, b0 Standard Error0.00020.9786Multiple R0.8357R Square, Standard
  • 54. Error0.69842.5757R Square0.6984F, Residual df391.3038169.0000Adjusted R Square0.6966Regression SS, Residual SS2595.98921121.1804Standard Error2.5757Observations171Confidence level95%t Critical Value1.9741ANOVAHalf Width b01.9318dfSSMSFSignificance FHalf Width b10.0005Regression12595.98922595.9892391.30380.0000Resid ual1691121.18046.6342Total1703717.1696CoefficientsStandard Errort StatP-valueLower 95%Upper 95%Lower 95%Upper 95%Intercept39.09020.978639.94570.000037.158441.022137.15 8441.02207Weight (lb)-0.00490.0002-19.78140.0000-0.0054- 0.0044-0.0054-0.00439 DataCopy3Weight (lb)45954015408537053305411545055465392034853785388545 05406550253170510035654095408558104730400036802560292 03280388032653710593557154830442041054720335033354755 31853895515046003950434034804540360563254905348035854 42028103505365023704615451028554940259038352945434533 45380046103635389038803860389052453380469035754550387 03430261536604725431028753750570536703915482535104515 42353870462036256245441520004025458525103085283034803 35540603845557548454490423533154180332026903345419534 30392536403215571535554190487545503010278044803540363 02925300033053015337035453335501530653915289031203260 35403545428028403650299541904345360032803620259543504 490295034854550241031553330346532453465385035554950 CompleteStatistics3WeightWeight (lb)Mean3886.7251461988Median3800Mode3480Minimum2000 Maximum6325Range4325Variance641611.5652Standard Deviation801.0066Coeff. of Variation20.61%Skewness0.5476Kurtosis0.3268Count171Stand ard Error61.2545 DataCopy2Asia or EuropeUS17151818181923172513211617181517202724232221 19181823192017142614311521182116341619201723251728221 91727121816231918161715191619191913191519201820231628
  • 55. 14211317221514282018152313201615202413211719162123292 21820162327271823302123202316182421171523162217201720 21163023172319202513211915182629172022262322182116271 822171622242129171844231834252424 CompleteStats 2 GpsMPG by Origin of VehicleAsia or EuropeUSMean2118Median2118Mode1816Minimum1312Maxim um4427Range3115Variance23.984212.7341Standard Deviation4.89743.5685Coeff. of Variation22.99%19.59%Skewness1.44080.3862Kurtosis3.6098- 0.4992Count10665Standard Error0.47570.4426 DataCopyMPG1718182325211715202422191819172615181917 13161817272321182320141415181616202317221712161916151 61913152020163121213419172514281927182318171919191919 13221420151823282117152818132320152421192116201317291 81627183023231821151617172116233023172319202513211915 18262917222023272022232120162417262322182116271822171 6222421291718442318342524242322202016 CompleteStatsMPGMPGMean20Median19Mode18Minimum12M aximum44Range32Variance21.8657Standard Deviation4.6761Coeff. of Variation23.23%Skewness1.3054Kurtosis3.5781Count171Stand ard Error0.3576 FiveNumbersMPGFive-Number SummaryMinimum12First Quartile17Median19Third Quartile23Maximum44 BoxPlot MPG MPG 12 12 12 0.5 1 1.5 17 17 17 0.5 1 1.5 19 19 19 0.5 1 1.5 23 23 23 0.5 1 1.5 44 44 44 0.5 1 1.5 12 44 1 1 17 23 0.5 0.5 17 23 1.5 1.5 ForBoxPlot120.5121121.5170.5171171.5190.5191191.5230.523 1231.5440.5441441.5121441170.5230.5171.5231.5 FiveNumbers 2 GpsMPG based on Origin of VehicleFive-
  • 56. Number SummaryAsia or EuropeUSMinimum1312First Quartile1816Median20.518Third Quartile2420.5Maximum4427 BoxPlot 2 Gps MPG based on Origin of Vehicle Asia or Europe 13 13 13 0.5 1 1.5 18 18 18 0.5 1 1.5 20.5 20.5 20.5 0.5 1 1.5 24 24 24 0.5 1 1.5 44 44 44 0.5 1 1.5 13 44 1 1 18 24 0.5 0.5 18 24 1.5 1.5 US 12 12 12 2 2.5 3 16 16 16 2 2.5 3 18 18 18 2 2.5 3 20.5 20.5 20.5 2 2.5 3 27 27 27 2 2.5 3 12 27 2.5 2.5 16 20.5 2 2 16 20.5 3 3 ForBoxPlot2130.5122131122.5131.5123180.5162181162.5181.5 16320.50.518220.51182.520.51.5183240.520.5224120.52.5241. 520.53440.5272441272.5441.5273131122.5441272.5180.516224 0.520.52181.5163241.520.53 FiveNumbers3WeightFive-Number SummaryMinimum2000First Quartile3335Median3800Third Quartile4480Maximum6325 BoxPlot3 Weight Weight (lb) 2000 2000 2000 0.5 1 1.5 3335 3335 3335 0.5 1 1.5 3800 3800 3800 0.5 1 1.5 4480 4480 4480 0.5 1 1.5 6325 6325 6325 0.5 1 1.5 2000 6325 1 1 3335 4480 0.5 0.5 3335 4480 1.5 1.5 ForBoxPlot320000.52000120001.533350.53335133351.538000. 53800138001.544800.54480144801.563250.56325163251.52000 16325133350.544800.533351.544801.5
  • 57. DataCopy4OriginAsia or EuropeAsia or EuropeAsia or EuropeAsia or EuropeAsia or EuropeAsia or EuropeAsia or EuropeAsia or EuropeAsia or EuropeAsia or EuropeAsia or EuropeAsia or EuropeAsia or EuropeAsia or EuropeAsia or EuropeAsia or EuropeUSUSUSUSUSUSUSUSUSUSUSUSUSUSUSUSUSUSU SUSUSUSUSUSUSUSUSUSUSUSUSUSUSUSUSUSUSAsia or EuropeAsia or EuropeAsia or EuropeAsia or EuropeAsia or EuropeAsia or EuropeAsia or EuropeUSAsia or EuropeAsia or EuropeAsia or EuropeAsia or EuropeAsia or EuropeAsia or EuropeAsia or EuropeAsia or EuropeAsia or EuropeAsia or EuropeAsia or EuropeAsia or EuropeUSUSUSUSUSAsia or EuropeAsia or EuropeAsia or EuropeAsia or EuropeAsia or EuropeAsia or EuropeAsia or EuropeAsia or EuropeUSAsia or EuropeAsia or EuropeAsia or EuropeAsia or EuropeAsia or EuropeAsia or EuropeAsia or EuropeUSUSUSUSAsia or EuropeAsia or EuropeAsia or EuropeAsia or EuropeAsia or EuropeAsia or EuropeAsia or EuropeAsia or EuropeAsia or EuropeAsia or EuropeAsia or EuropeAsia or EuropeAsia or EuropeAsia or EuropeAsia or EuropeUSUSAsia or EuropeAsia or EuropeAsia or EuropeAsia or EuropeAsia or EuropeAsia or EuropeAsia or EuropeAsia or EuropeAsia or EuropeAsia or EuropeAsia or EuropeAsia or EuropeAsia or EuropeAsia or EuropeAsia or EuropeUSUSUSUSAsia or EuropeAsia or EuropeUSUSUSUSUSUSAsia or EuropeAsia or EuropeAsia or EuropeAsia or EuropeAsia or EuropeAsia or EuropeAsia or EuropeAsia or EuropeAsia or EuropeAsia or EuropeAsia or EuropeAsia or EuropeAsia or EuropeAsia or EuropeAsia or EuropeAsia or EuropeAsia or EuropeAsia or EuropeAsia or EuropeAsia or EuropeAsia or EuropeAsia or EuropeAsia or EuropeAsia or EuropeUSUSUSUSUS Bar Chart Origin of Vehicle Total Asia or Europe US 106 65 Origin
  • 58. OneWayTableOrigin of VehicleCount of OriginOriginTotalAsia or Europe106US65Grand Total171 SideBySide Auto Type by Origin of Vehicle 4 Door Hatchback Asia or Europe US 6 1 4 Door SUV Asia or Europe US 33 27 Coupe Asia or Europe US 17 6 Minivan Asia or Europe US 4 3 Sedan Asia or Europe US 40 25 Wagon Asia or Europe US 6 3 TwoWayTableOrigin and Auto TypeCount of OriginType AutoOrigin4 Door Hatchback4 Door SUVCoupeMinivanSedanWagonGrand TotalAsia or Europe633174406106US1276325365Grand Total760237659171 Variable INFOAutomobile features taken from a sample of 171 car modelsSourceBerenson, Levine, Krehbiel Basic Business Statistics: Concepts and Applications (12 ed.), PearsonVariablesMake/ModelMPGMiles Per GallonLengthCargoWidthCargo storage width in inchesHeightWheelBaseWheel base distance in inchesWeightMaxLoadMaximum car load in poundsCargoVolVolume of trunk space in cubic inches feetHPHorsepowerAccto60Time in seconds to accelerate to 60 miles per hourBreakfr60Distance in feet to stop vehicle when applying the breaks at 60 miles per hourTrngCircDistance in feet to turn the vehicle 360 degreesOriginUS, Asia or EuropeTypeAutoType of automobileTransmissionType of transmission DATAAutomobile comparison studey dataMake/ModelMPGLength (in)CargoWidth (in)Height (in)WheelBase (in)Weight (lb)MaxLoad (lb)CargoVol(cuft)HPAccto60(sec)Breakfr60(ft)TrngCirc(ft)Ori ginType AutoTransmissionAcura
  • 59. MDX1719179661084595116036300813940Asia or Europe4 Door SUVAuto 5Acura RDX1818174651044015870302407.414541Asia or Europe4 Door SUVAuto 5Acura RL1819473571104085850133006.914843Asia or EuropeSedanAuto 5Acura TL2319574571093705850132706.713842Asia or EuropeSedanAuto 5Audi A32516977561023305990202007.314935Asia or Europe4 Door HatchbackSeq 6Audi A621194715711241151100162557.714440Asia or EuropeSedanAuto 6Audi A817204755712145051210183307.614041Asia or EuropeSedanAuto 6Audi Q715200786811854651325373508.214640Asia or Europe4 Door SUVAuto 6Audi S420181725610439201145133405.314038Asia or EuropeSedanMan 6BMW 3 Series sedan 328i 6- cyl24178725610934851060112157.414237Asia or EuropeWagonAuto 6BMW 5 Series22191735811437851100143005.814939Asia or EuropeSedanAuto 6BMW 6 Series1919073541093885840133605.613340Asia or EuropeCoupeAuto 6BMW 7 Series18204755912345051060183256.915442Asia or EuropeSedanAuto 6BMW X319180736611040651005332607.914039Asia or Europe4 Door SUVAuto 6BMW X517191767011650251350362608.614242Asia or Europe4 Door SUVAuto 6BMW Z42616170509831705502225612633Asia or EuropeCoupeMan 6Buick Enclave15201787011951001335442758.915343US4 Door SUVAuto 6Buick LaCrosse181987357111356591516200916040USSedanAuto 4Buick Lucerne1920374581164095925171979.217544USSedanAuto 4Cadillac
  • 60. DTS17208755811640851095192757.618046USSedanAuto 4Cadillac Escalade13203797511658101330474037.518142US4 Door SUVAuto 6Cadillac SRX16195736811647301285372558.315242US4 Door SUVAuto 5Cadillac STS1819673581164000890142557.114640USSedanAuto 5Cadillac XLR171787250106368040043206.414541USCoupeAuto 5Chevrolet Aveo hatchback 1LT 4- cyl271546659982560860710311.214635USSedanMan 5Chevrolet Cobalt sedan LT 4- cyl2318068571032920890141458.815237USSedanAuto 4Chevrolet Corvette convertible Base V8 MT211757349106328039011400514542USCoupeMan 6Chevrolet Equinox18189716911338801115371859.115343US4 Door SUVAuto 5Chevrolet HHR2317669651043265820301729.215941US4 Door SUVAuto 4Chevrolet Impala2020073591113710945192427.815541USSedanAuto 4Chevrolet Suburban14222797713059351460613209.116545US4 Door SUVAuto 4Chevrolet Tahoe LT V81420279771165715158051320916842US4 Door SUVAuto 4Chevrolet TrailBlazer15192757511348301020392919.115939US4 Door SUVAuto 4Chevrolet Uplander18205727212144201410512408.815343USMinivanAut o 4Chrysler 300 C V81619774581204105865163406.413941USSedanAuto 5Chrysler Pacifica16199796711647201000362538.614642US4 Door SUVAuto 6Chrysler PT Cruiser2016967611033350865321808.116541USSedanAuto 4Chrysler Sebring sedan Touring 4- cyl23191735910933358251317310.215640USSedanAuto 4Chrysler Town & Country17203776912147551150622518.817242USMinivanAuto
  • 61. 6Dodge Caliber SXT 4-cyl CVT22174696010431858652017210.315739US4 Door HatchbackCVTDodge Charger SXT V6172007558120389586516340613441USSedanAuto 5Dodge Durango12201767411951501455453357.616743US4 Door SUVAuto 5Dodge Grand Caravan162037769121460011506219710.318242USMinivanAut o 6Dodge Magnum1919874581203950865302508.816641USWagonAuto 4Dodge Nitro16179736910943401150402109.116739US4 Door SUVAuto 4Dodge Viper15176754899348046565104.213043USCoupeMan 6Ford Edge1618676671114540910362658.315939US4 Door SUVAuto 6Ford Escape191757070103360510003820010.521540US4 Door SUVAuto 4Ford Expedition13221797713163251570733009.116645US4 Door SUVAuto 6Ford Explorer XLT V615193747311449051275482109.716338US4 Door SUVAuto 5Ford Fusion SEL V6201907256107348085016221814342USSedanAuto 6Ford Mustang coupe GT Premium V8 MT2018874551073585720133005.514439USCoupeMan 5Ford Taurus X16200756711344201150382638.515242USSedanAuto 6Honda Civic sedan EX 4- cyl3117769571062810850131408.613639Asia or EuropeSedanMan 5Honda CR- V21178726610335058502616610.613939Asia or Europe4 Door SUVAuto 5Honda Element21170727010136506754716610.416236Asia or Europe4 Door SUVAuto 5Honda Fit Sport 4-cyl MT341626760982370850241099.914436Asia or Europe4 Door HatchbackMan 5Honda Odyssey19201776911846151320672558.614440Asia or EuropeMinivanAuto 5Honda Pilot17191797310945101320482558.215740Asia or Europe4 Door SUVAuto 5Honda
  • 62. S200025162695195285540052405.813436Asia or EuropeCoupeMan 6Hummer H314187757411249409403822011.517037US4 Door SUVAuto 4Hyundai Accent GLS 4- cyl2816967589825908501211012.515336Asia or EuropeSedanAuto 4Hyundai Azera1919373591093835860172637.114441Asia or EuropeSedanAuto 5Hyundai Elantra GLS 4- cyl27177705810429458501413810.415237Asia or EuropeSedanAuto 4Hyundai Santa Fe18184746810643451120382428.513939Asia or Europe4 Door SUVAuto 5Hyundai Sonata GLS 4- cyl23189725810733458601616210.513339Asia or EuropeSedanAuto 4Hyundai Tucson18170716610438008603117310.114339Asia or Europe4 Door SUVAuto 4Hyundai Veracruz17191776911046101160422608.615441Asia or Europe4 Door SUVAuto 6Infiniti G sedan Journey V61918770571123635900143062.213238Asia or EuropeSedanAuto 5Infiniti M M35 V61919371591143890860132756.914139Asia or EuropeSedanAuto 5Jaguar S- Type1919272561153880905142946.314240Asia or EuropeSedanAuto 6Jaguar XJ1920073571193860880172947.114341Asia or EuropeSedanAuto 6Jaguar XK191898252108389070510300713838Asia or EuropeCoupeAuto 6Jeep Commander13189757211052451100393307.316041US4 Door SUVAuto 5Jeep Compass22173696510433809252717210.116338US4 Door SUVCVTJeep Grand Cherokee14186736710946901050332358.815940US4 Door SUVAuto 5Jeep Patriot20174696410435759253017210.816838US4 Door SUVCVTJeep
  • 63. Wrangler15173747111645508503520510.717243US4 Door SUVAuto 4Kia Amanti1819773591103870860162009.116041Asia or EuropeSedanAuto 5Kia Optima EX V62318671581073430825151629.214239Asia or EuropeSedanAuto 5Kia Rio sedan LX 4- cyl281676758982615850911012.815035Asia or EuropeSedanAuto 4Kia Rondo2117972651063660825331829.616339Asia or EuropeWagonAuto 5Kia Sedona1720278691194725115565244915243Asia or EuropeMinivanAuto 5Kia Sorento1518173681074310880321929.515539Asia or Europe4 Door SUVAuto 4Kia Spectra EX 4- cyl2817668581032875850121389.515337Asia or EuropeSedanMan 5Kia Sportage18170716610437508603117311.317238Asia or Europe4 Door SUVAuto 4Land Rover LR313191757411457051475523009.114539US4 Door SUVAuto 6Lexus ES2319172571093670900152726.414039Asia or EuropeSedanAuto 6Lexus GS 300 V62019072571123915815132457.414738Asia or EuropeSedanAuto 6Lexus GX1518874731104825122540235813641Asia or Europe4 Door SUVAuto 5Lexus IS2418071561083510825132047.713435Asia or EuropeSedanAuto 6Lexus LS2120374581224515825183806.215340Asia or EuropeSedanAuto 8Lexus RX 350 V61918673661074235925332707.314140Asia or Europe4 Door SUVAuto 5Lexus SC211797253103387064582886.514438Asia or EuropeCoupeAuto 6Lincoln MKX1618776671114620910372658.216241US4 Door SUVAuto 6Lincoln MKZ2019172571073625875162636.913542USSedanAuto 6Lincoln Navigator13208797811962451525573008.816742US4 Door SUVAuto 6Lincoln Town
  • 64. Car17215785911844151100212398.715442USSedanAuto 4Lotus Elise29149684491200055041904.613237Asia or EuropeCoupeMan 6Mazda CX- 71818474651084025850282449.114041Asia or Europe4 Door SUVAuto 6Mazda CX- 916200766811345851190382633.216140Asia or Europe4 Door SUVAuto 6Mazda MX-5 Miata27157684992251034051706.713833Asia or EuropeCoupeMan 6Mazda RX- 8181747053106308568082386.713038Asia or EuropeCoupeMan 6Mazda Mazda3 sedan i 4-cyl MT3017869581042830850111488.614036Asia or EuropeSedanMan 5Mazda Mazda5231826964108348010203915710.315437Asia or EuropeWagonAuto 4Mazda Mazda62318770571053355850151609.614541Asia or EuropeSedanAuto 4Mercedes-Benz CLS1819474551124060915163026.113338Asia or EuropeSedanAuto 7Mercedes-Benz E-Class sedan E350 V621190725811238451010162686.515238Asia or EuropeSedanAuto 7Mercedes-Benz GL- Class15200767212155751210463357.415442Asia or Europe4 Door SUVAuto 7Mercedes-Benz M- Class16189757011548451165412687.814338Asia or Europe4 Door SUVAuto 7Mercedes-Benz S- Class1720573581254490113516382615440Asia or EuropeSedanAuto 7Mercedes-Benz SL1717972511014235570103825.313236Asia or EuropeCoupeAuto 7Mercedes-Benz SLK211617051963315525102686.213034Asia or EuropeCoupeMan 6Mercury Grand Marquis1621278571154180110021239815142USSedanAuto 4Mercury Milan Base 4- cyl2319172561073320850161609.514440USSedanAuto 5Mini Cooper 30146665597269081561727.215437Asia or EuropeCoupeMan 6Mitsubishi Eclipse hatchback GS 4-cyl
  • 65. MT2318072541013345660161629.314942Asia or EuropeCoupeMan 5Mitsubishi Endeavor1719074701084195970402158.214741Asia or Europe4 Door SUVAuto 4Mitsubishi Galant ES 4- cyl2319072581083430825131609.114843Asia or EuropeSedanAuto 4Mitsubishi Outlander XLS V619183716610539251155342208.314238Asia or Europe4 Door SUVAuto 6Nissan 350Z201697252104364045042876.213037Asia or EuropeCoupeMan 6Nissan Altima sedan 2.5 S 4-cyl CVT2519071581093215900161758.114239Asia or EuropeSedanCVTNissan Armada13208797612357151375593177.214044Asia or Europe4 Door SUVAuto 5Nissan Maxima2119173581093555900142556.815044Asia or EuropeSedanCVTNissan Murano191897467111419090031245814640Asia or Europe4 Door SUVCVTNissan Pathfinder1518873701124875112548270817243Asia or Europe4 Door SUVAuto 5Nissan Quest18204787012445501205602358.415345Asia or EuropeMinivanAuto 5Nissan Sentra 2.0 S 4-cyl CVT2618071601063010850131409.616438Asia or EuropeSedanCVTNissan Versa hatchback 1.8 S 4-cyl MT2916967601022780860181229.518737Asia or EuropeSedanMan 6Nissan Xterra1717973751064480920462617.715840Asia or Europe4 Door SUVAuto 5Pontiac G6 sedan GT V62218971571123540890141699.415642USSedanAuto 4Pontiac Grand Prix2019872561113630915162008.316941USSedanAuto 4Pontiac Solstice23157715095292535541777.214836USCoupeMan 5Pontiac Vibe27173706110230008502412610.715038USWagonAuto 4Porsche 91120176715293330566053554.412737Asia or EuropeCoupeMan 6Porsche
  • 66. Boxster22172705195301542092406.512337Asia or EuropeCoupeMan 5Saab 9-3 sedan 2.0T 4- cyl231826857105337093015210813637USSedanAuto 5Saab 9- 52119071571063545930162607.213940USSedanAuto 5Saturn Aura XE 4- cyl2019070581123335915162248.116042USSedanAuto 4Saturn Outlook16201787011950151320492758.816242US4 Door SUVAuto 6Saturn Sky24161715095306542542606.215637USCoupeMan 5Saturn Vue1718073671073915915282578.216242US4 Door SUVAuto 6Scion tC2617469561062890865131608.814737Asia or EuropeCoupeMan 5Scion xB2316769641023120850341589.414837Asia or EuropeWagonAuto 4Subaru Forester 2.5X 4- cyl221776865993260900321731014238Asia or Europe4 Door SUVAuto 4Subaru Legacy1818668561053540850112503.115138Asia or EuropeSedanAuto 5Subaru Outback wagon 2.5i 4- cyl21189706310535459003116811.815838Asia or EuropeWagonAuto 4Subaru Tribeca16192746610842801155362568.616240Asia or Europe4 Door SUVAuto 5Suzuki Forenza2717768571022840875121269.515736Asia or Europe4 Door HatchbackMan 5Suzuki Grand Vitara1817771671043650905251859.514738Asia or Europe4 Door SUVAuto 5Suzuki SX4 Sport 4- cyl2216369639829958151614312.215037Asia or Europe4 Door HatchbackAuto 4Suzuki XL- 717197726911241901190372527.714744Asia or Europe4 Door SUVAuto 5Toyota 4Runner16189747211043451035452398.214640Asia or Europe4 Door SUVAuto 4Toyota Avalon2219773591113600875142806.715541Asia or EuropeSedanAuto 5Toyota Camry LE 4- cyl2418972581093280900151589.615138Asia or EuropeSedanAuto 5Toyota Camry