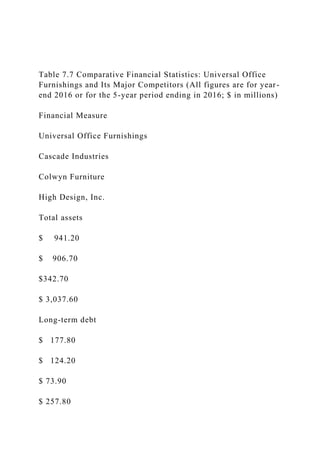
1. Table 7.7 Comparative Financial Statistics: Universal Office
Furnishings and Its Major Competitors (All figures are for year-
end 2016 or for the 5-year period ending in 2016; $ in millions)
Financial Measure
Universal Office Furnishings
Cascade Industries
Colwyn Furniture
High Design, Inc.
Total assets
$ 941.20
$ 906.70
$342.70
$ 3,037.60
Long-term debt
$ 177.80
$ 124.20
$ 73.90
$ 257.80
2. Stockholders’ equity
$ 294.50
$ 501.30
$183.90
$1,562.20
Stockholders’ equity as a % of total assets
31.30%
55.30%
53.70%
51.40%
Total revenues
$1,938.00
$1,789.30
$642.20
$3,316.10
Net earnings
$ 139.70
$ 87.40
3. $ 38.50
$ 184.20
Net profit margin
7.20%
4.90%
6.00%
5.50%
5-year growth rates in:
Total assets
14.4%
19.4%
17.3%
17.7%
Total revenues
15.0%
17.8%
15.9%
15.8%