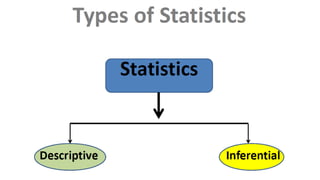
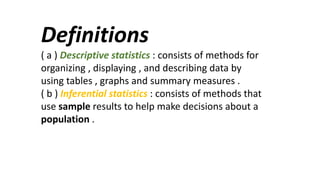
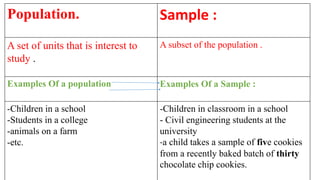
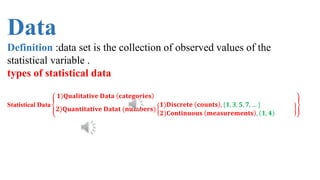
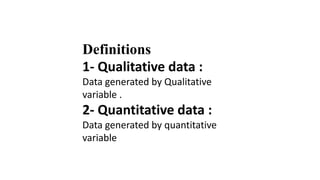
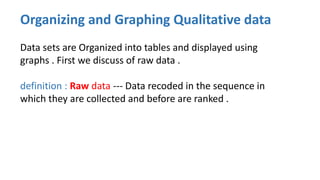
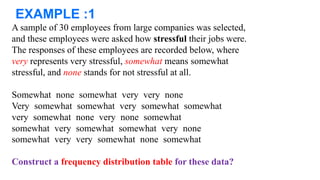
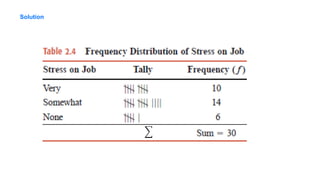
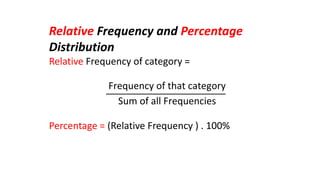
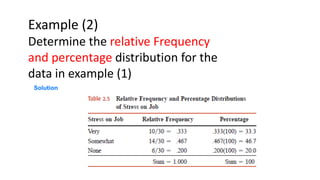
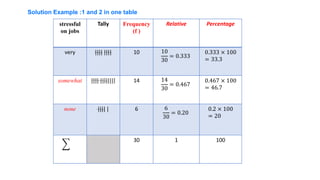
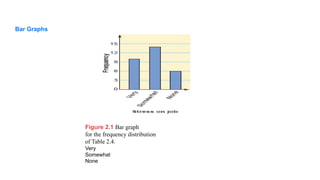
The CMO Survey - Highlights and Insights Report - Spring 2024
1-Organizing and Graphing Qualitative data.pptx
1. Statistics - STAT100
1- Statistics and types of Statistics :
What is statistics ?
Definition : statistics is the science of collecting ,
analyzing , presenting , interpreting data, as well as of
making decisions based on such analyses.
2.
3. Definitions
( a ) Descriptive statistics : consists of methods for
organizing , displaying , and describing data by
using tables , graphs and summary measures .
( b ) Inferential statistics : consists of methods that
use sample results to help make decisions about a
population .
4. Population. Sample :
A set of units that is interest to
study .
A subset of the population .
Examples Of a population Examples Of a Sample :
-Children in a school
-Students in a college
-animals on a farm
-etc.
-Children in classroom in a school
- Civil engineering students at the
university
-a child takes a sample of five cookies
from a recently baked batch of thirty
chocolate chip cookies.
5. Data
Definition :data set is the collection of observed values of the
statistical variable .
types of statistical data
Statistical Data
𝟏)𝐐𝐮𝐚𝐥𝐢𝐭𝐚𝐭𝐢𝐯𝐞 𝐃𝐚𝐭𝐚 𝐜𝐚𝐭𝐞𝐠𝐨𝐫𝐢𝐞𝐬
𝟐)𝐐𝐮𝐚𝐧𝐭𝐢𝐭𝐚𝐭𝐢𝐯𝐞 𝐃𝐚𝐭𝐚𝐭 (𝐧𝐮𝐦𝐛𝐞𝐫𝐬)
𝟏)𝐃𝐢𝐬𝐜𝐫𝐞𝐭𝐞 𝐜𝐨𝐮𝐧𝐭𝐬 , {𝟏, 𝟑, 𝟓, 𝟕, … }
𝟐)𝐂𝐨𝐧𝐭𝐢𝐧𝐮𝐨𝐮𝐬 𝐦𝐞𝐚𝐬𝐮𝐫𝐞𝐦𝐞𝐧𝐭𝐬 , 𝟏, 𝟒
6. Definitions
1- Qualitative data :
Data generated by Qualitative
variable .
2- Quantitative data :
Data generated by quantitative
variable
7. Organizing and Graphing Qualitative data
Data sets are Organized into tables and displayed using
graphs . First we discuss of raw data .
definition : Raw data --- Data recoded in the sequence in
which they are collected and before are ranked .
8. EXAMPLE :1
A sample of 30 employees from large companies was selected,
and these employees were asked how stressful their jobs were.
The responses of these employees are recorded below, where
very represents very stressful, somewhat means somewhat
stressful, and none stands for not stressful at all.
Somewhat none somewhat very very none
Very somewhat somewhat very somewhat somewhat
very somewhat none very none somewhat
somewhat very somewhat somewhat very none
somewhat very very somewhat none somewhat
Construct a frequency distribution table for these data?
10. Relative Frequency and Percentage
Distribution
Relative Frequency of category =
Frequency of that category
Sum of all Frequencies
Percentage = (Relative Frequency ) . 100%
11. Example (2)
Determine the relative Frequency
and percentage distribution for the
data in example (1)
Solution
12. stressful
on jobs
Tally Frequency
(f )
Relative Percentage
very |||| |||| 10 10
30
= 0.333
0.333 × 100
= 33.3
somewhat |||| || |||| 14 14
30
= 0.467
0.467 × 100
= 46.7
none |||| | 6 6
30
= 0.20
0.2 × 100
= 20
30 1 100
Solution Example :1 and 2 in one table
13. Figure 2.1 Bar graph
for the frequency distribution
of Table 2.4.
Very
Somewhat
None
Bar Graphs
14. H.W 1
2.3 The following data give the results of a sample survey. The letters A, B, and C represent the
three categories.
A B B A C B C C C A
C B C A C C B C C A
A B C C B C B A C A
a. Prepare a frequency distribution table.
b. Calculate the relative frequencies and percentages for all categories.
c. What percentage of the elements in this sample belong to category B?
d. What percentage of the elements in this sample belong to category A or C?
e. Draw a bar graph for the frequency distribution