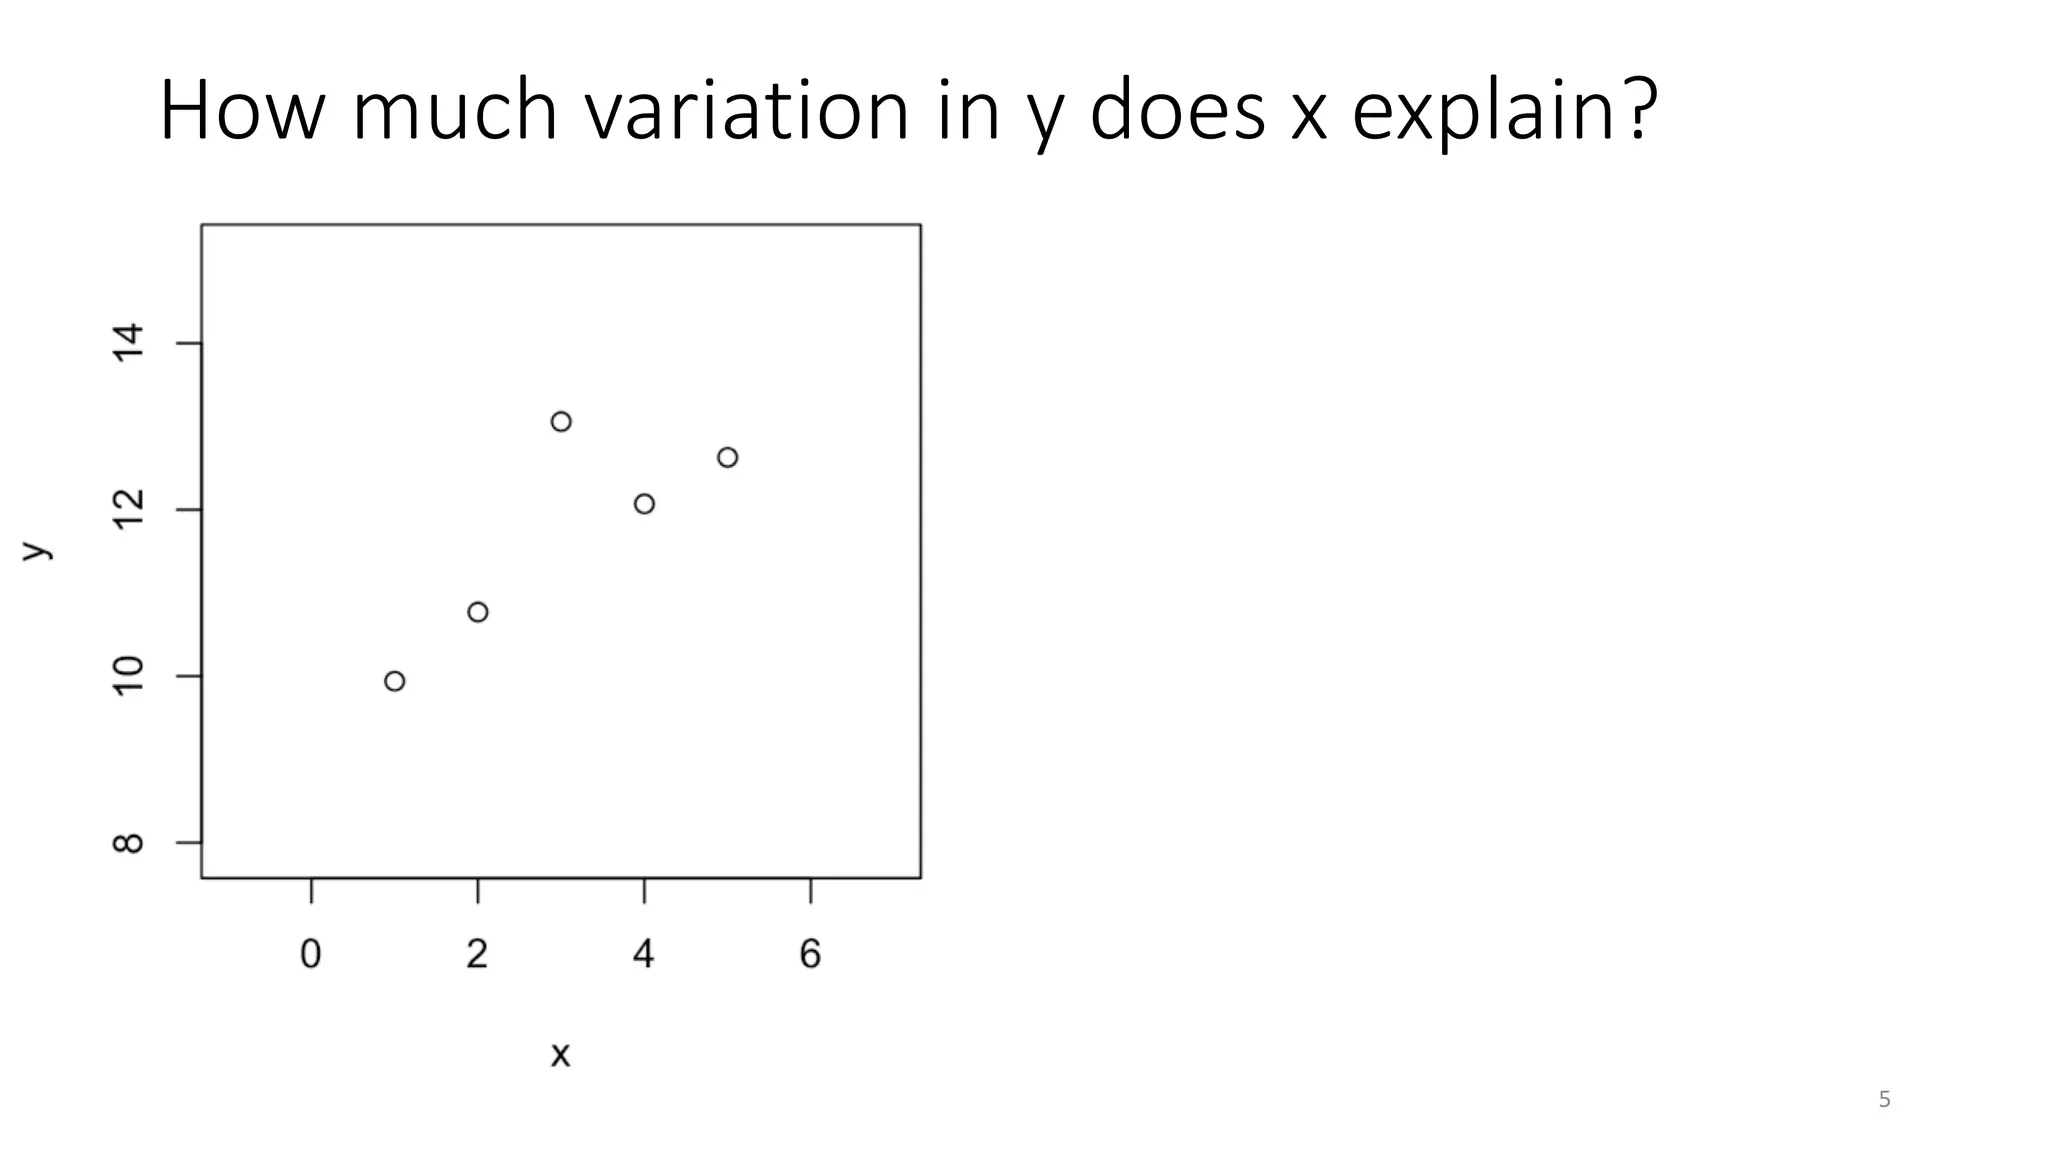
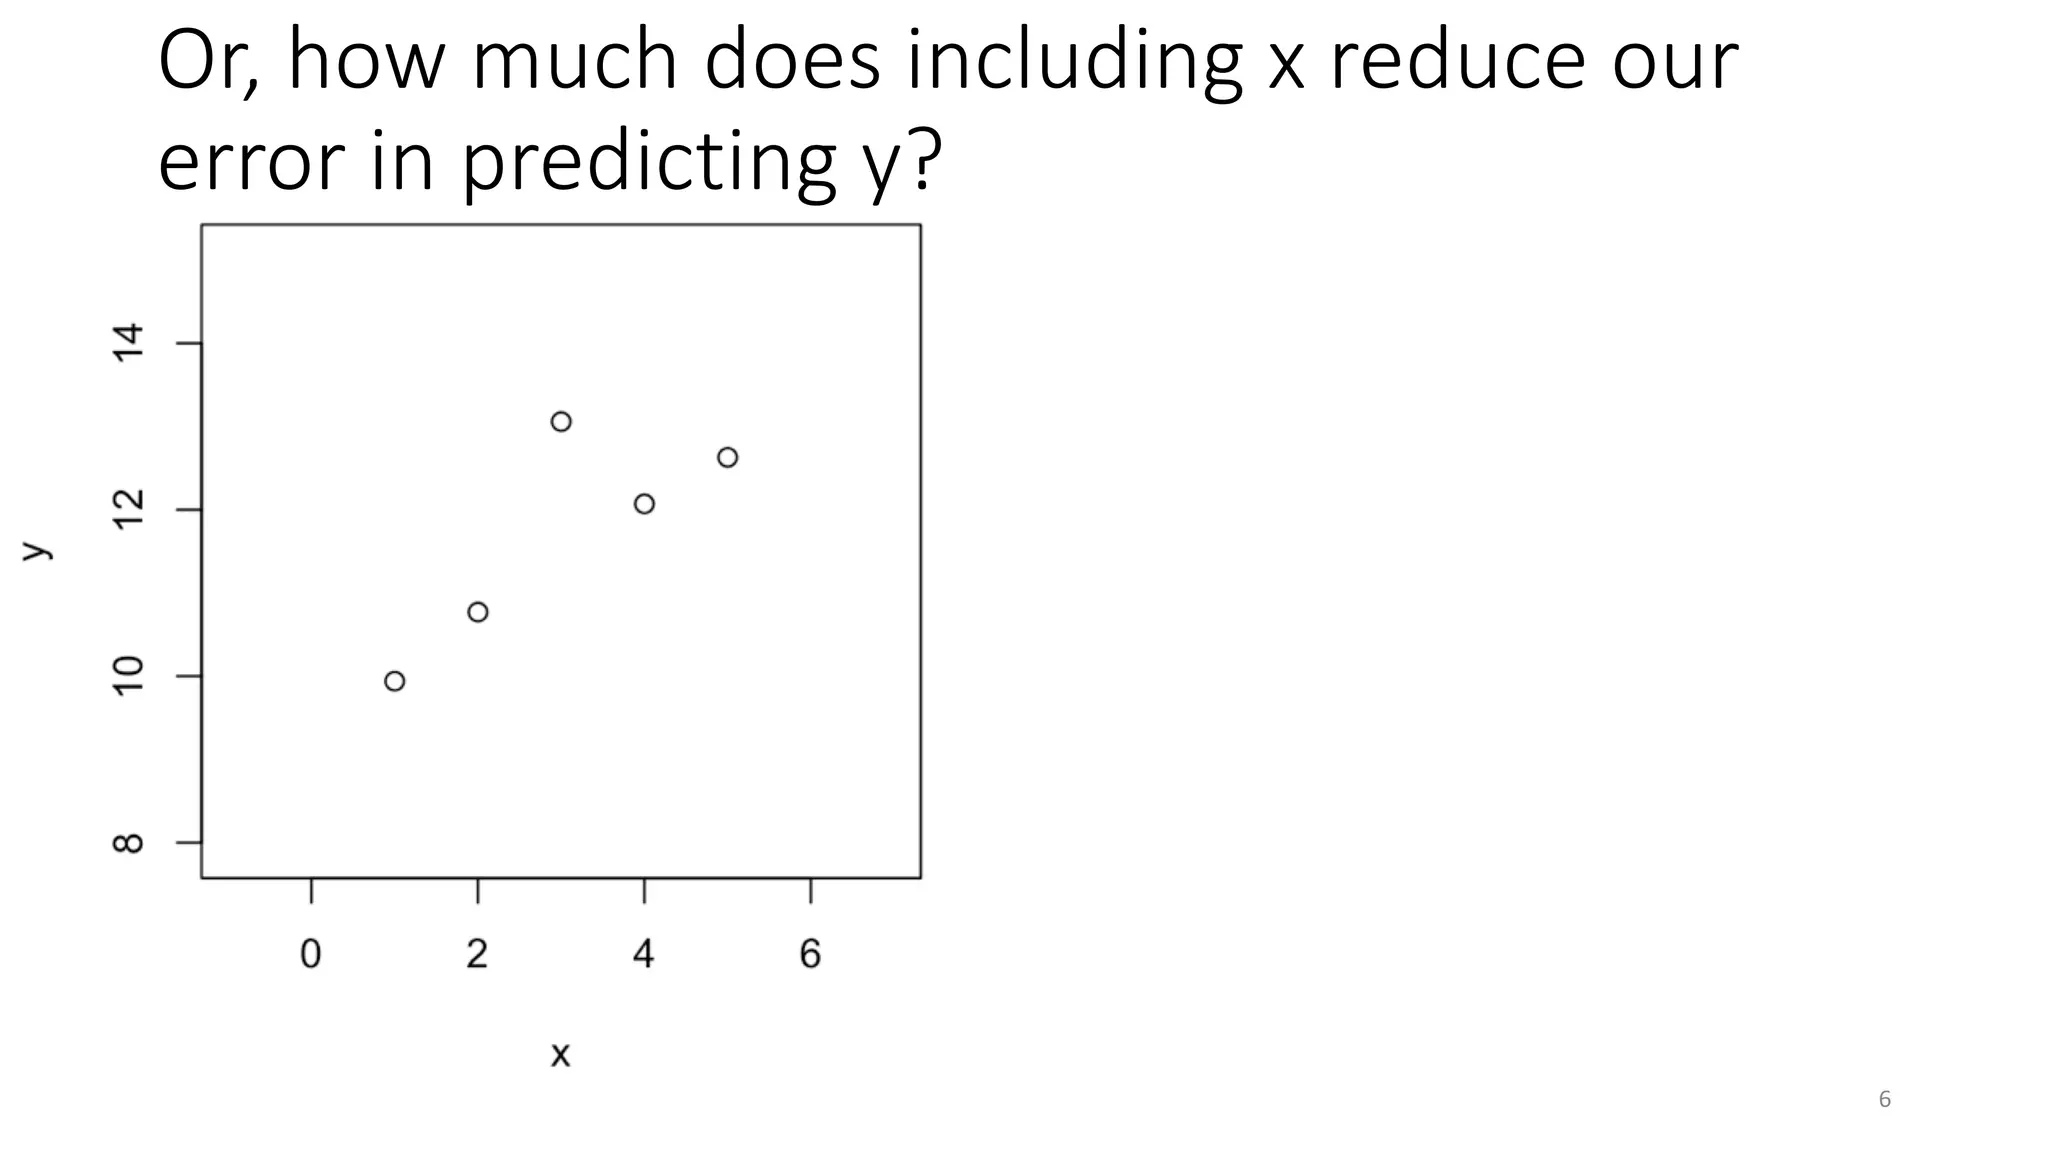
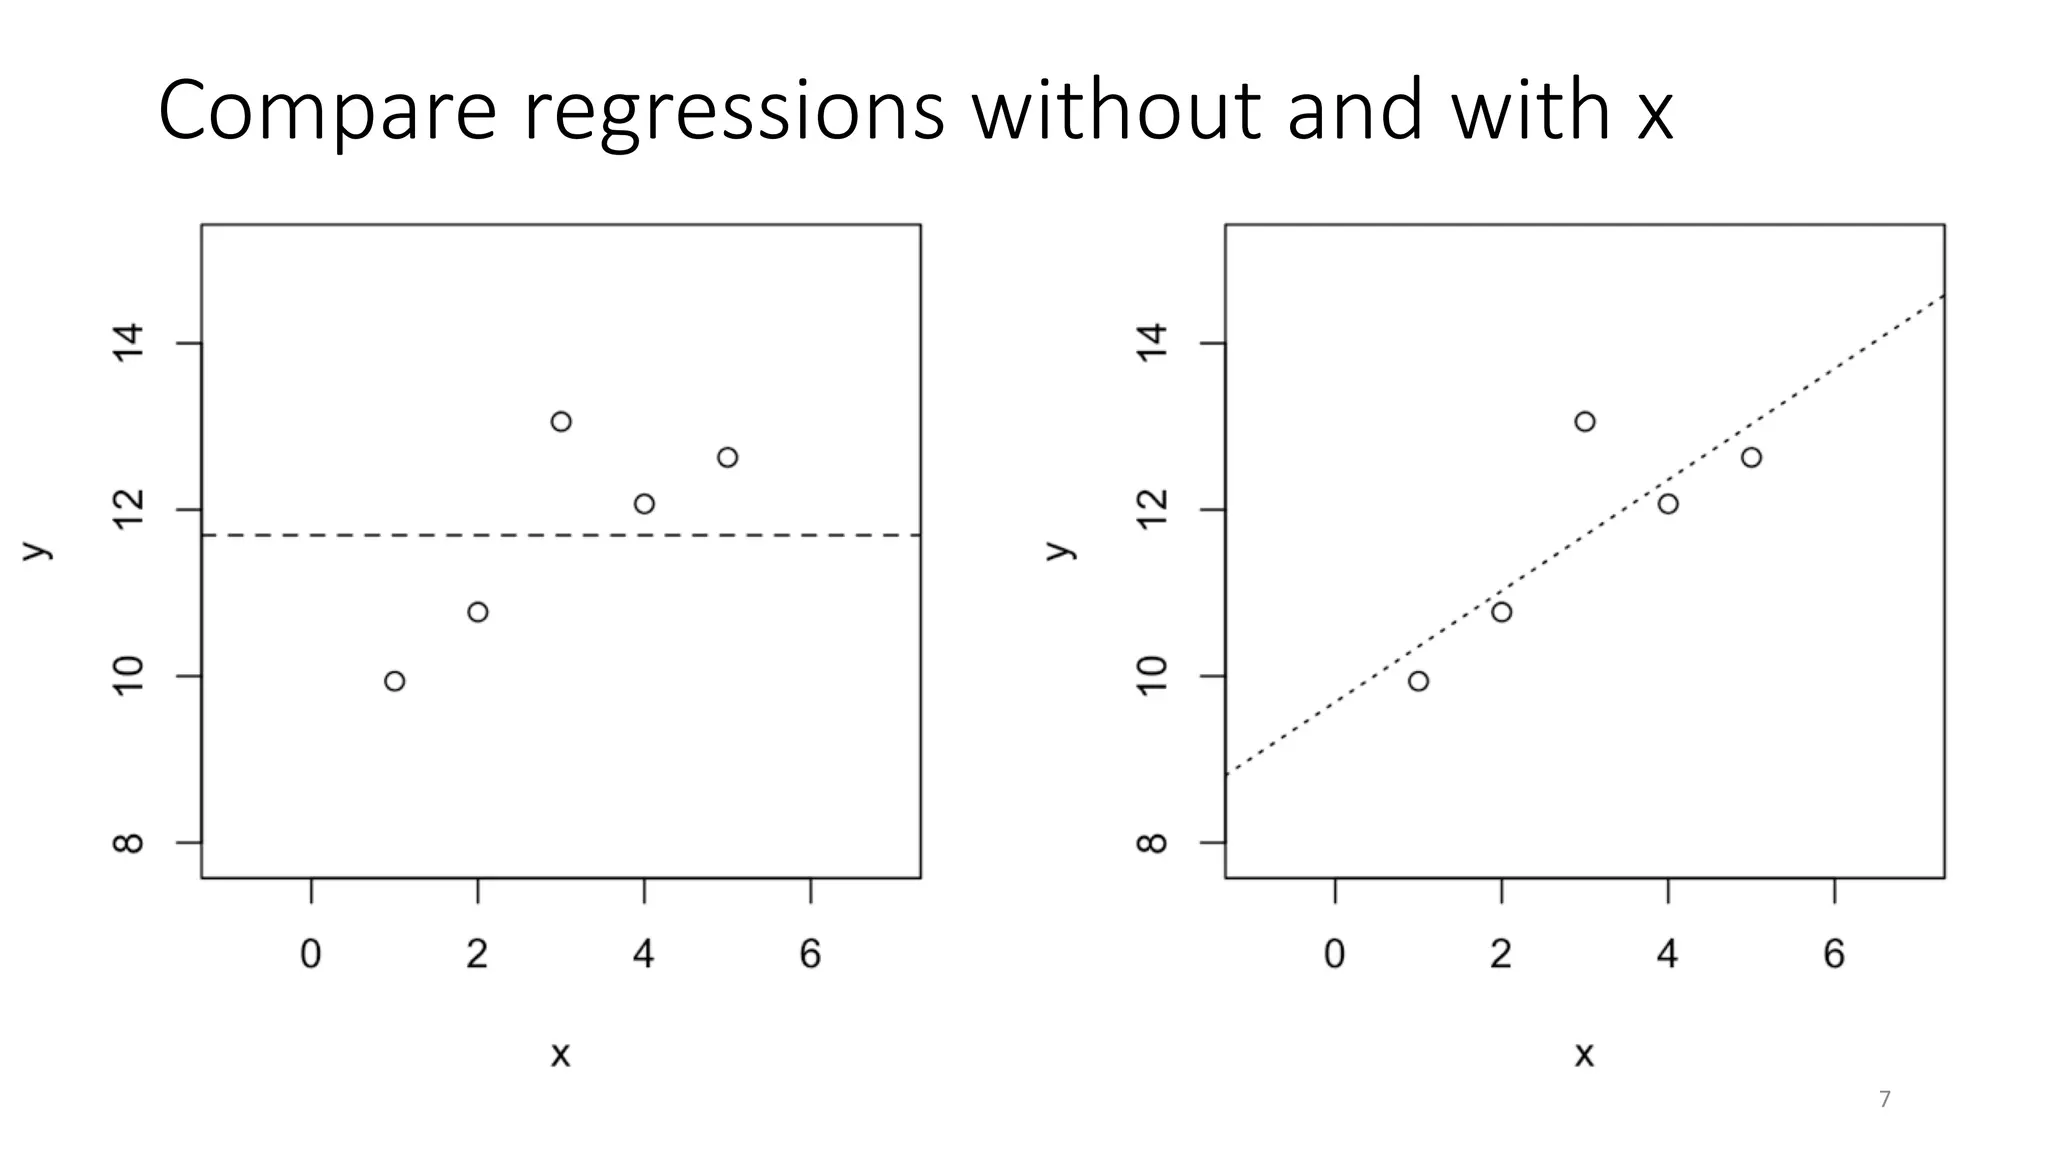
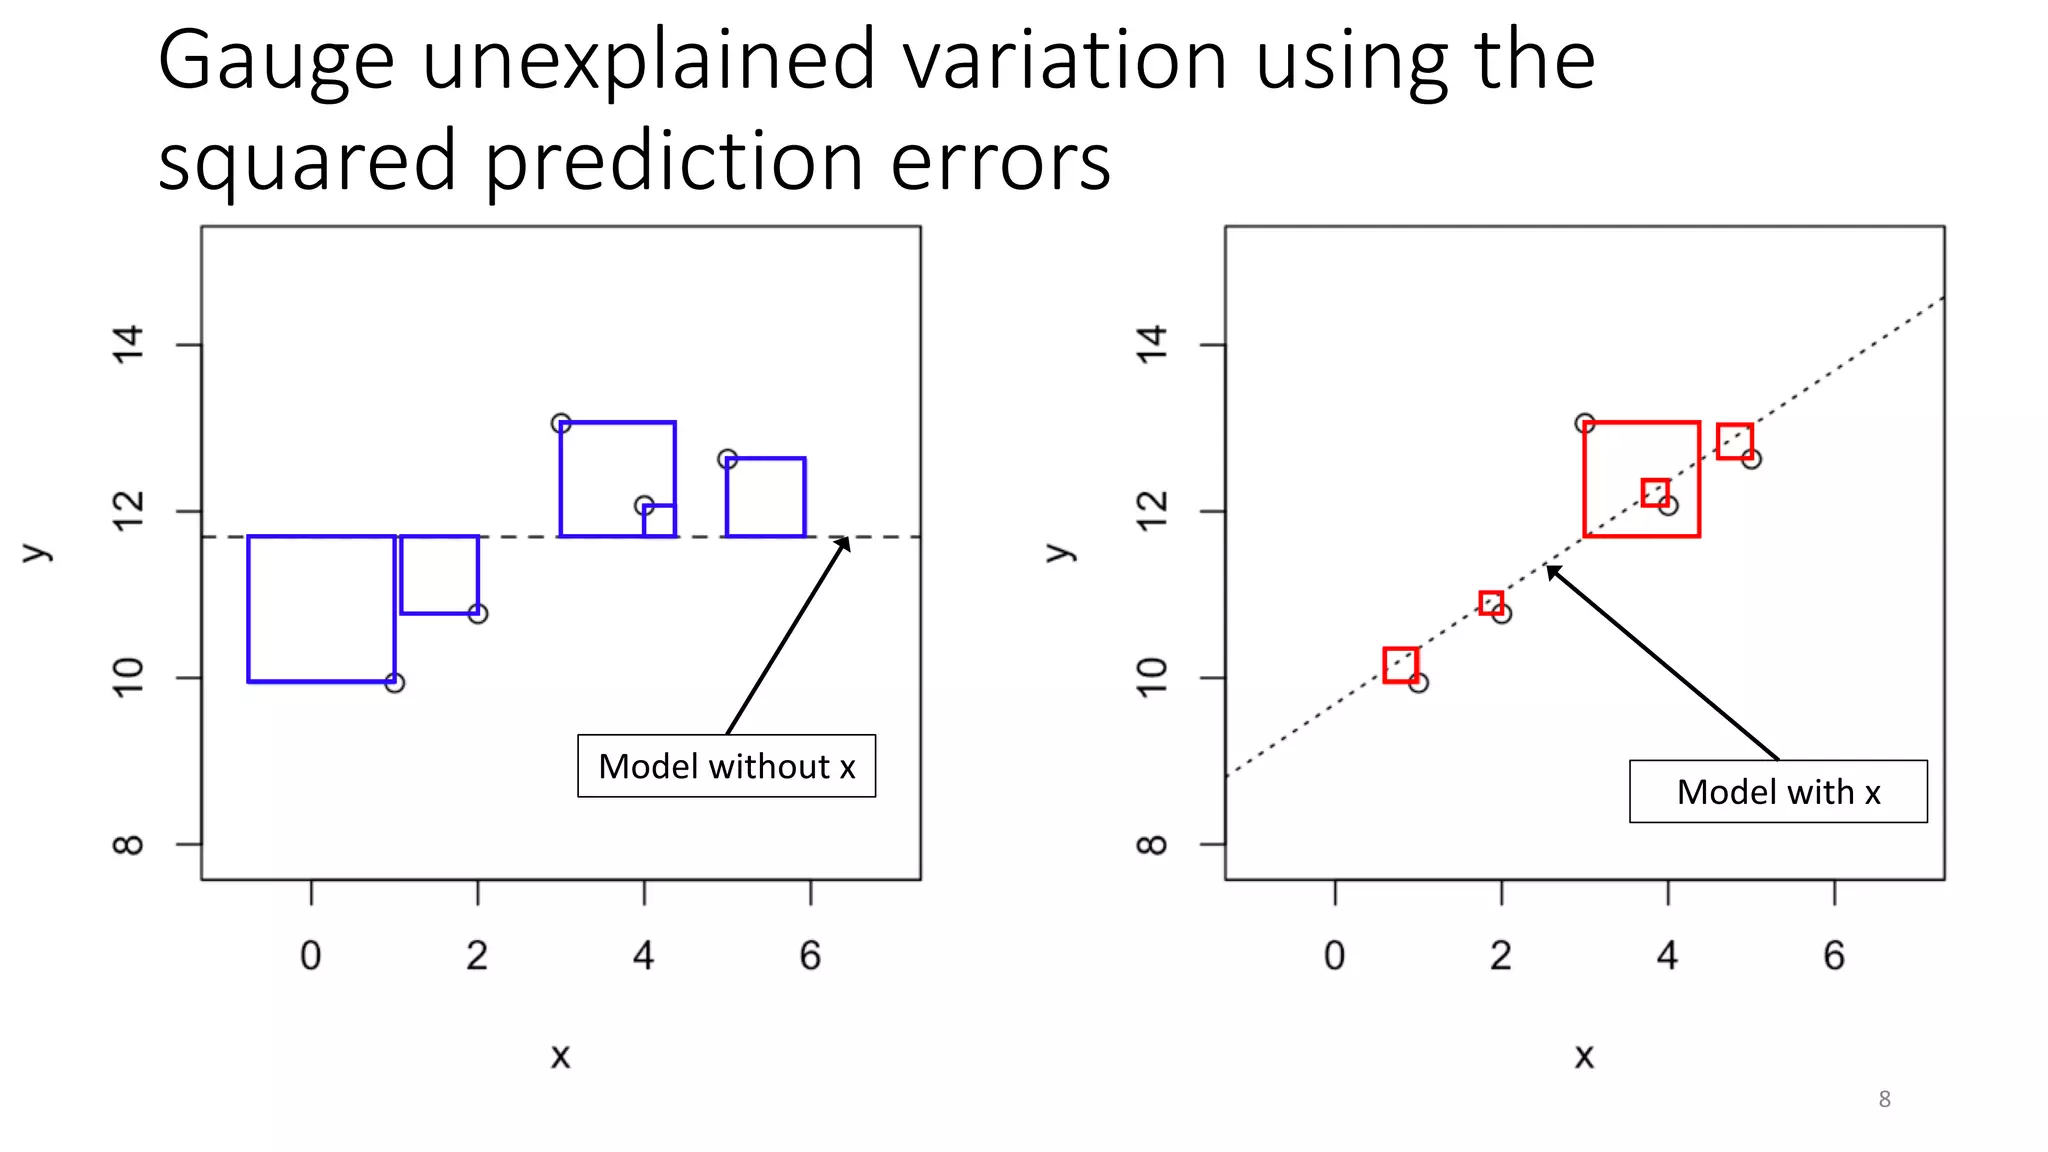
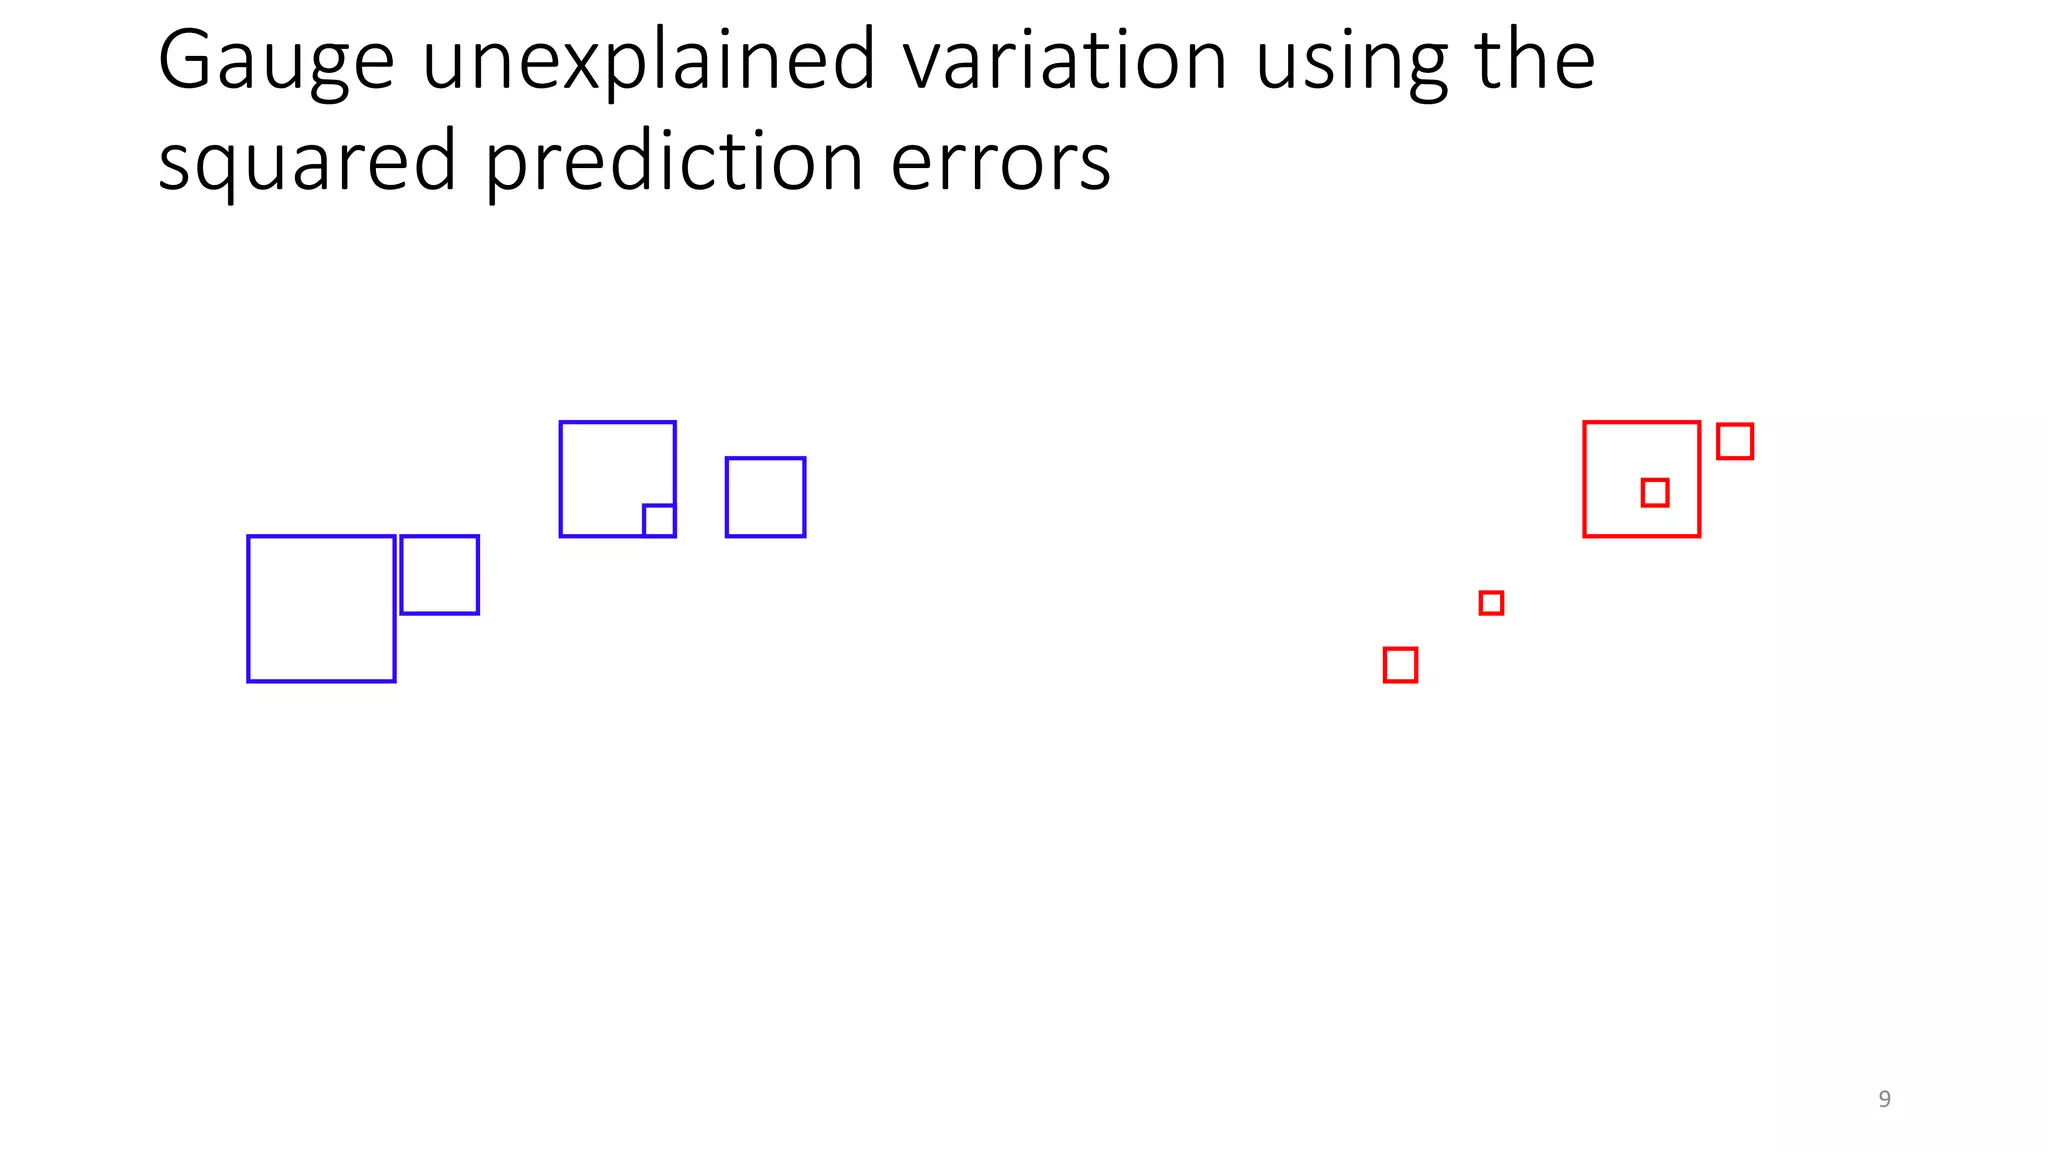
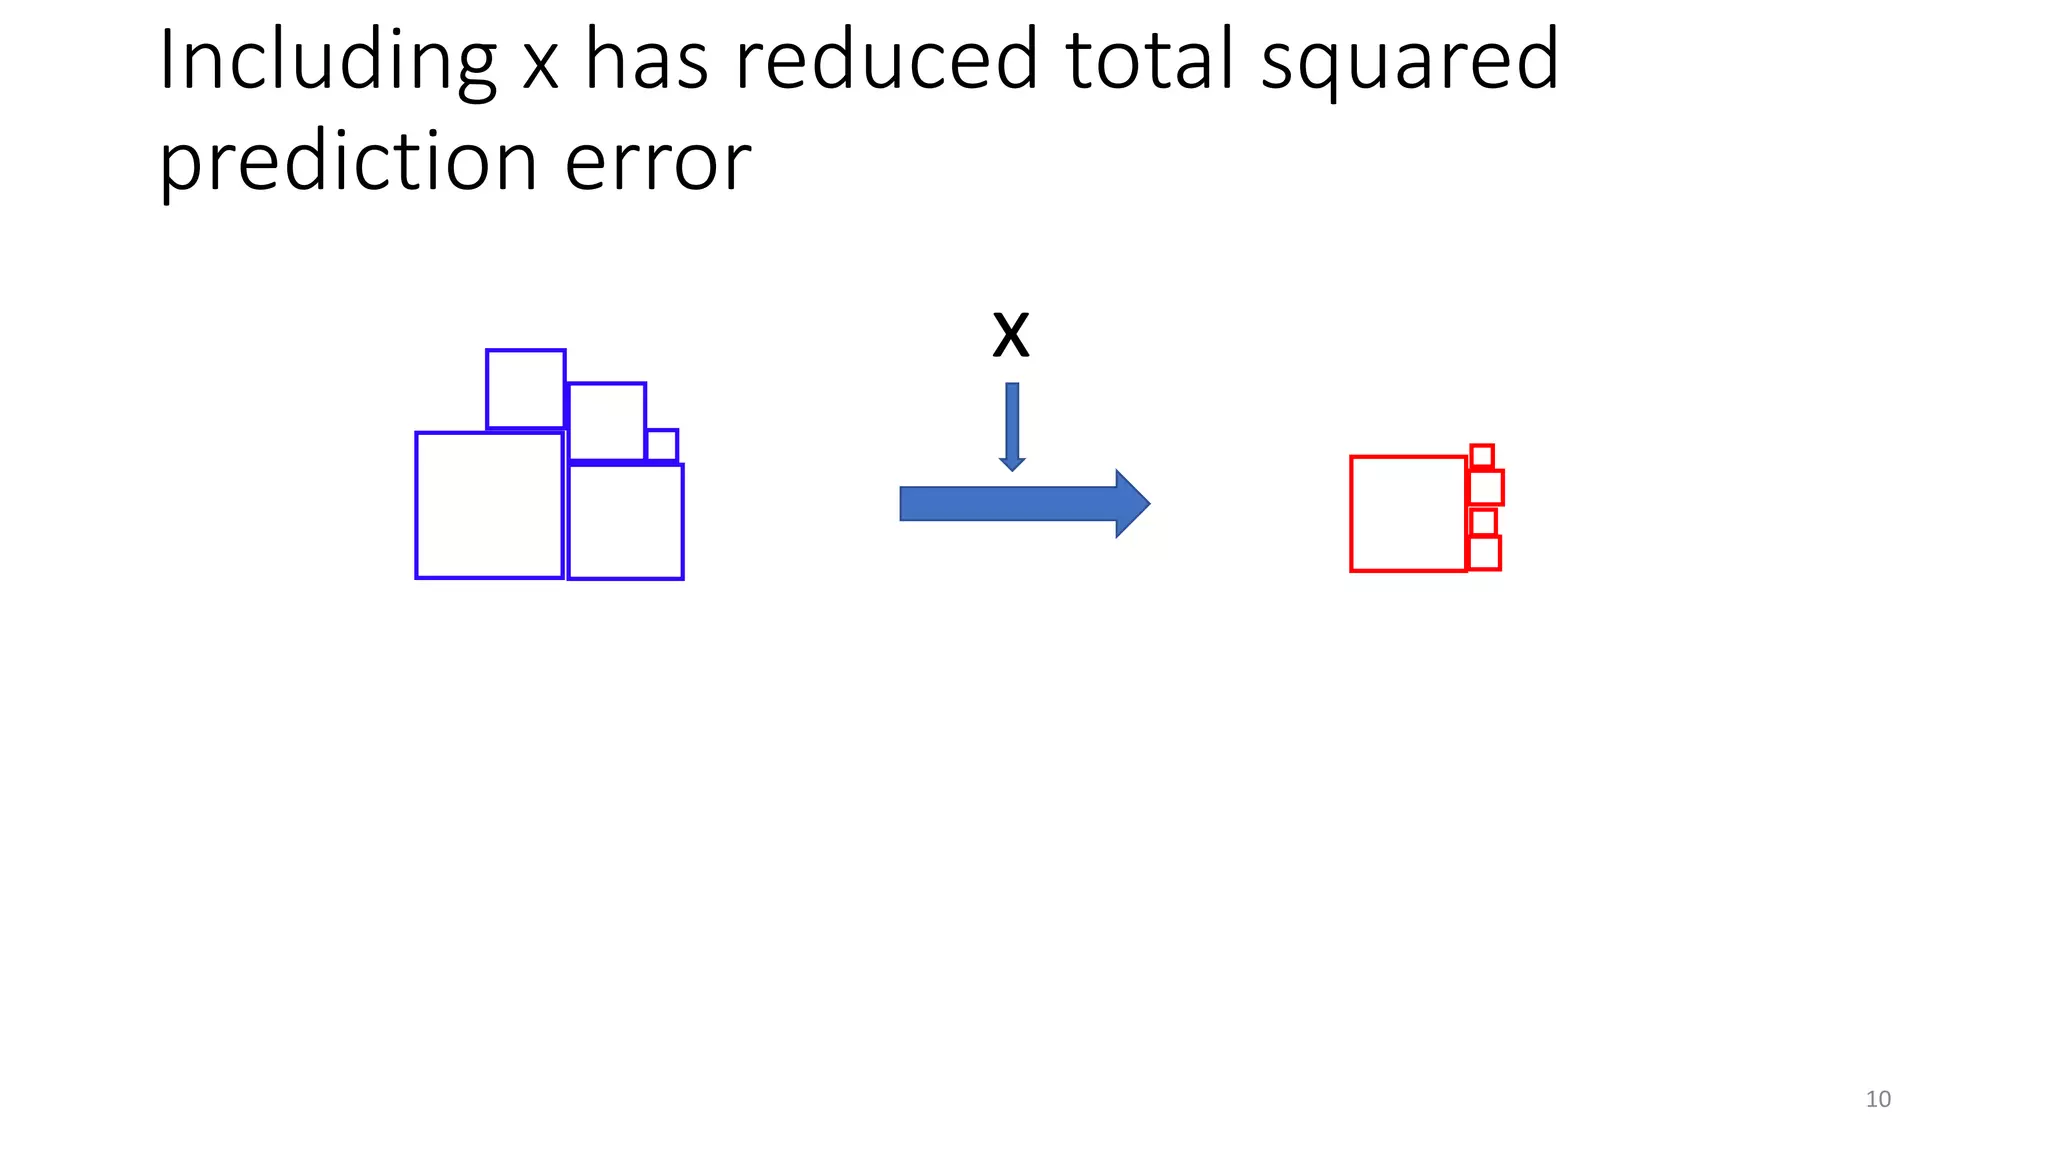
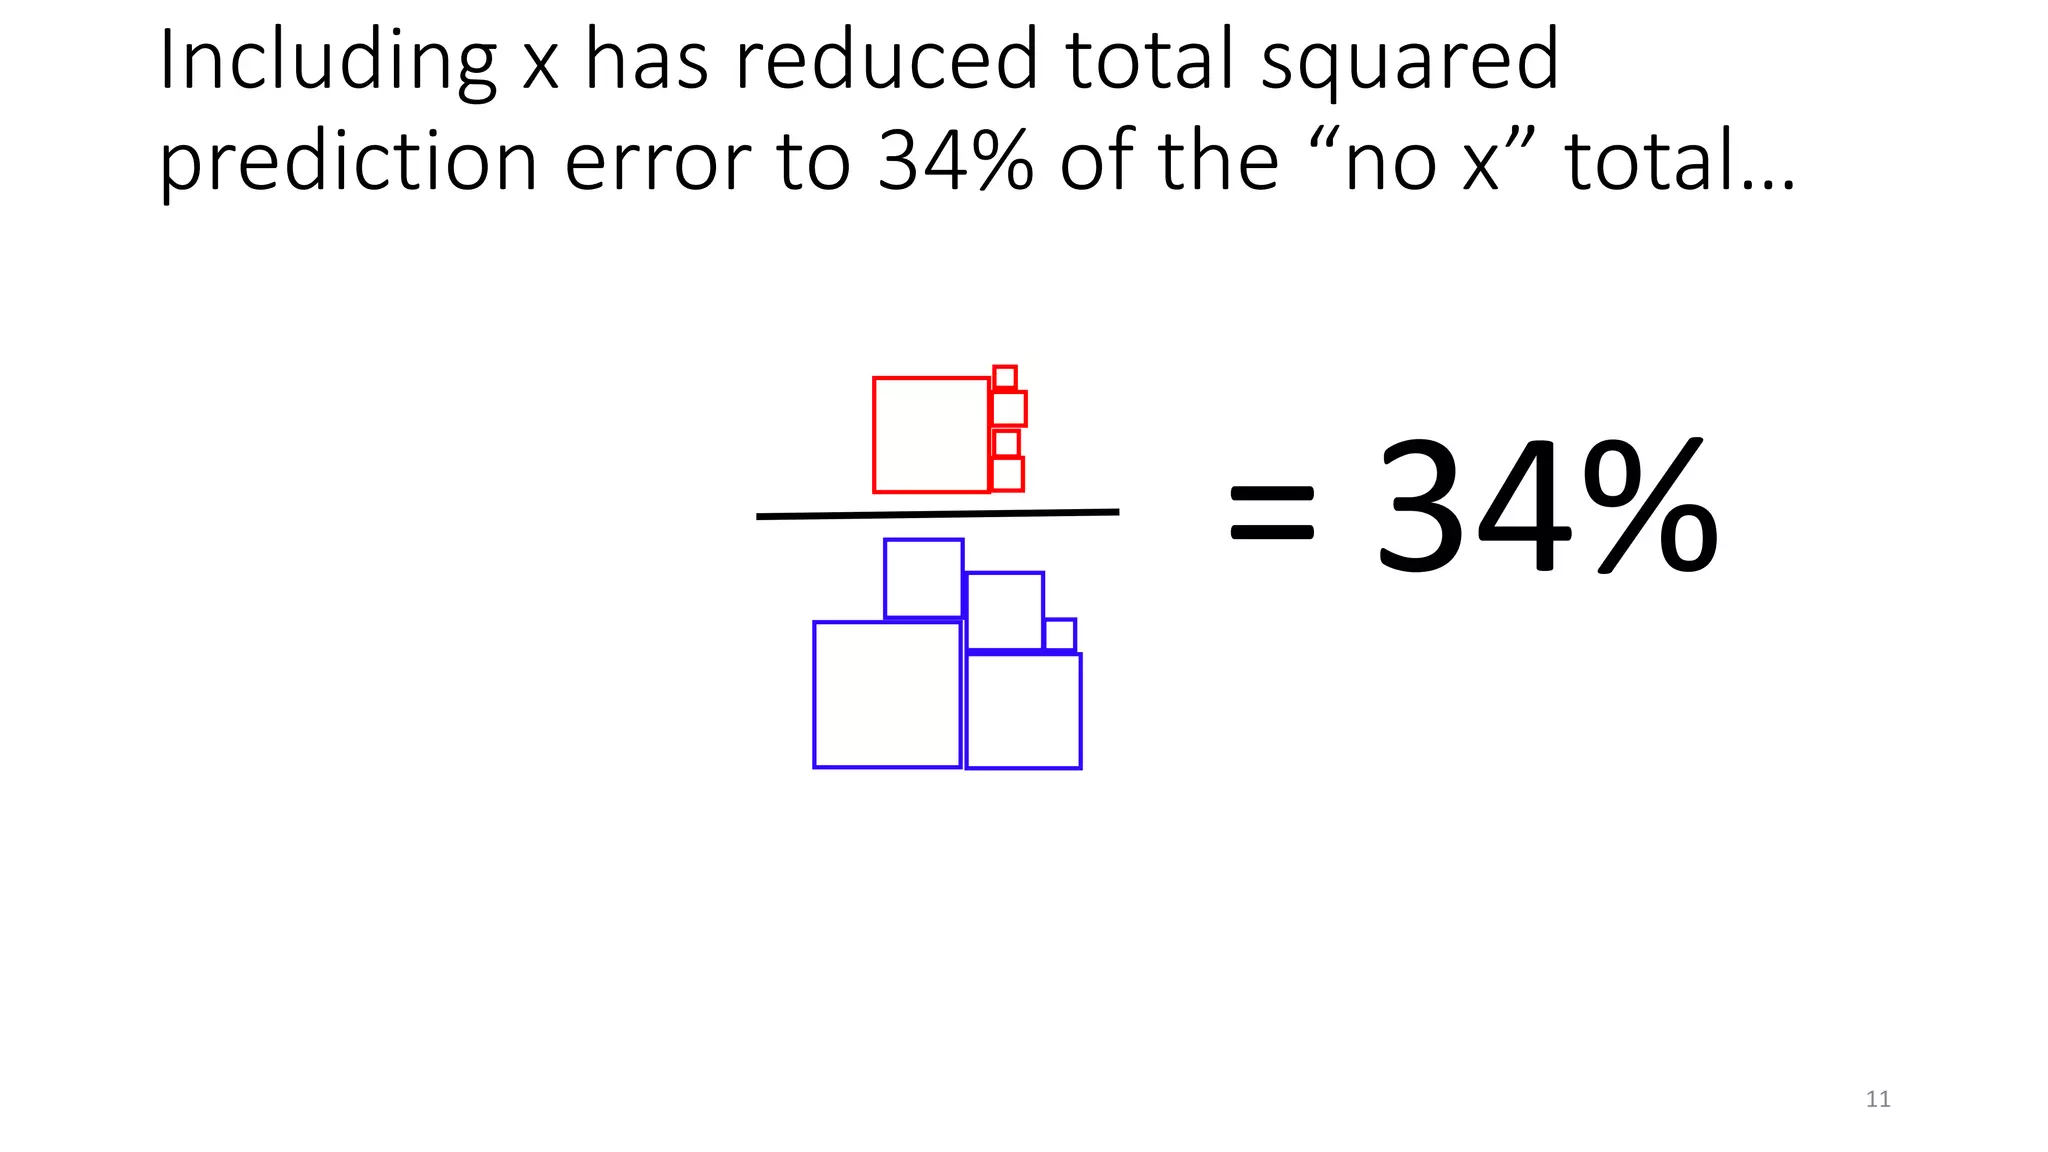
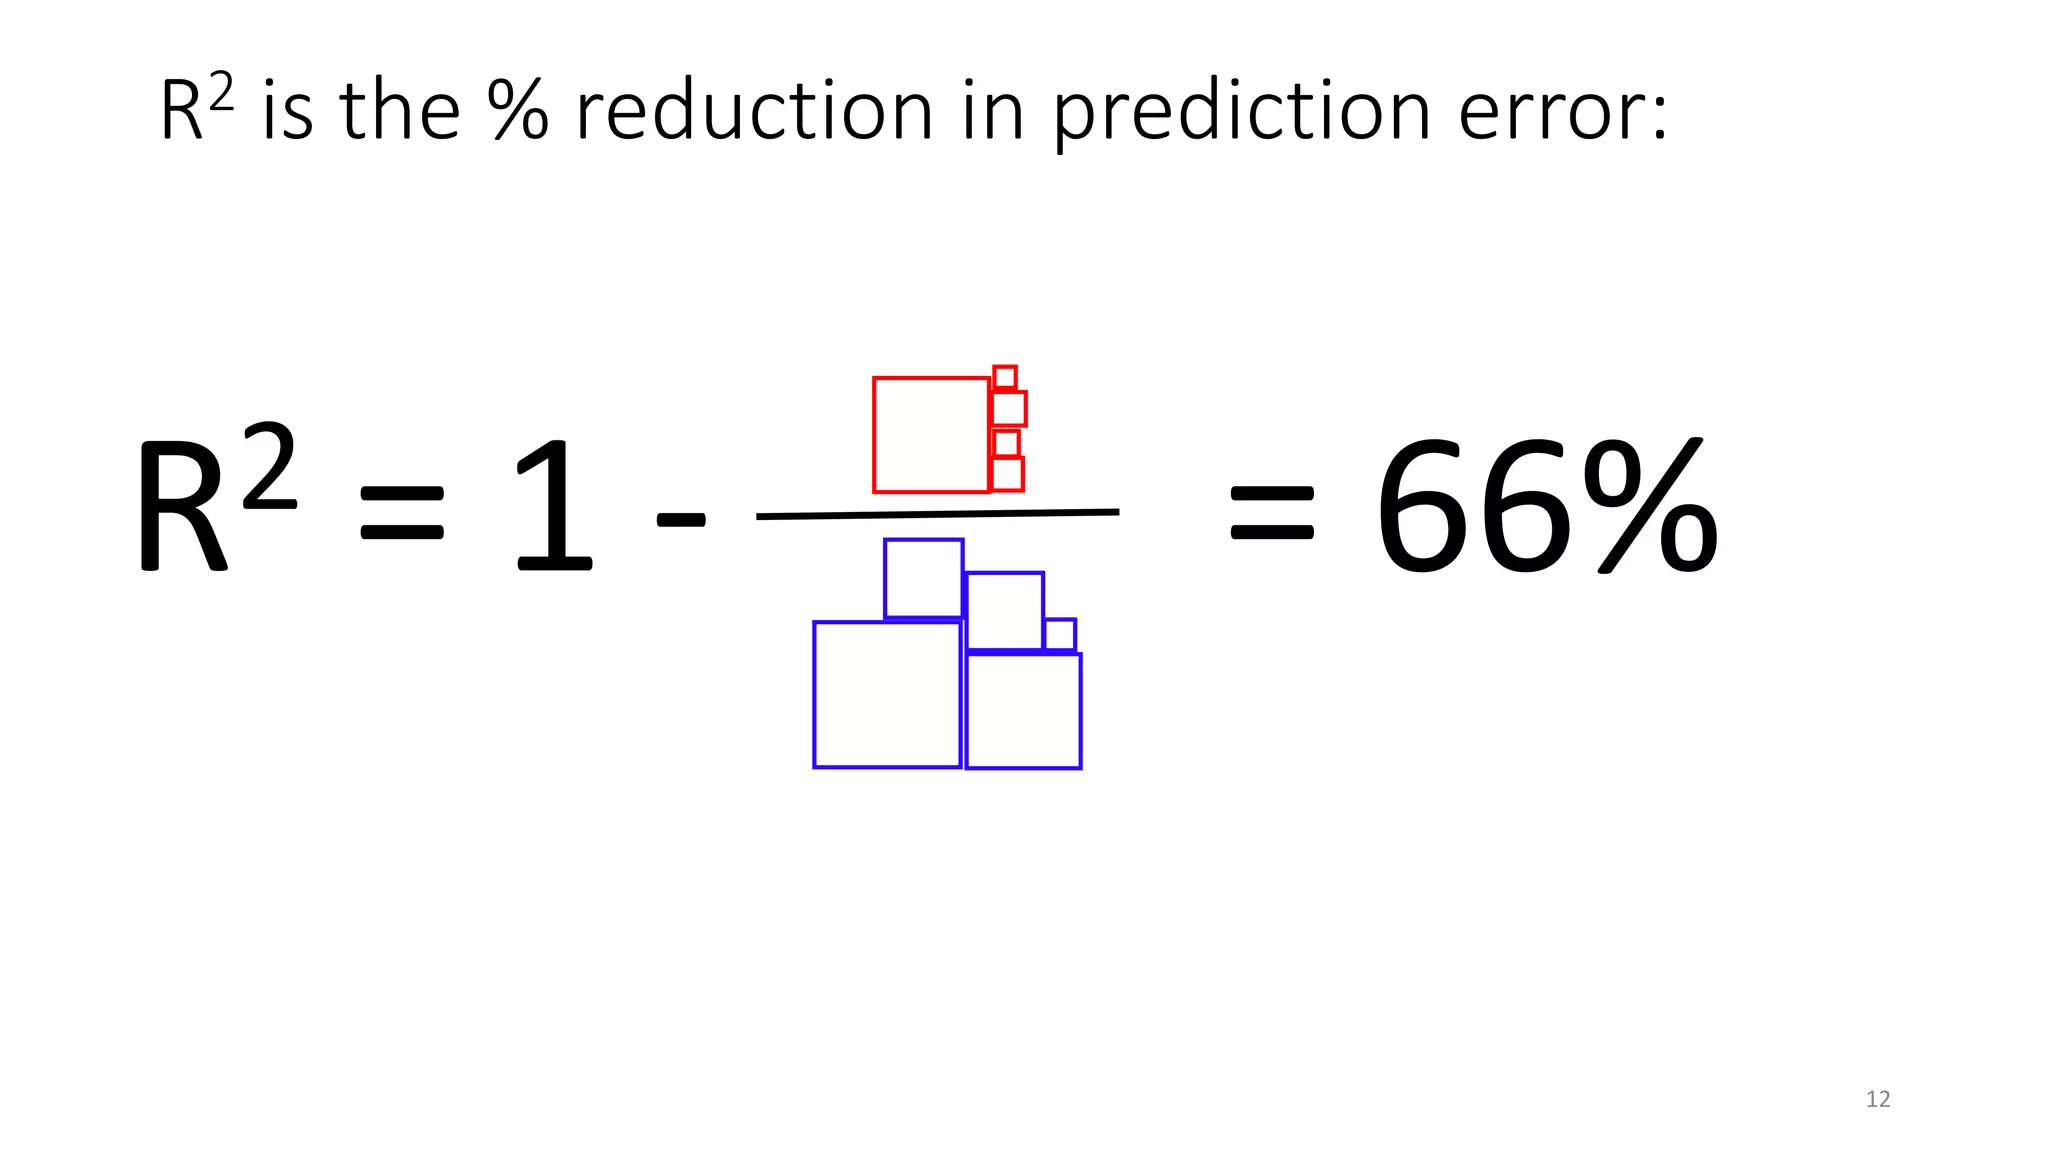
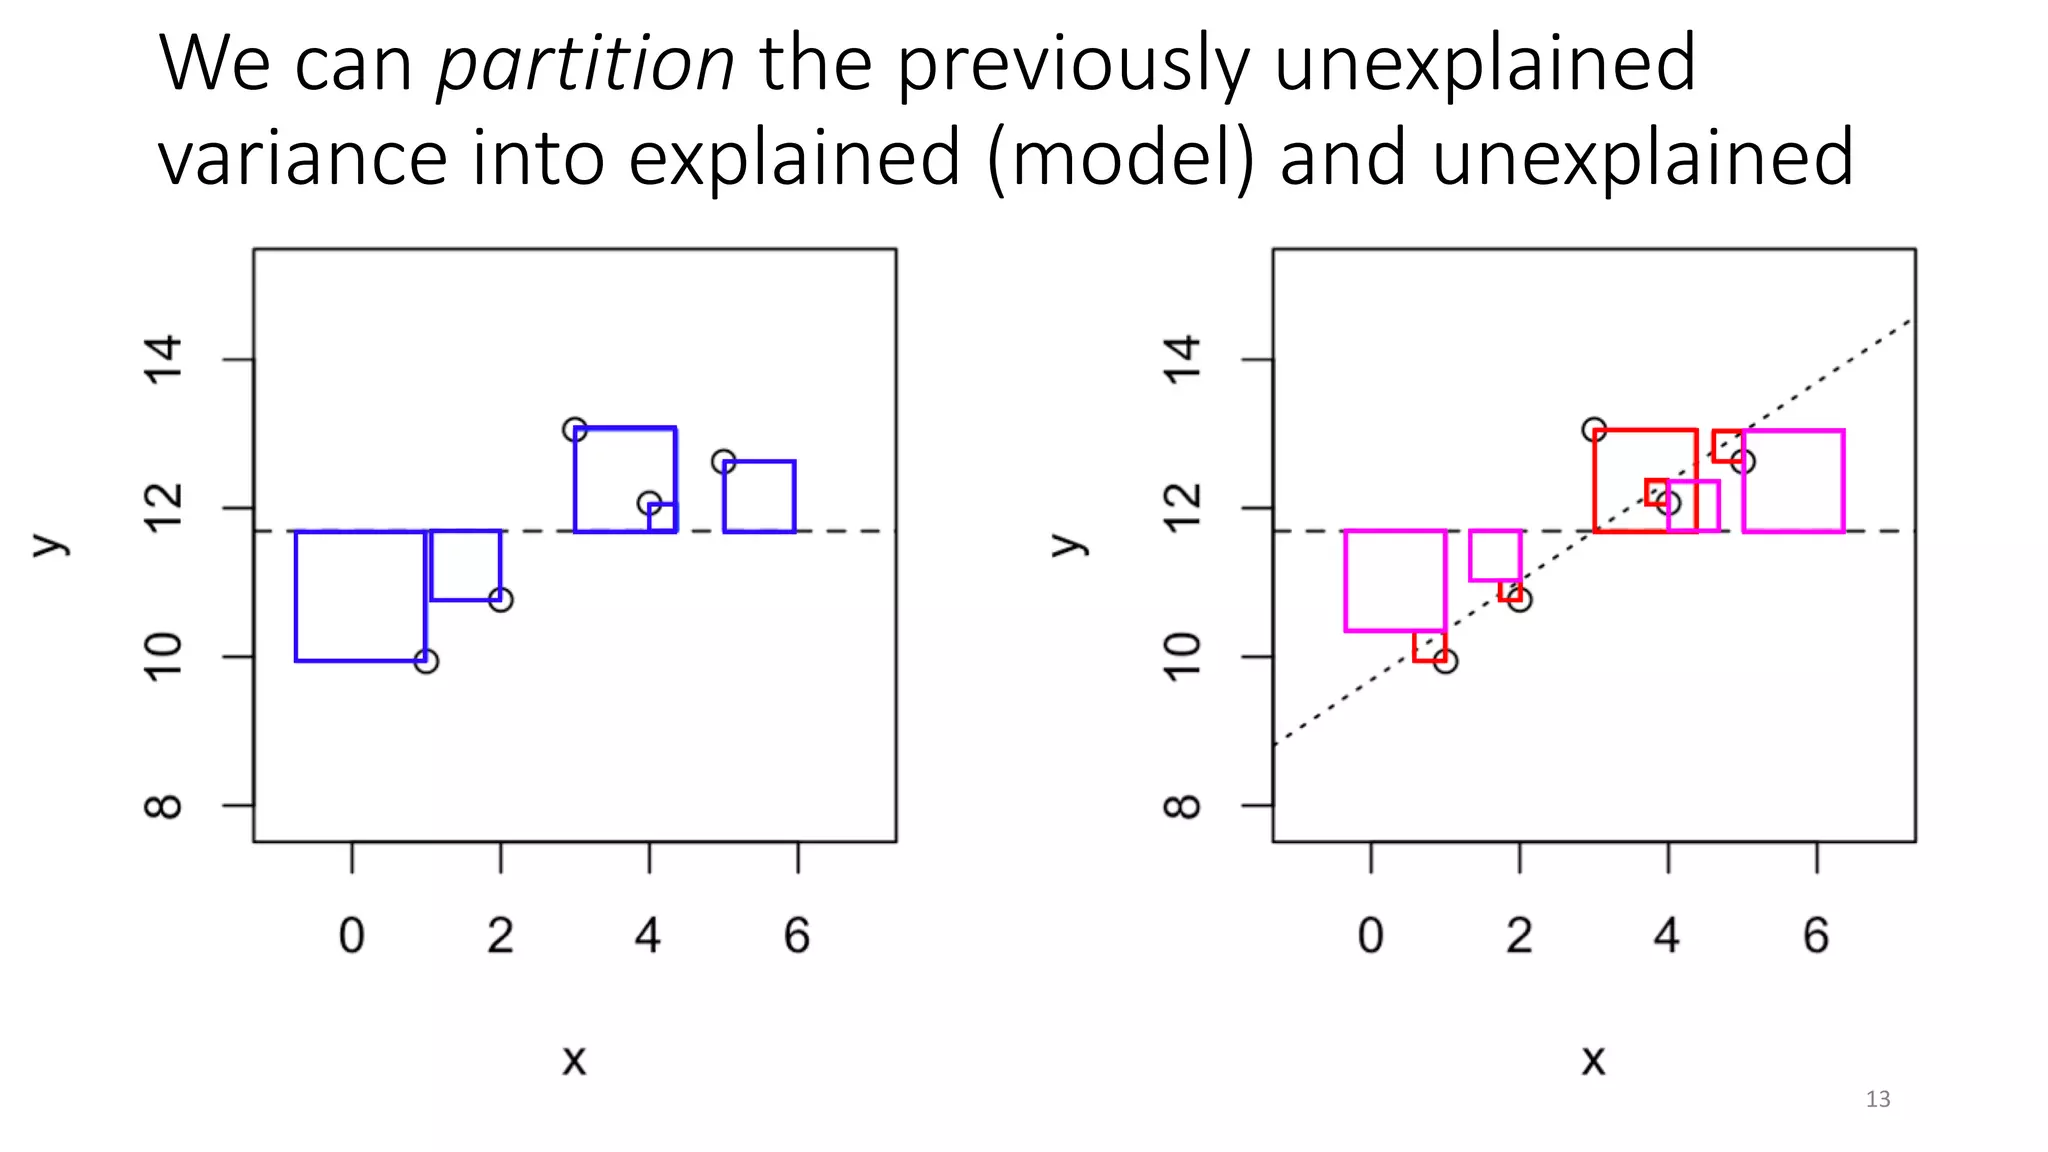
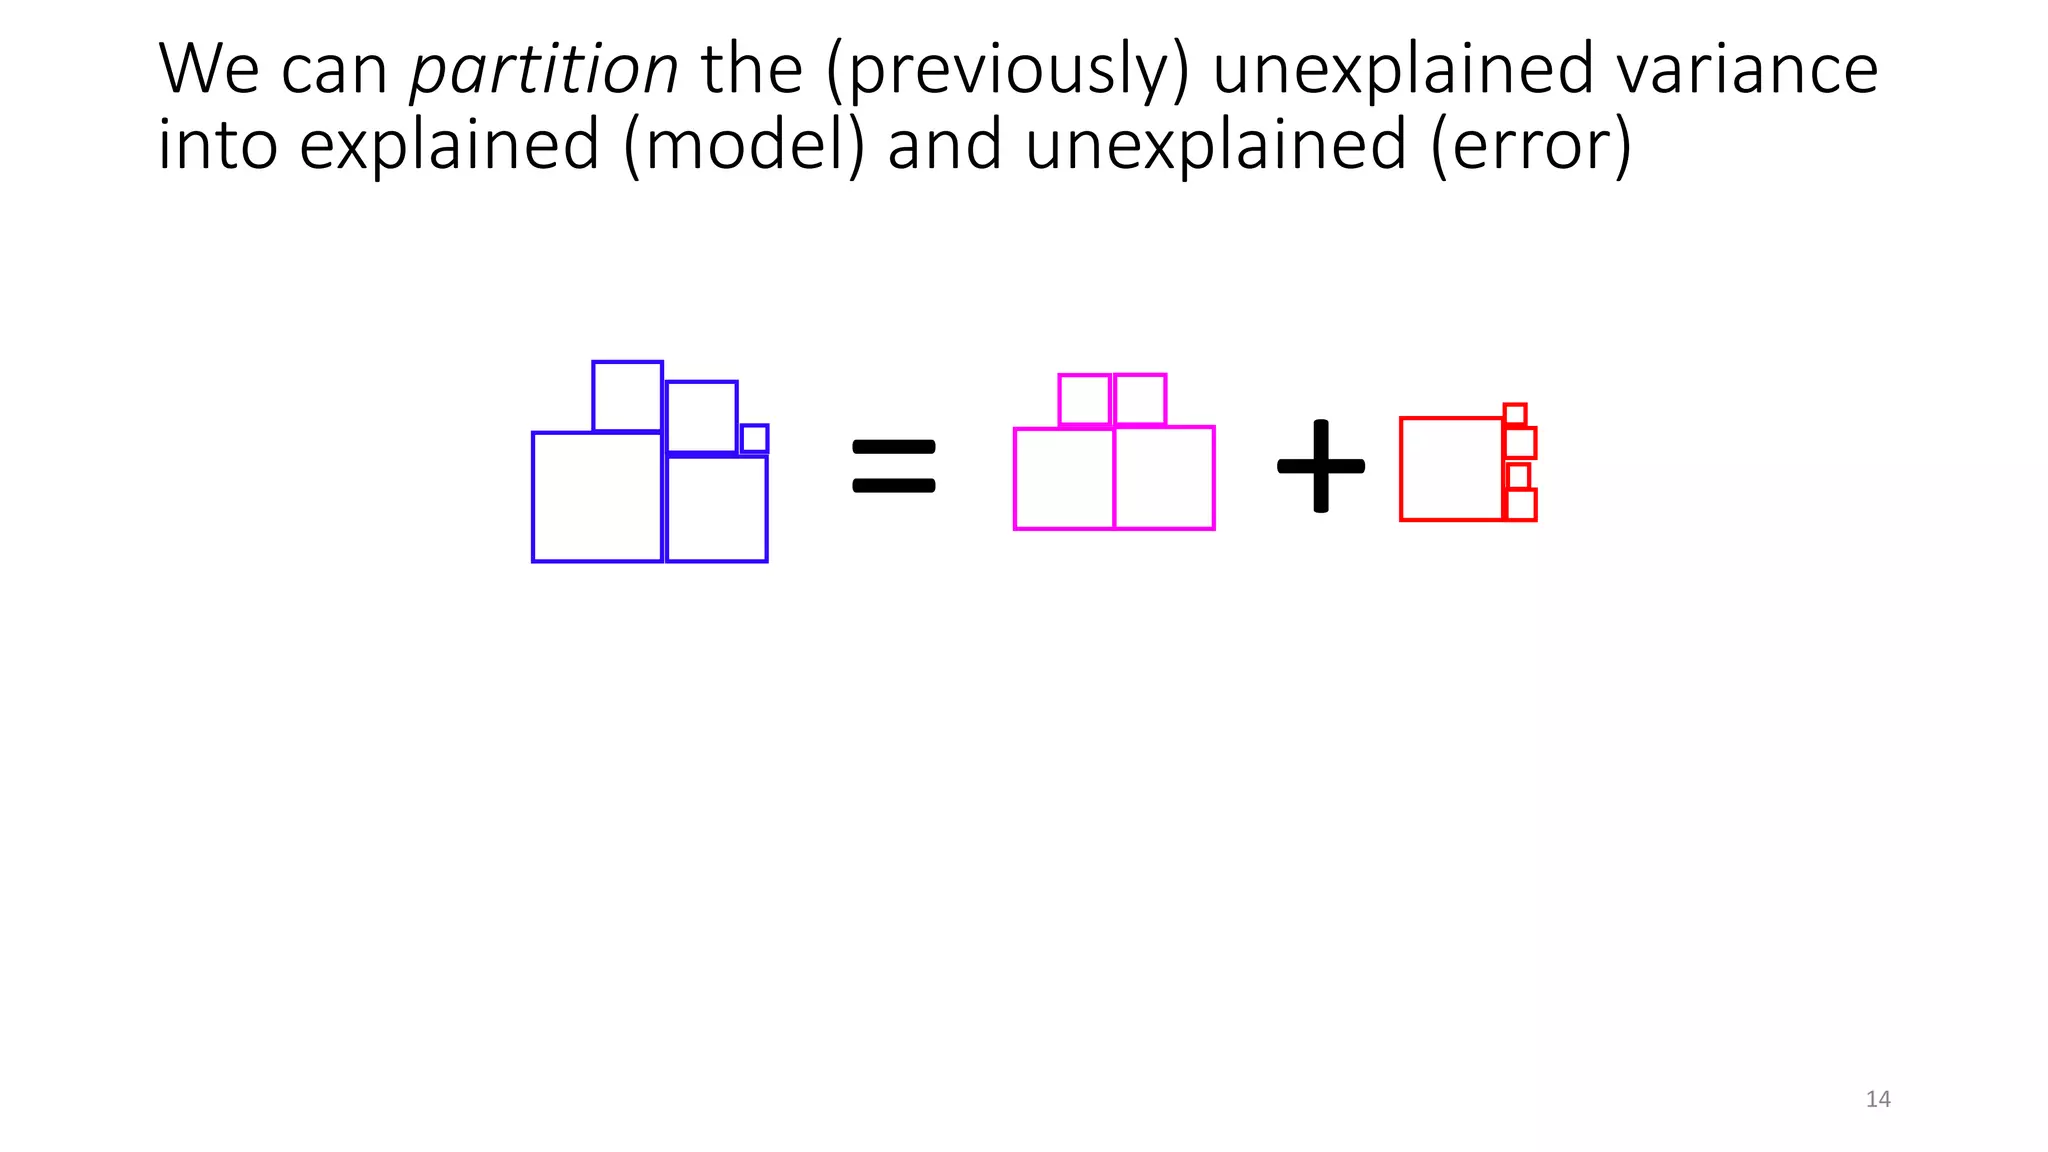
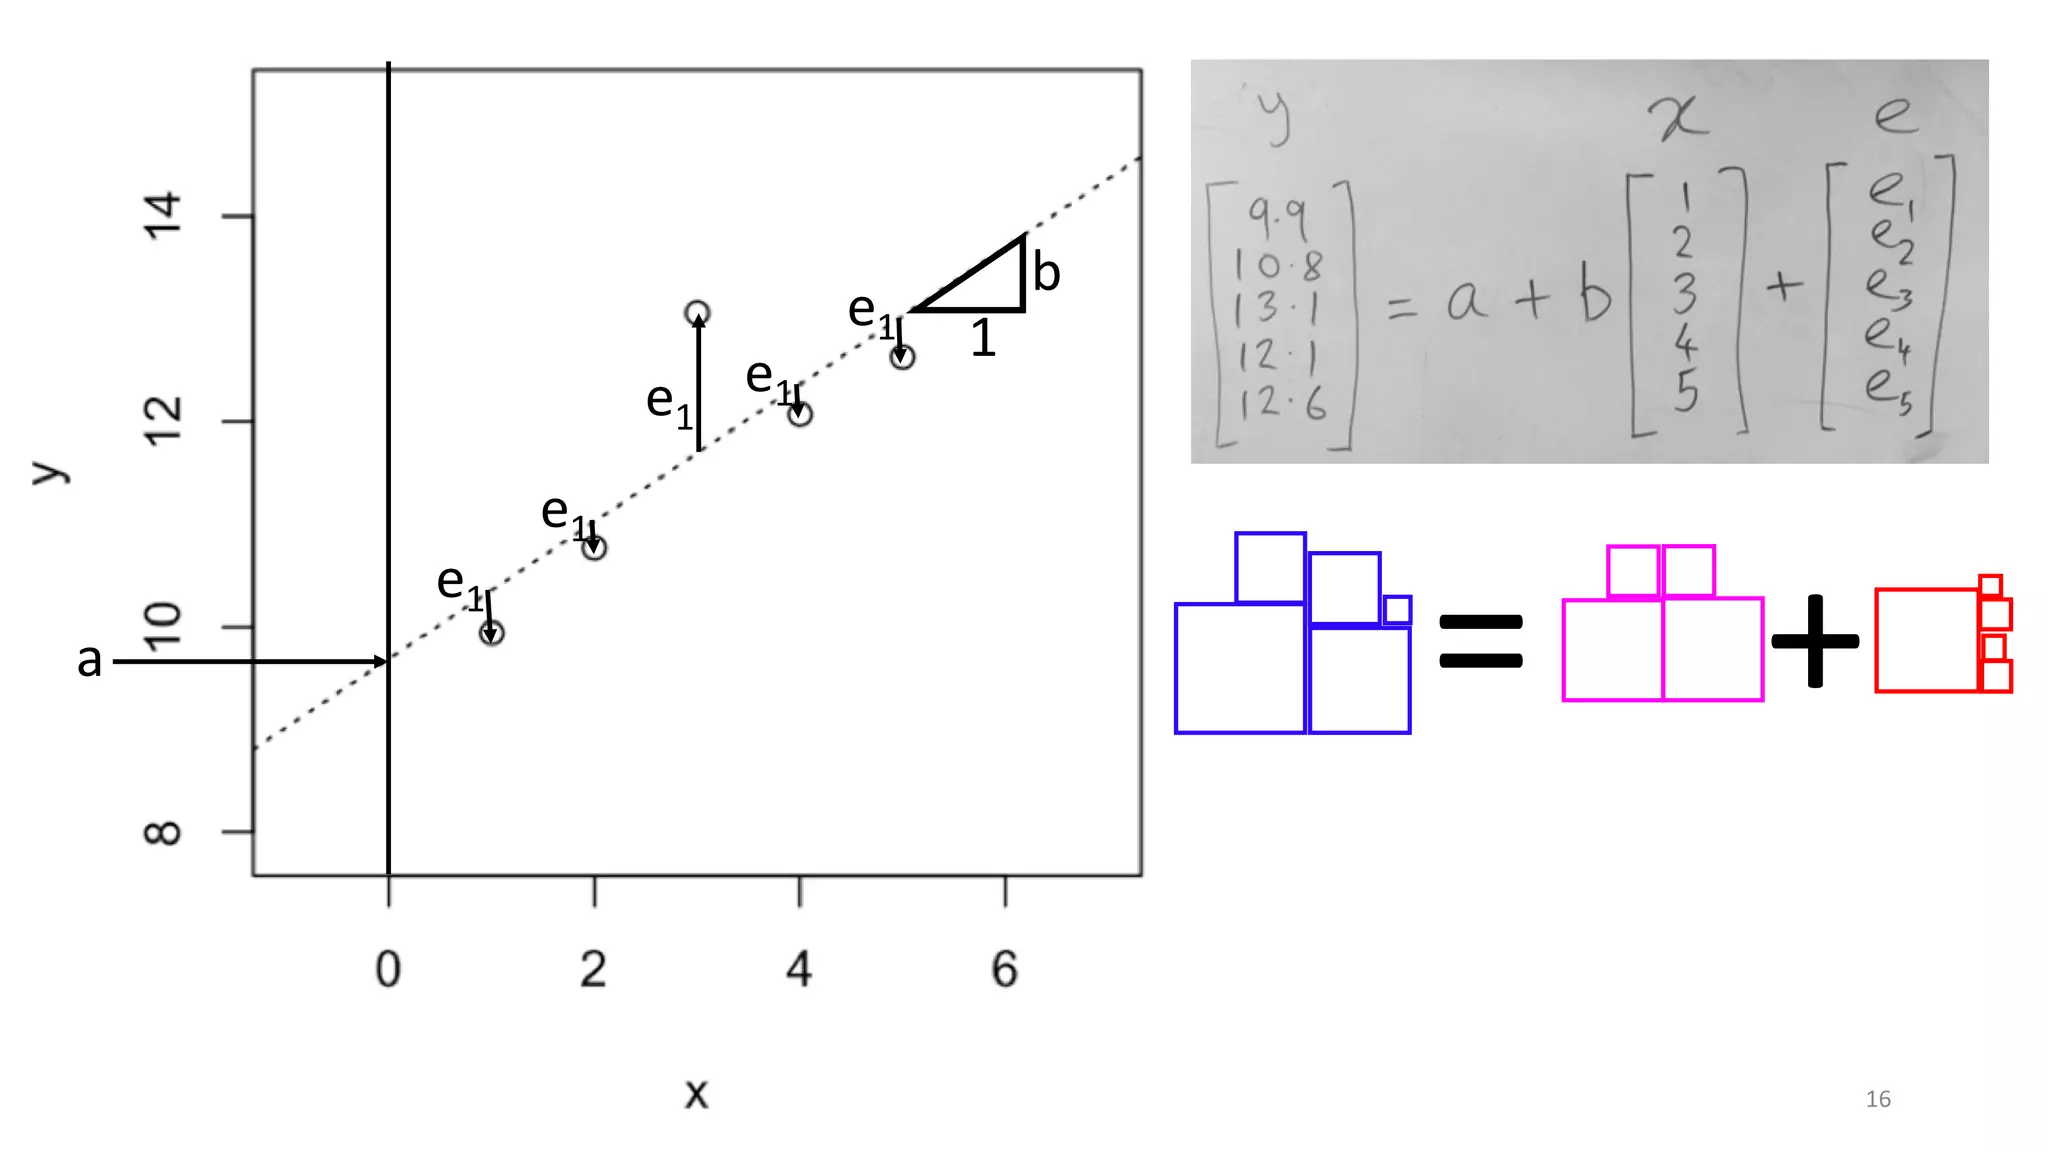
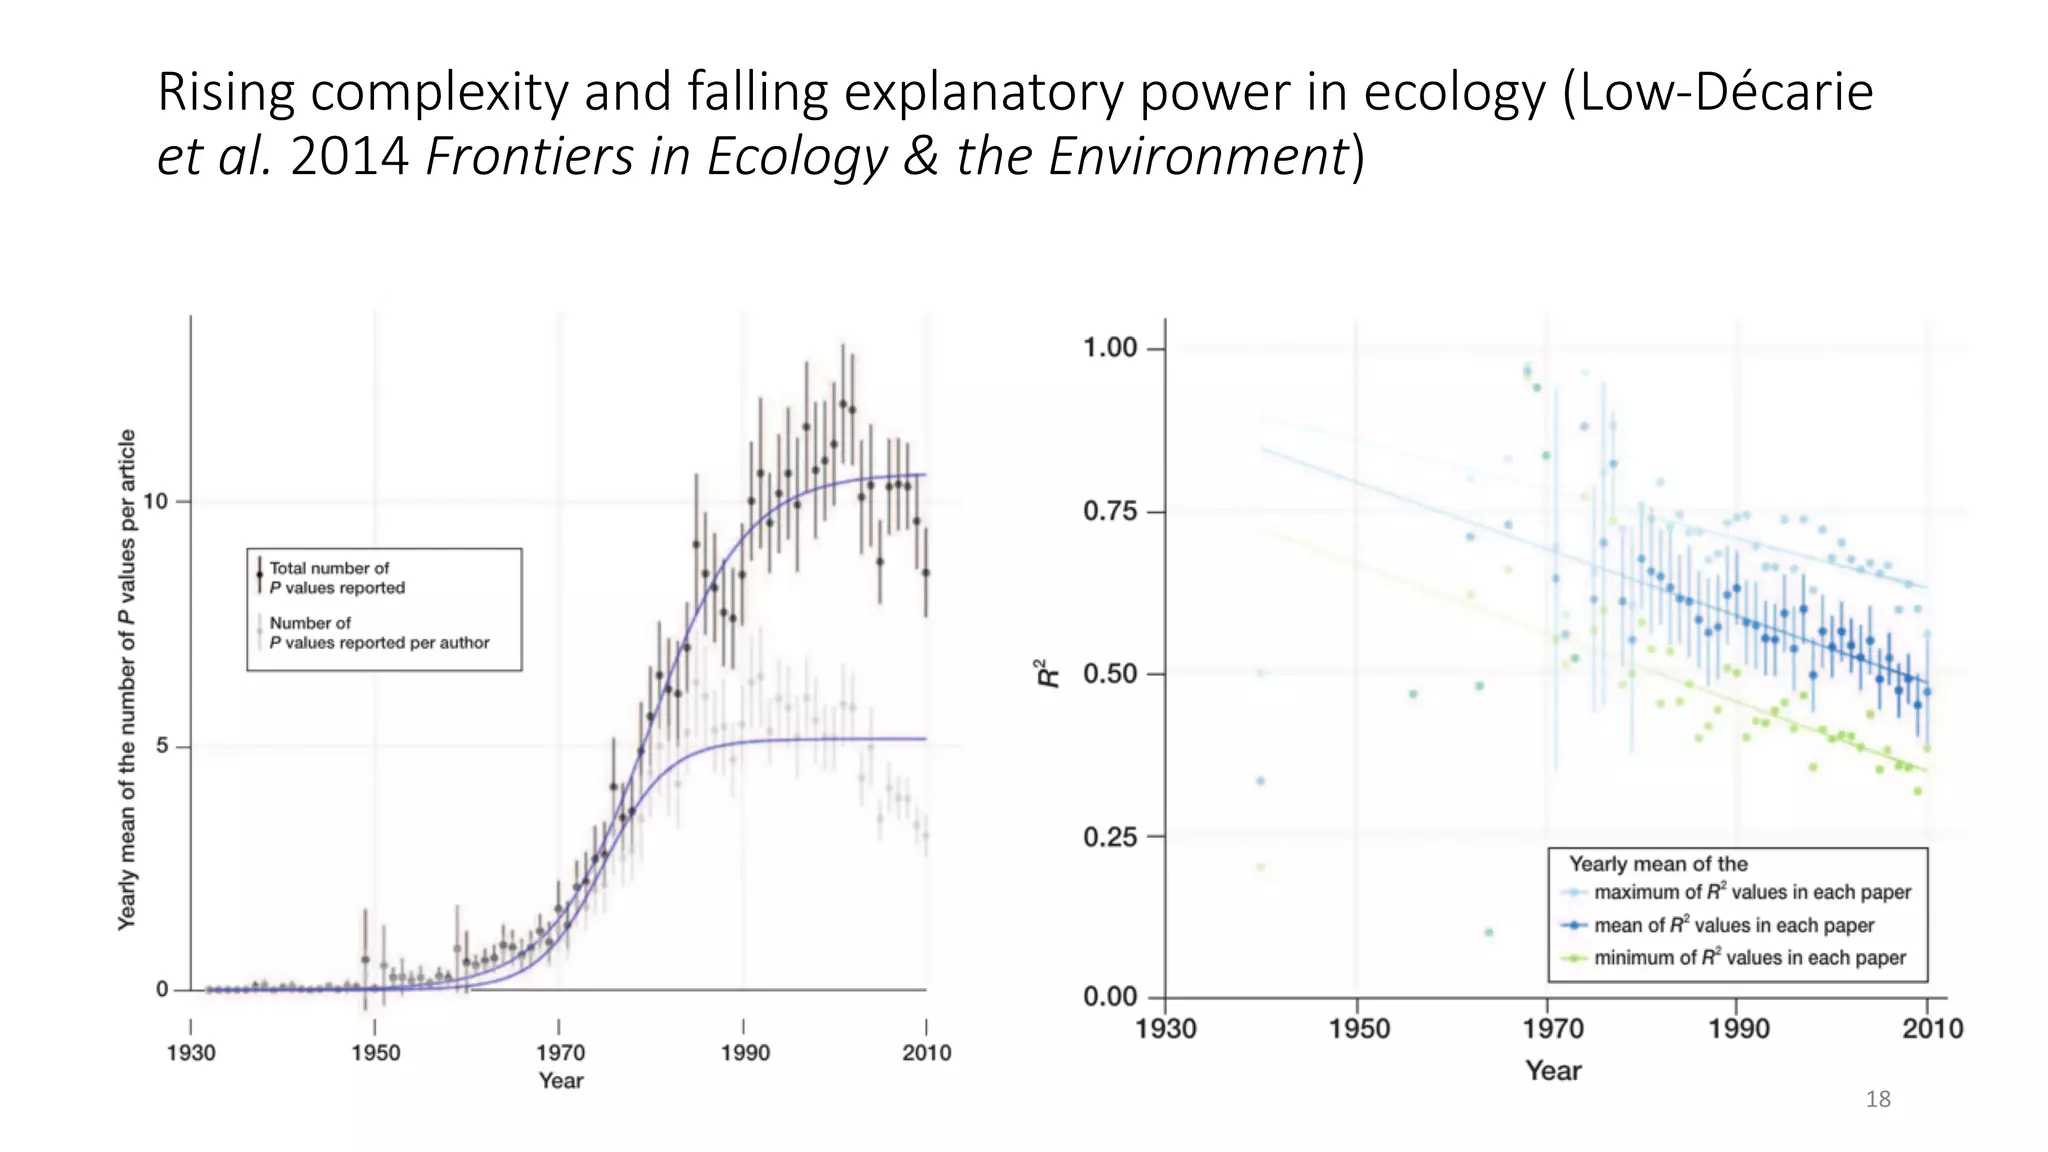
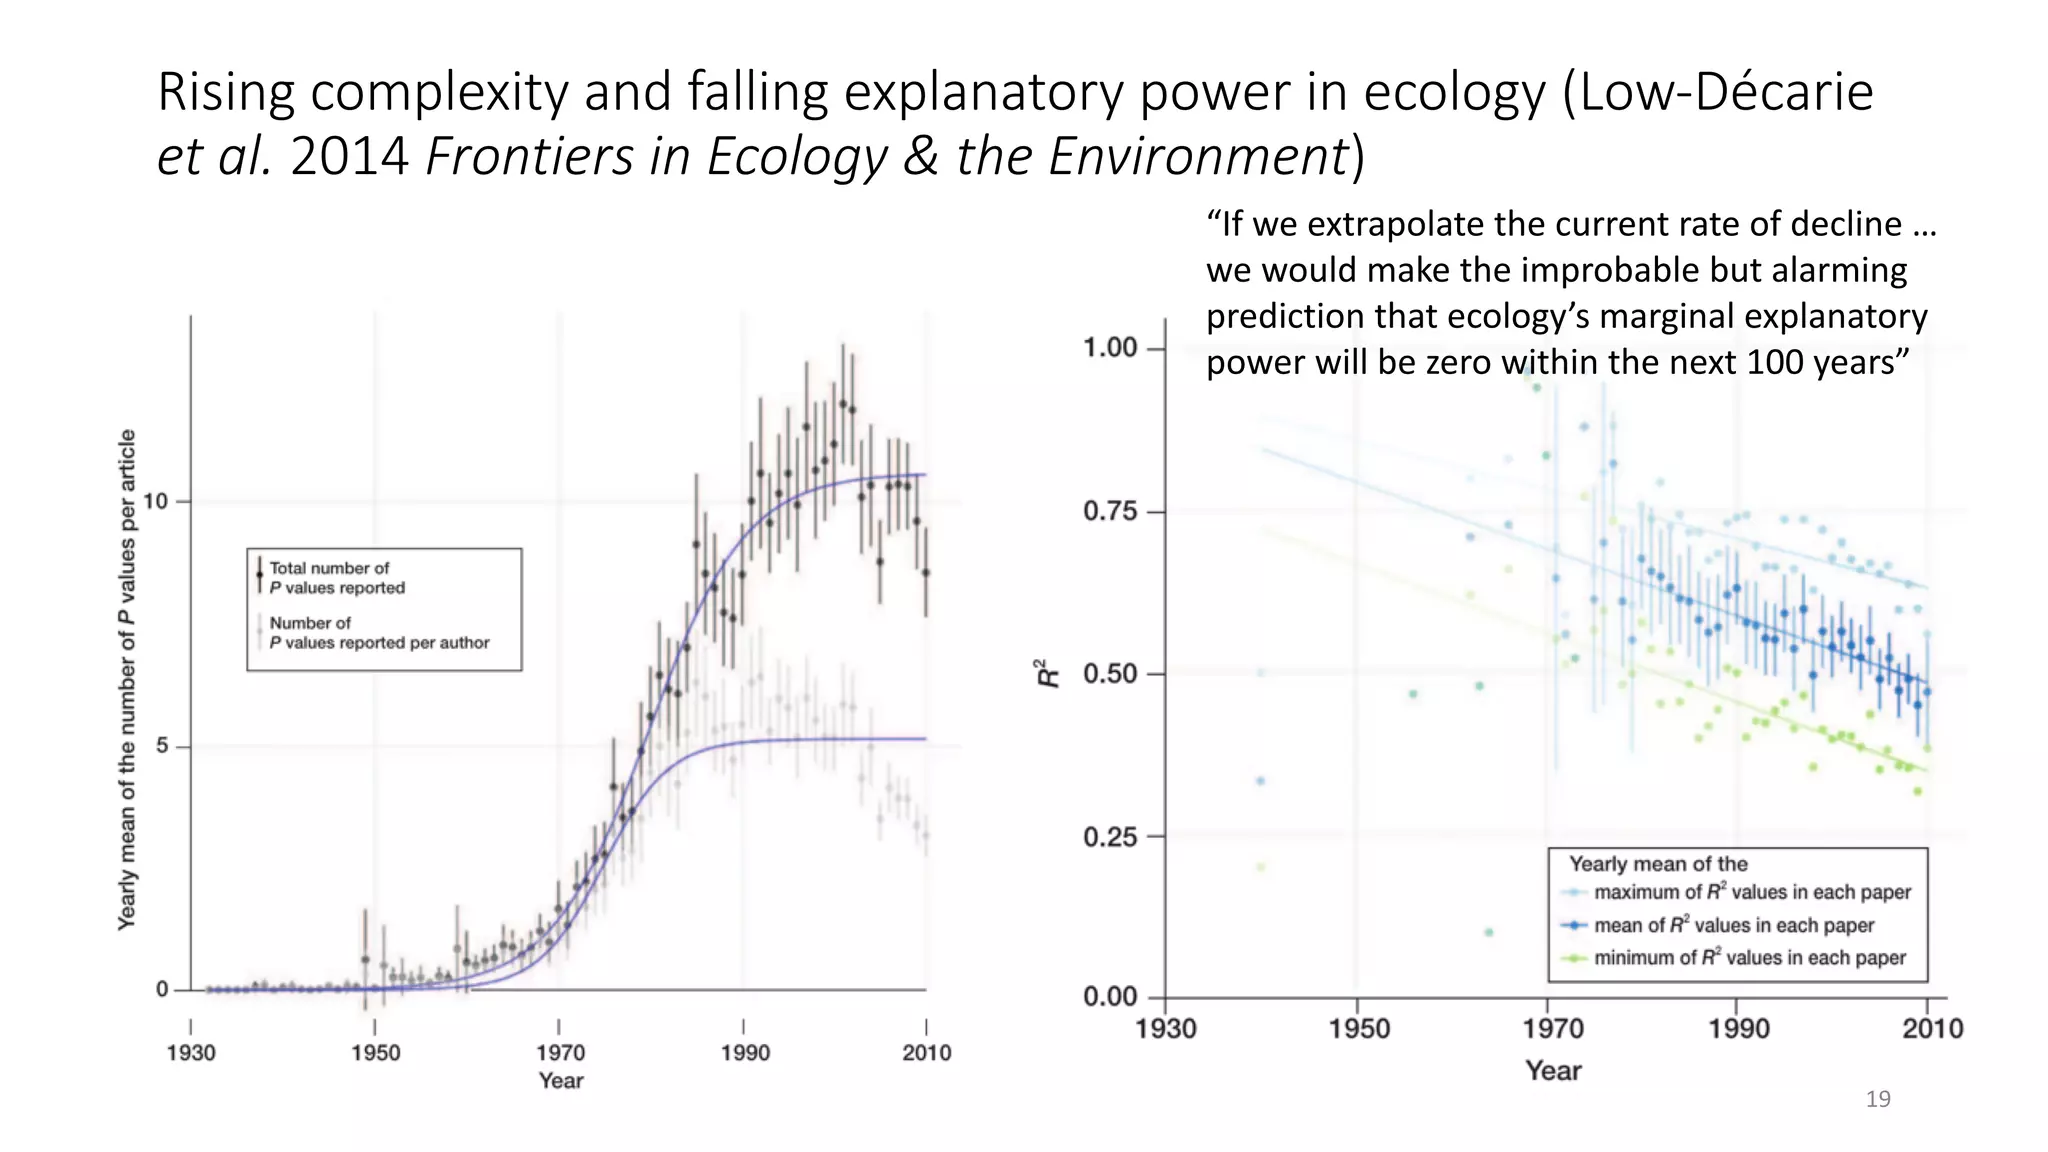
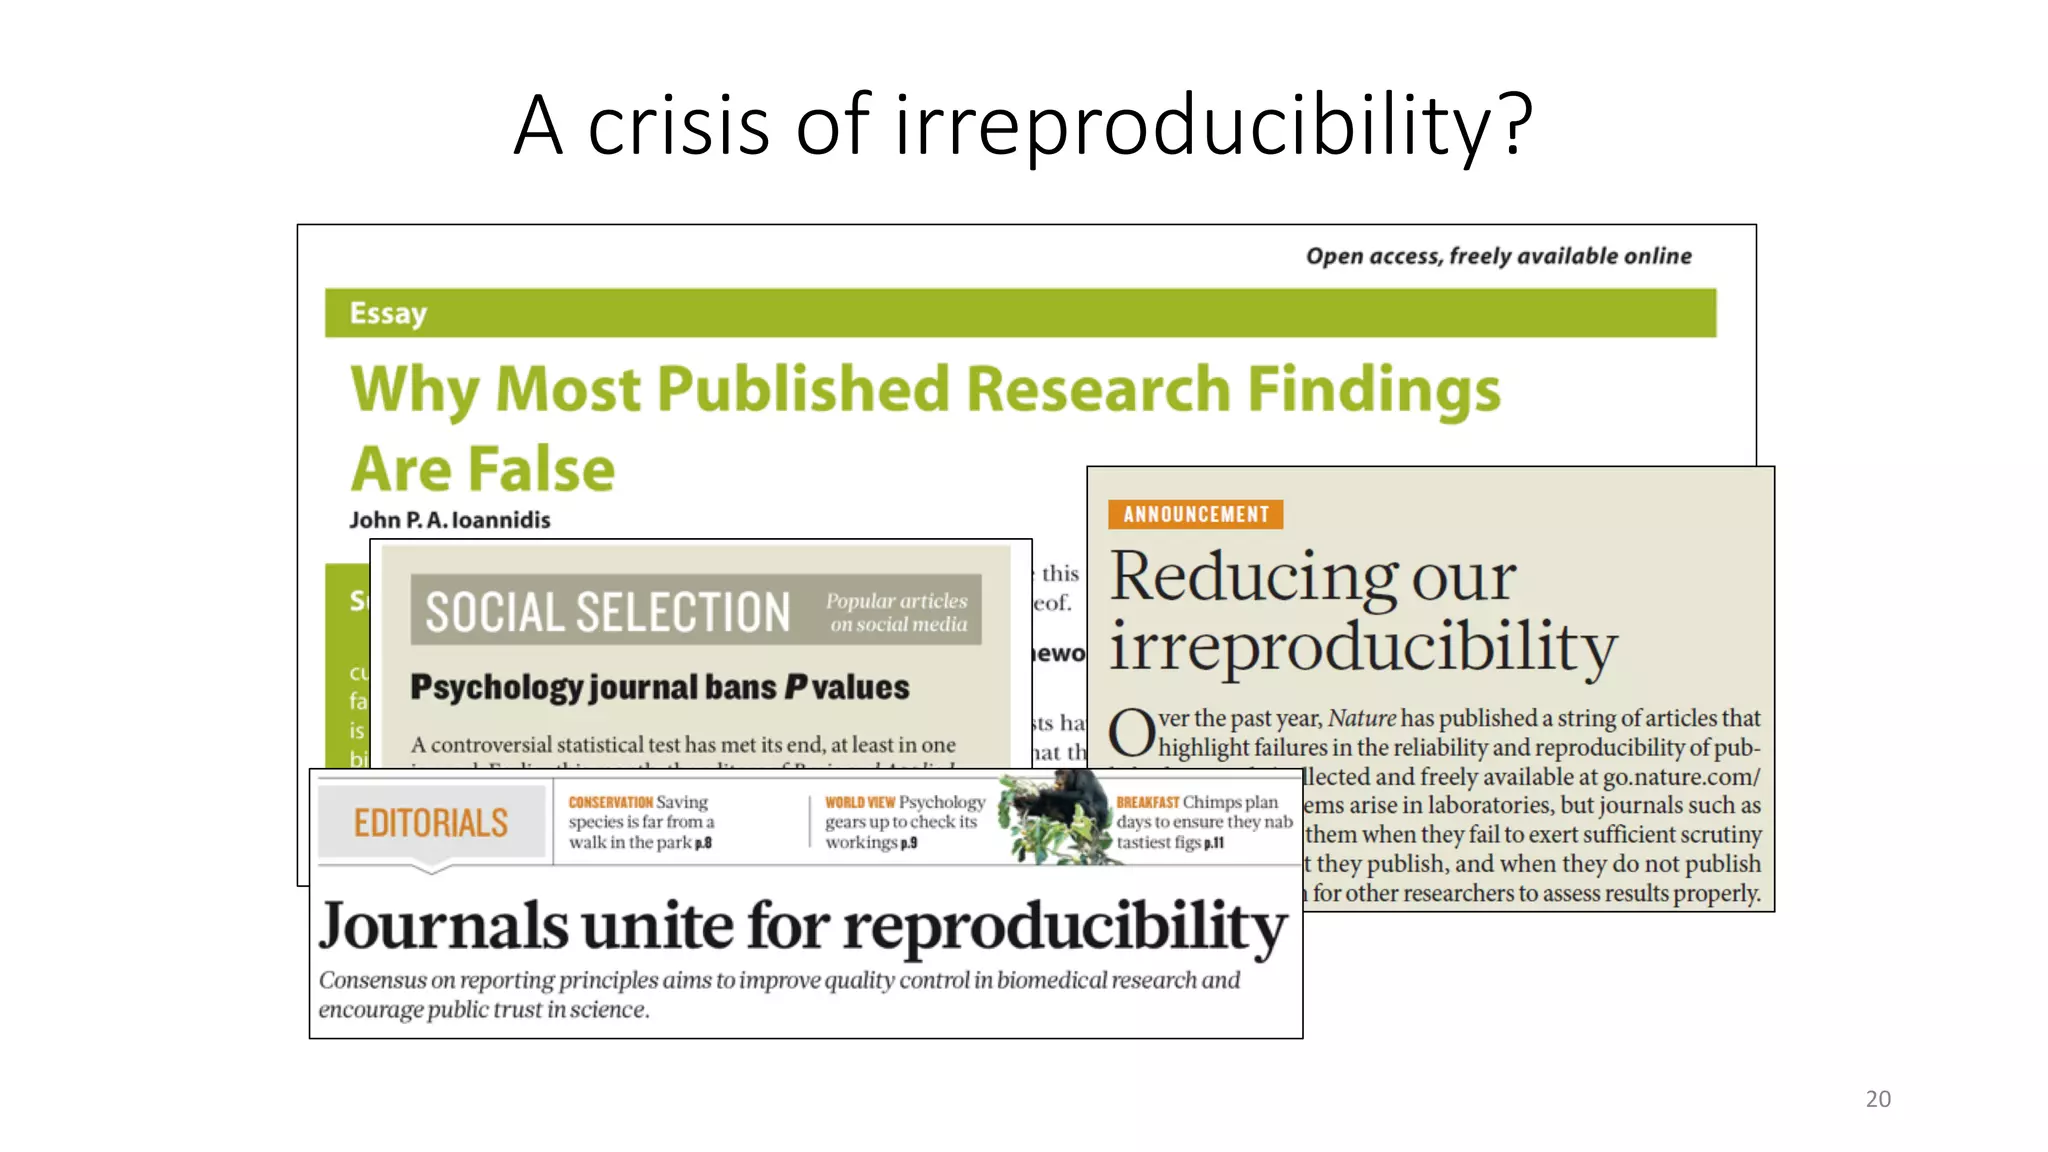
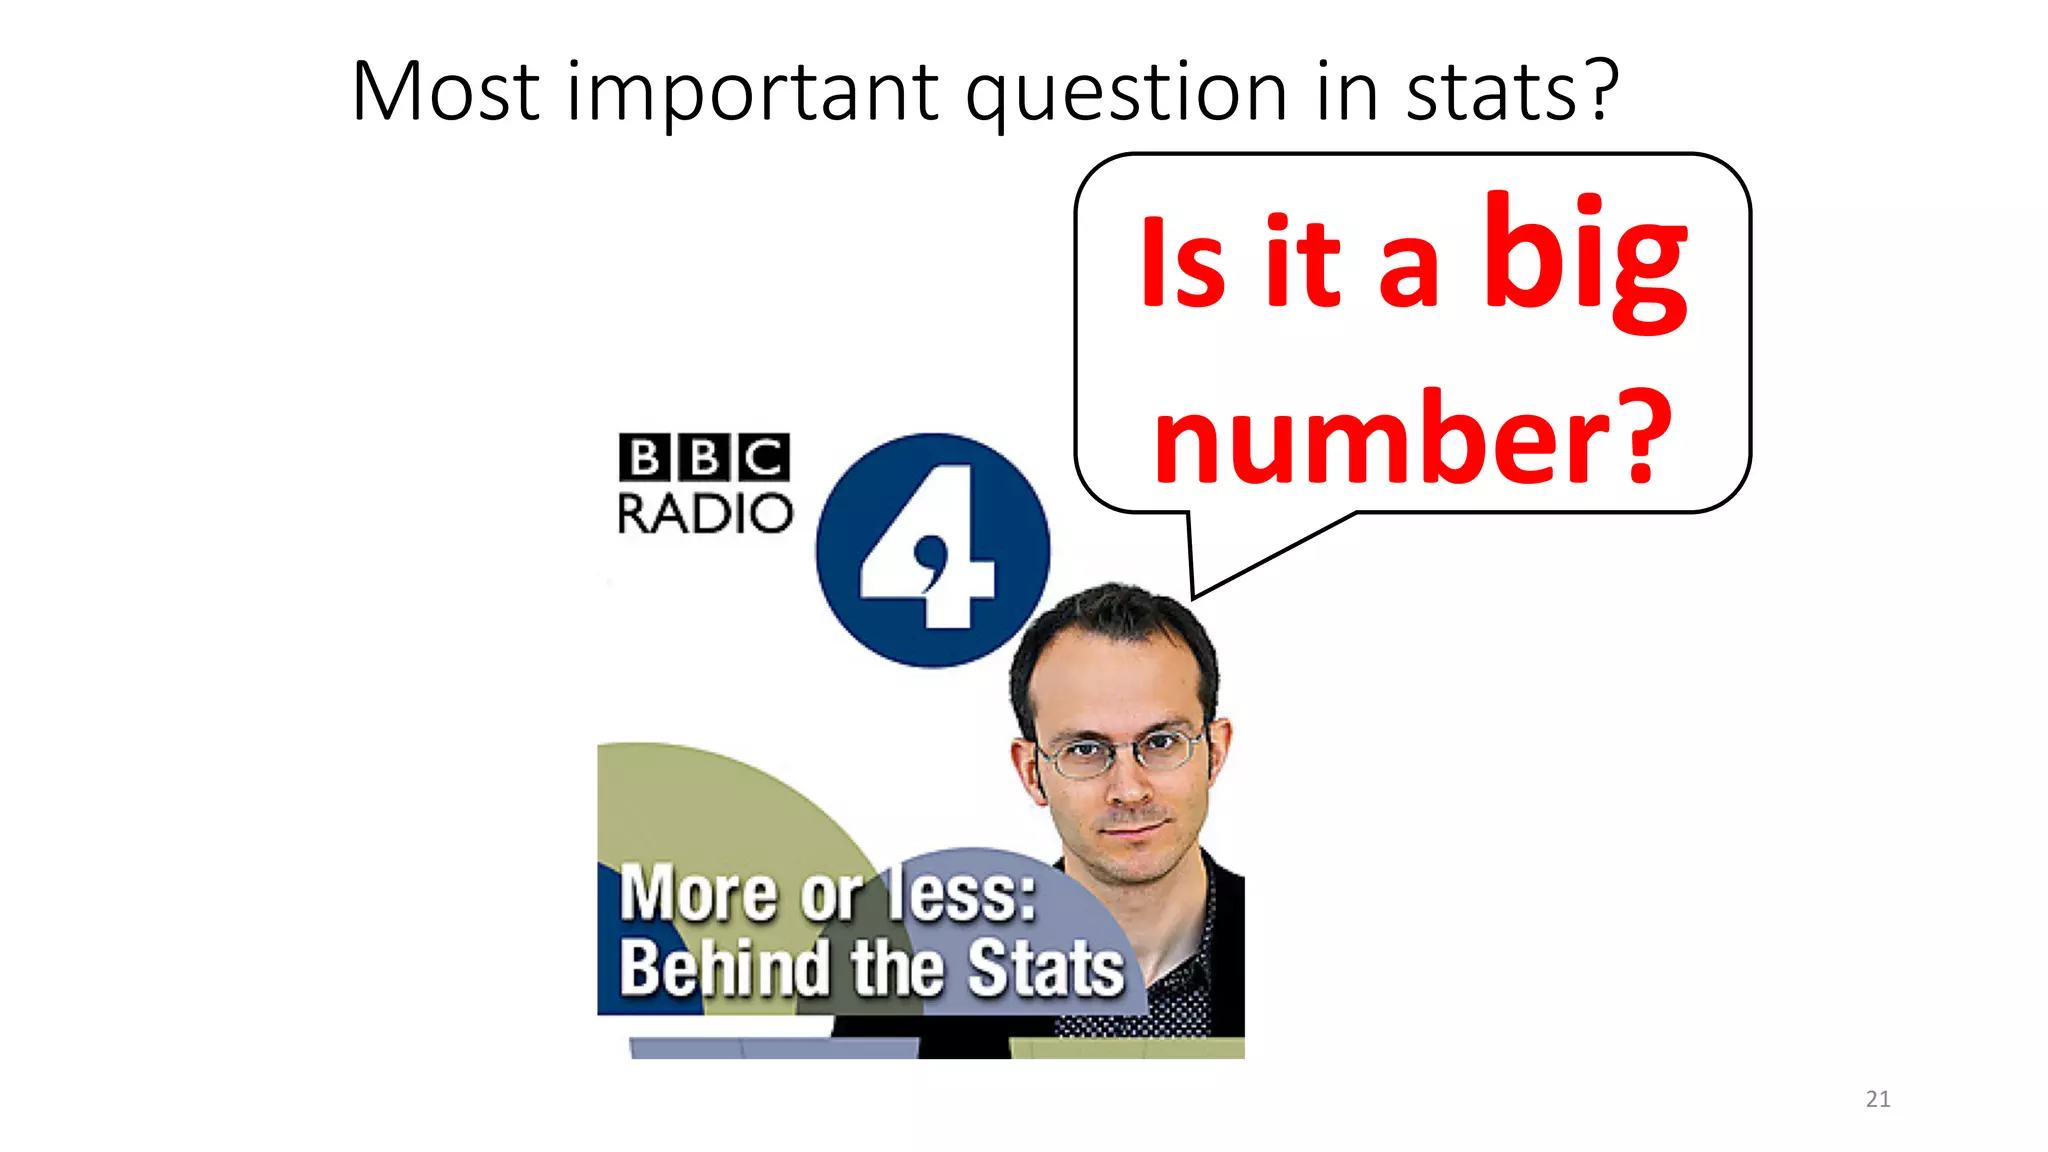
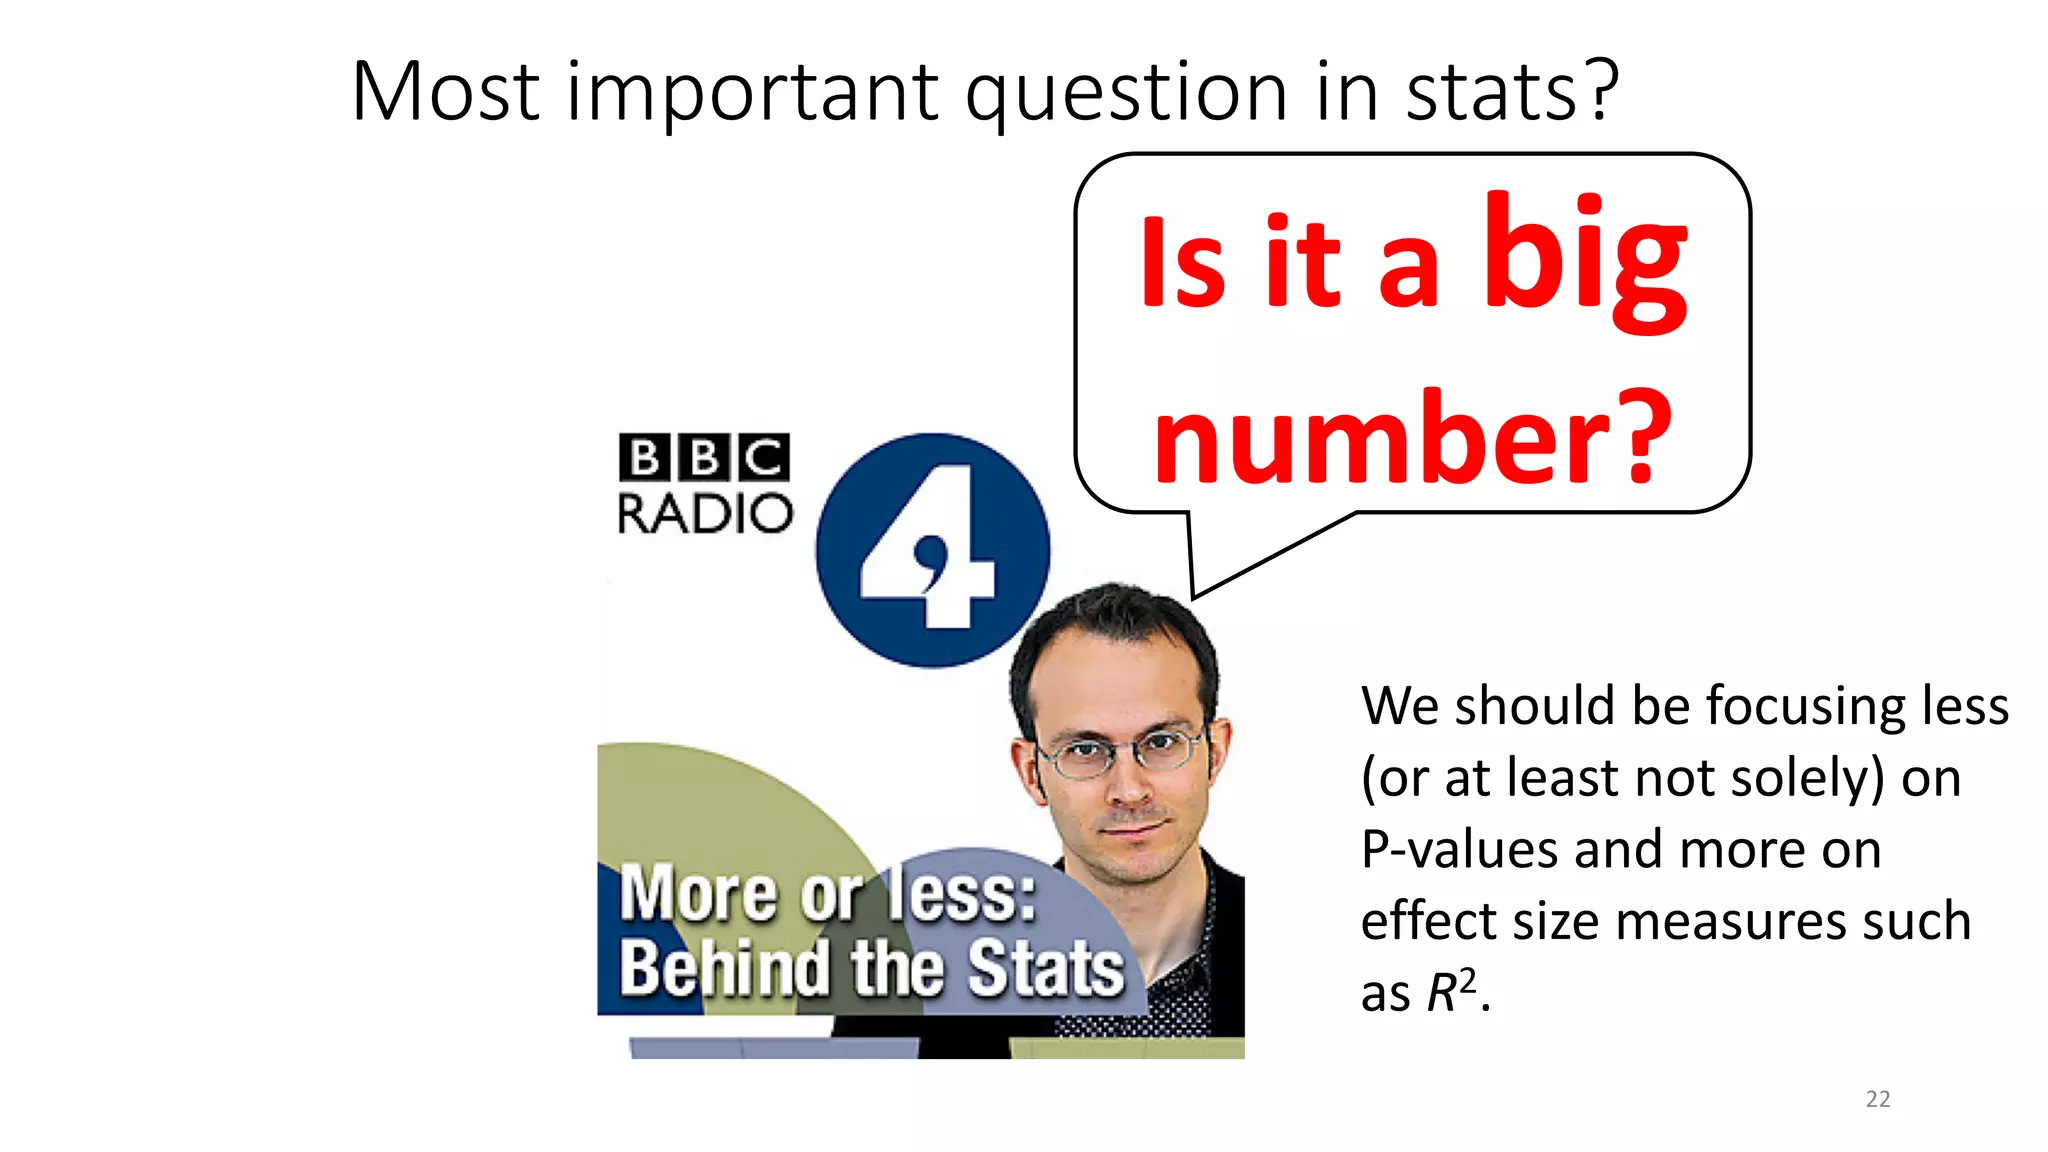
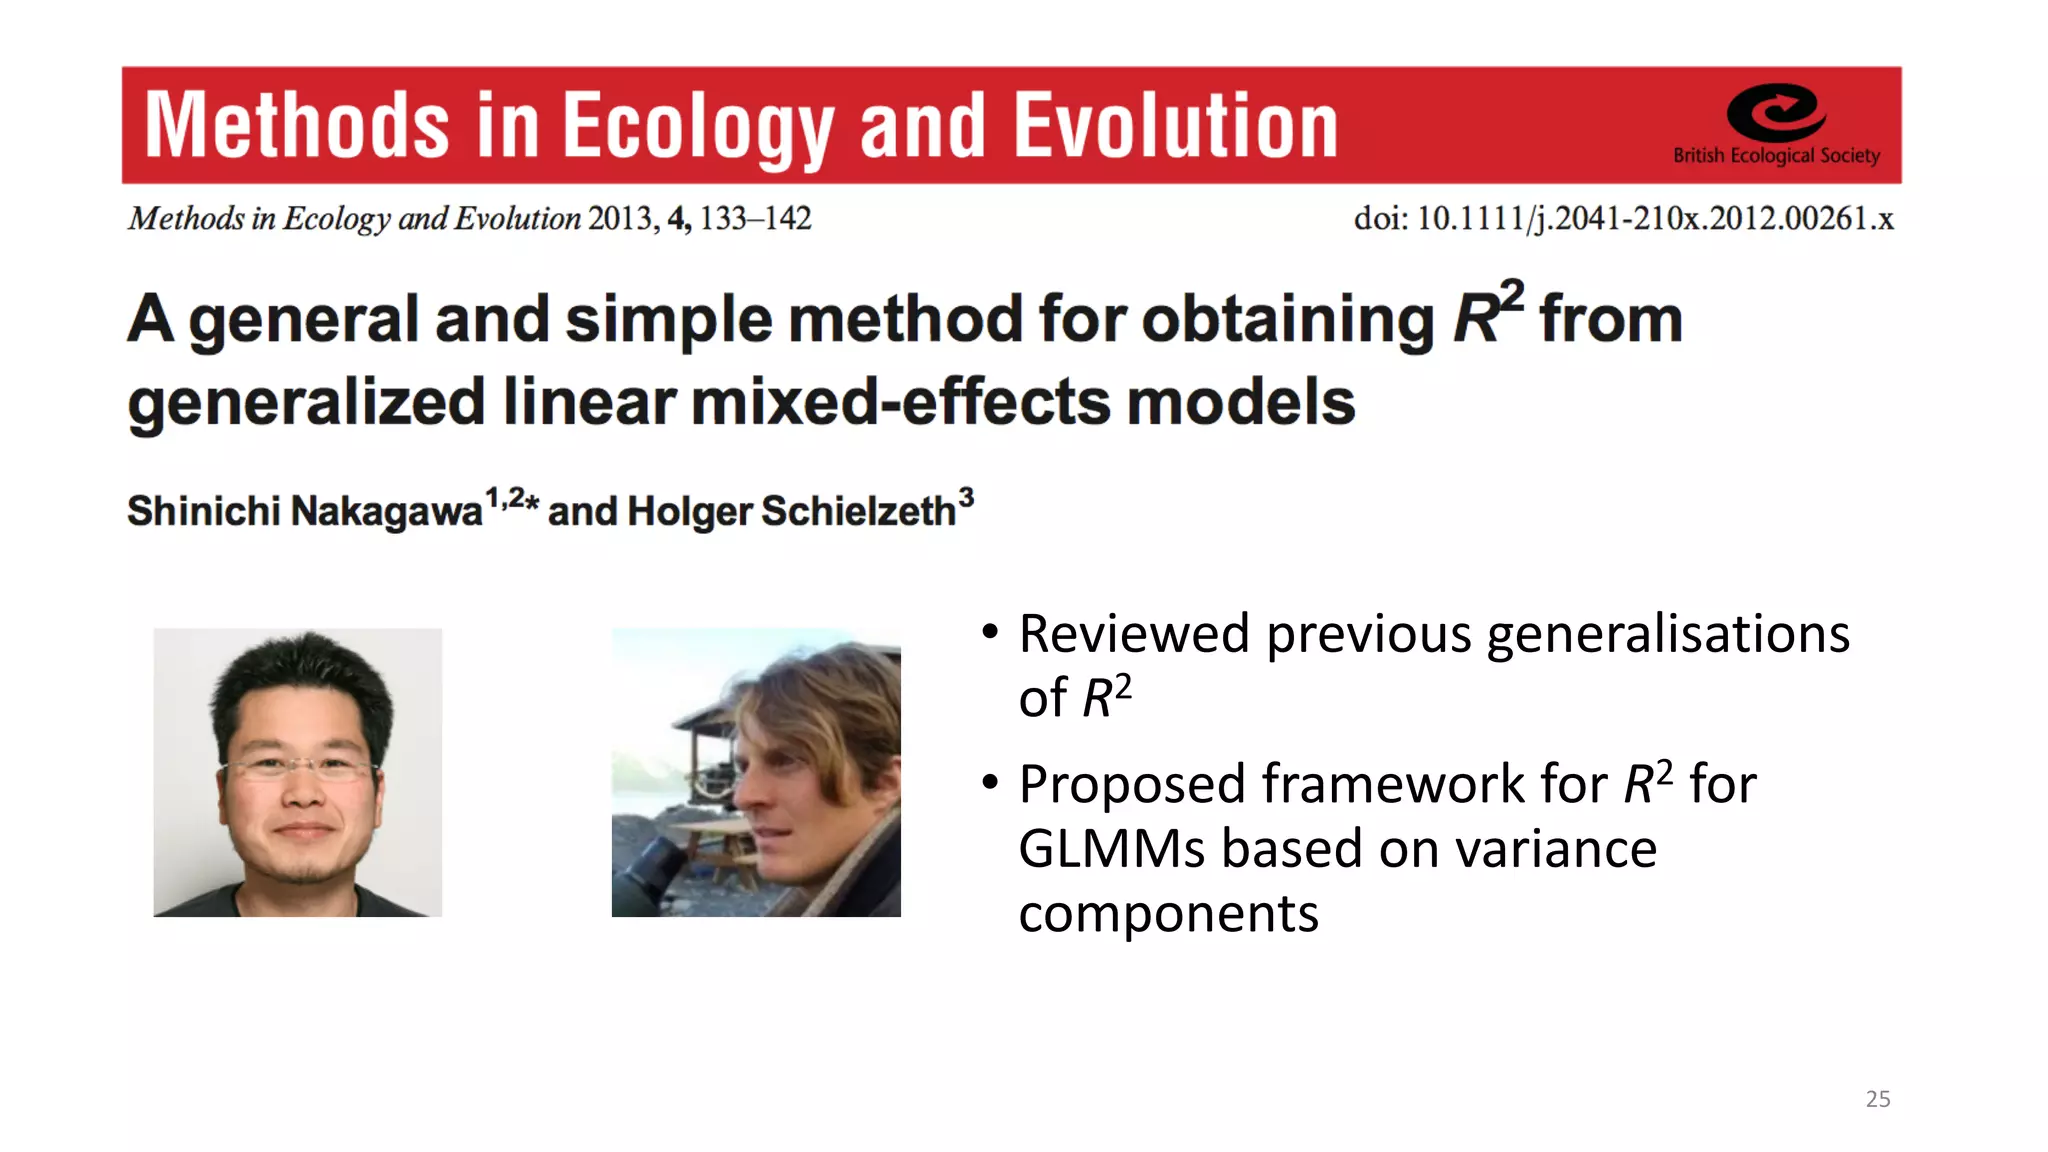
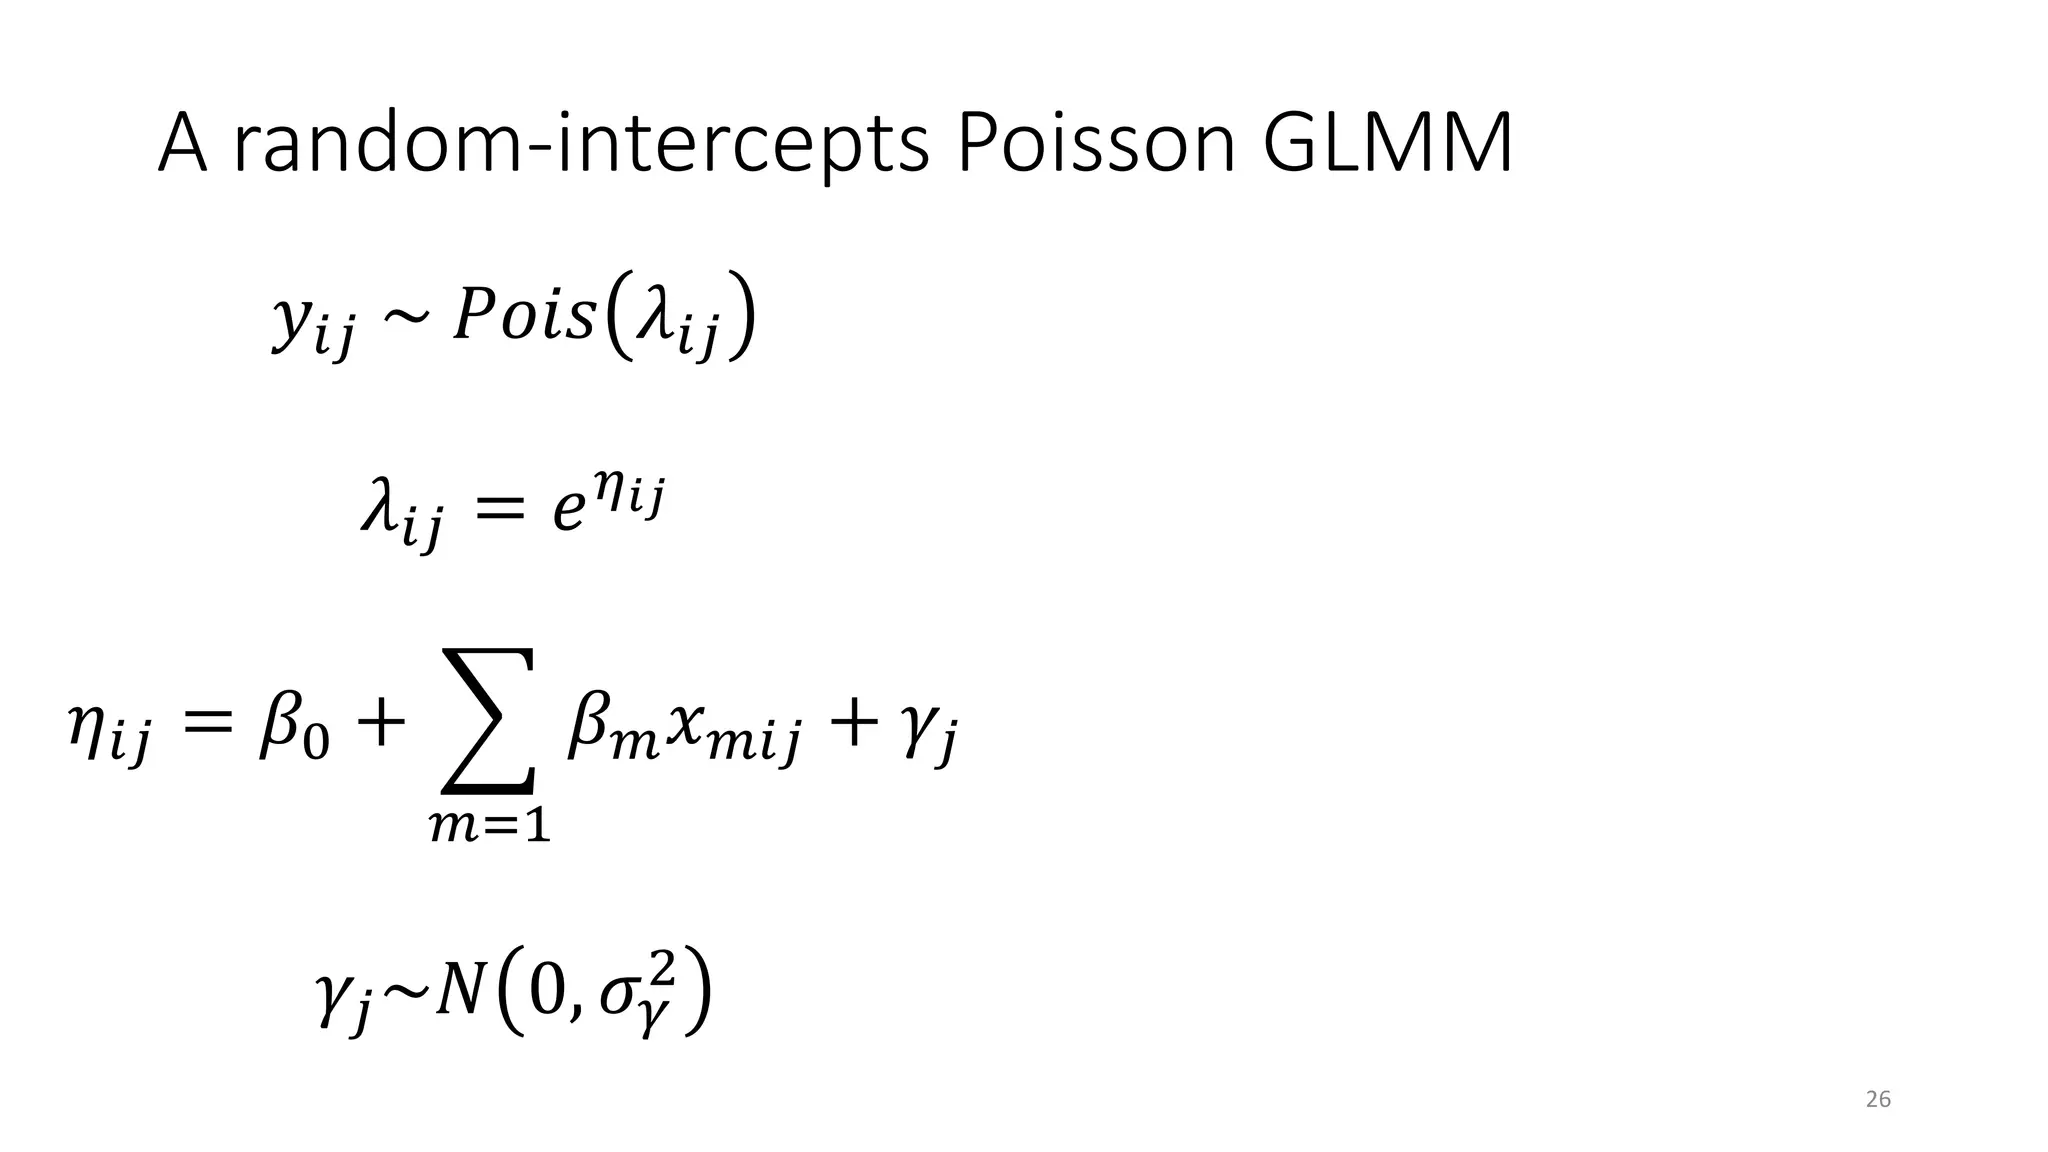
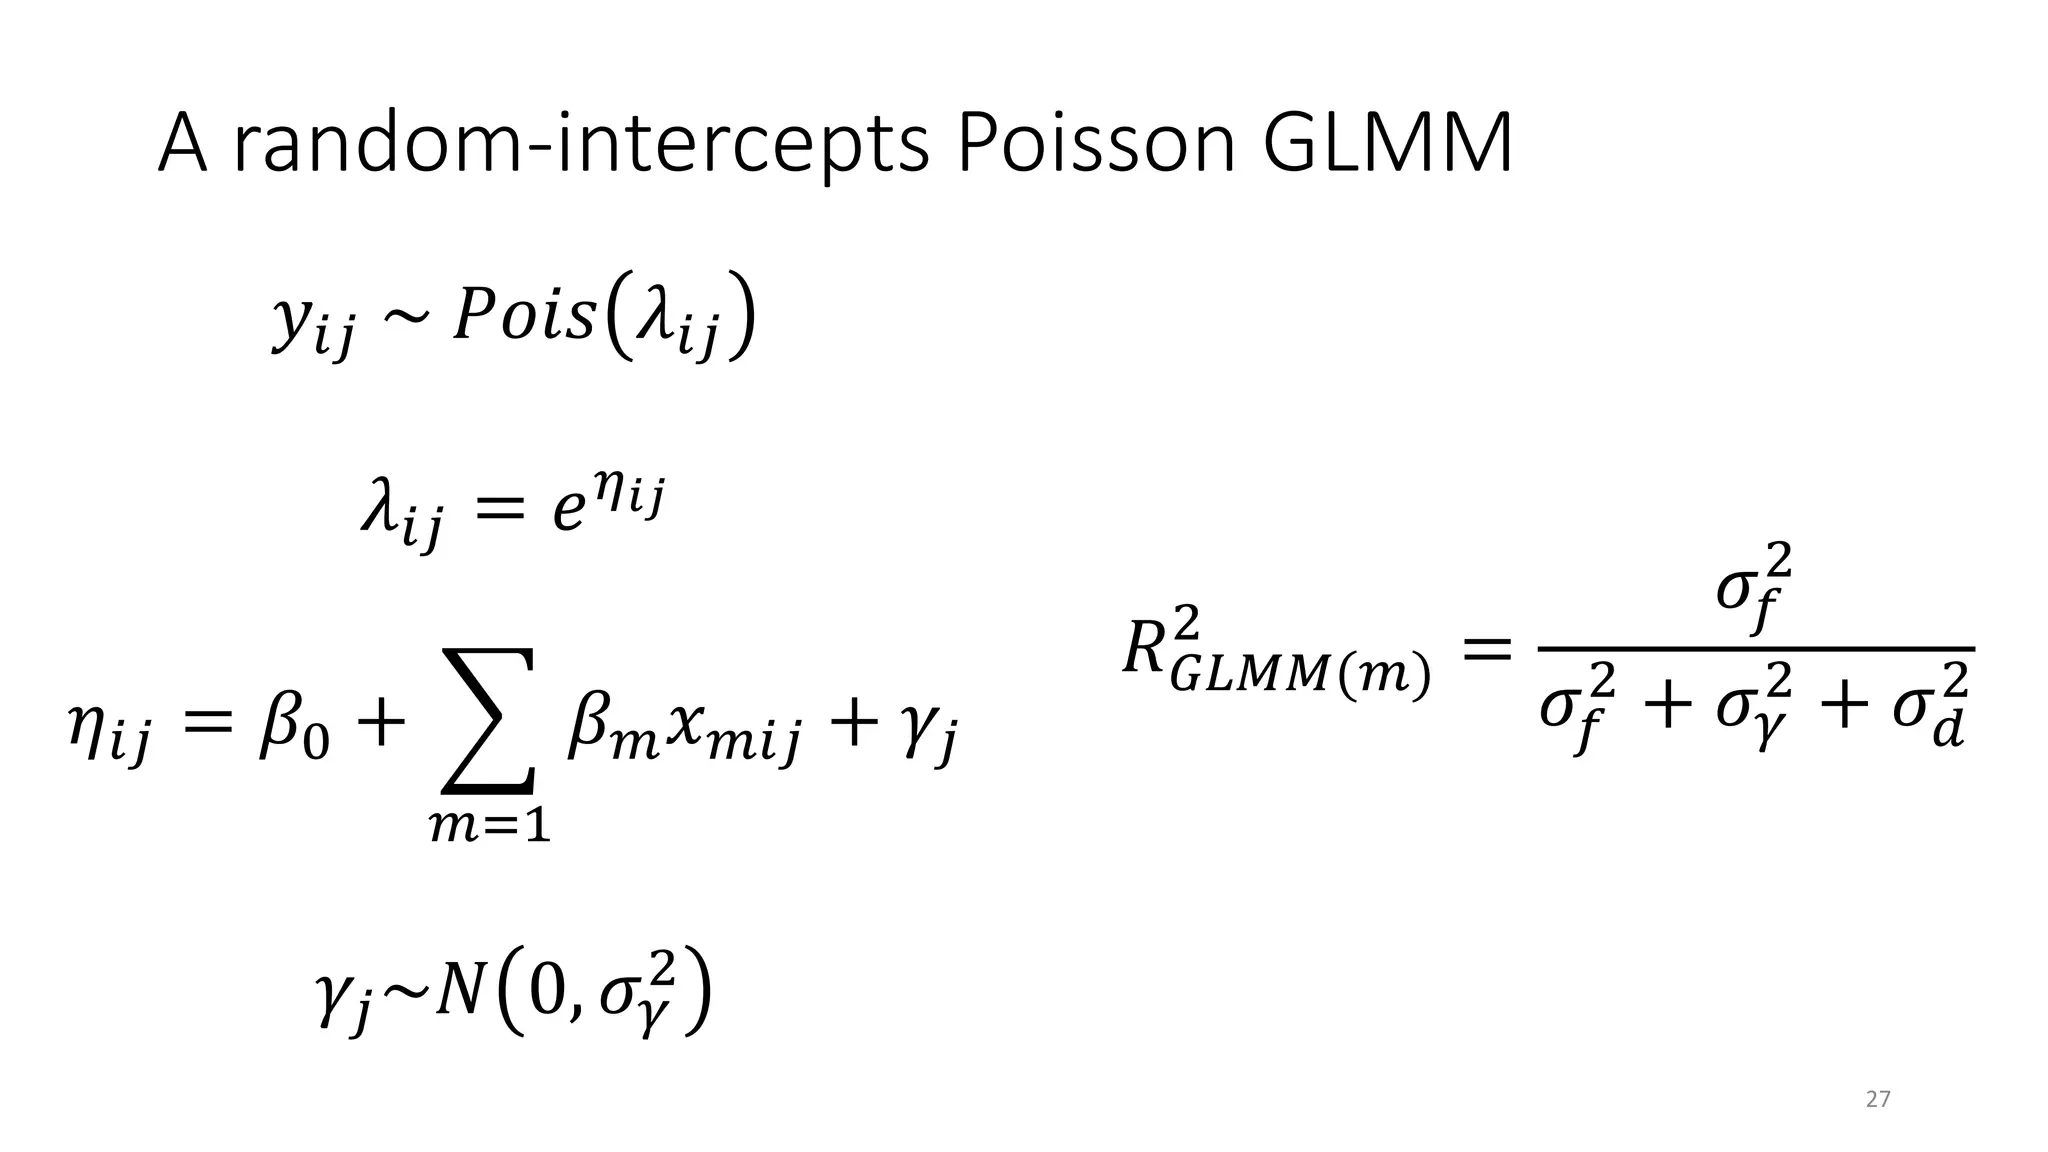
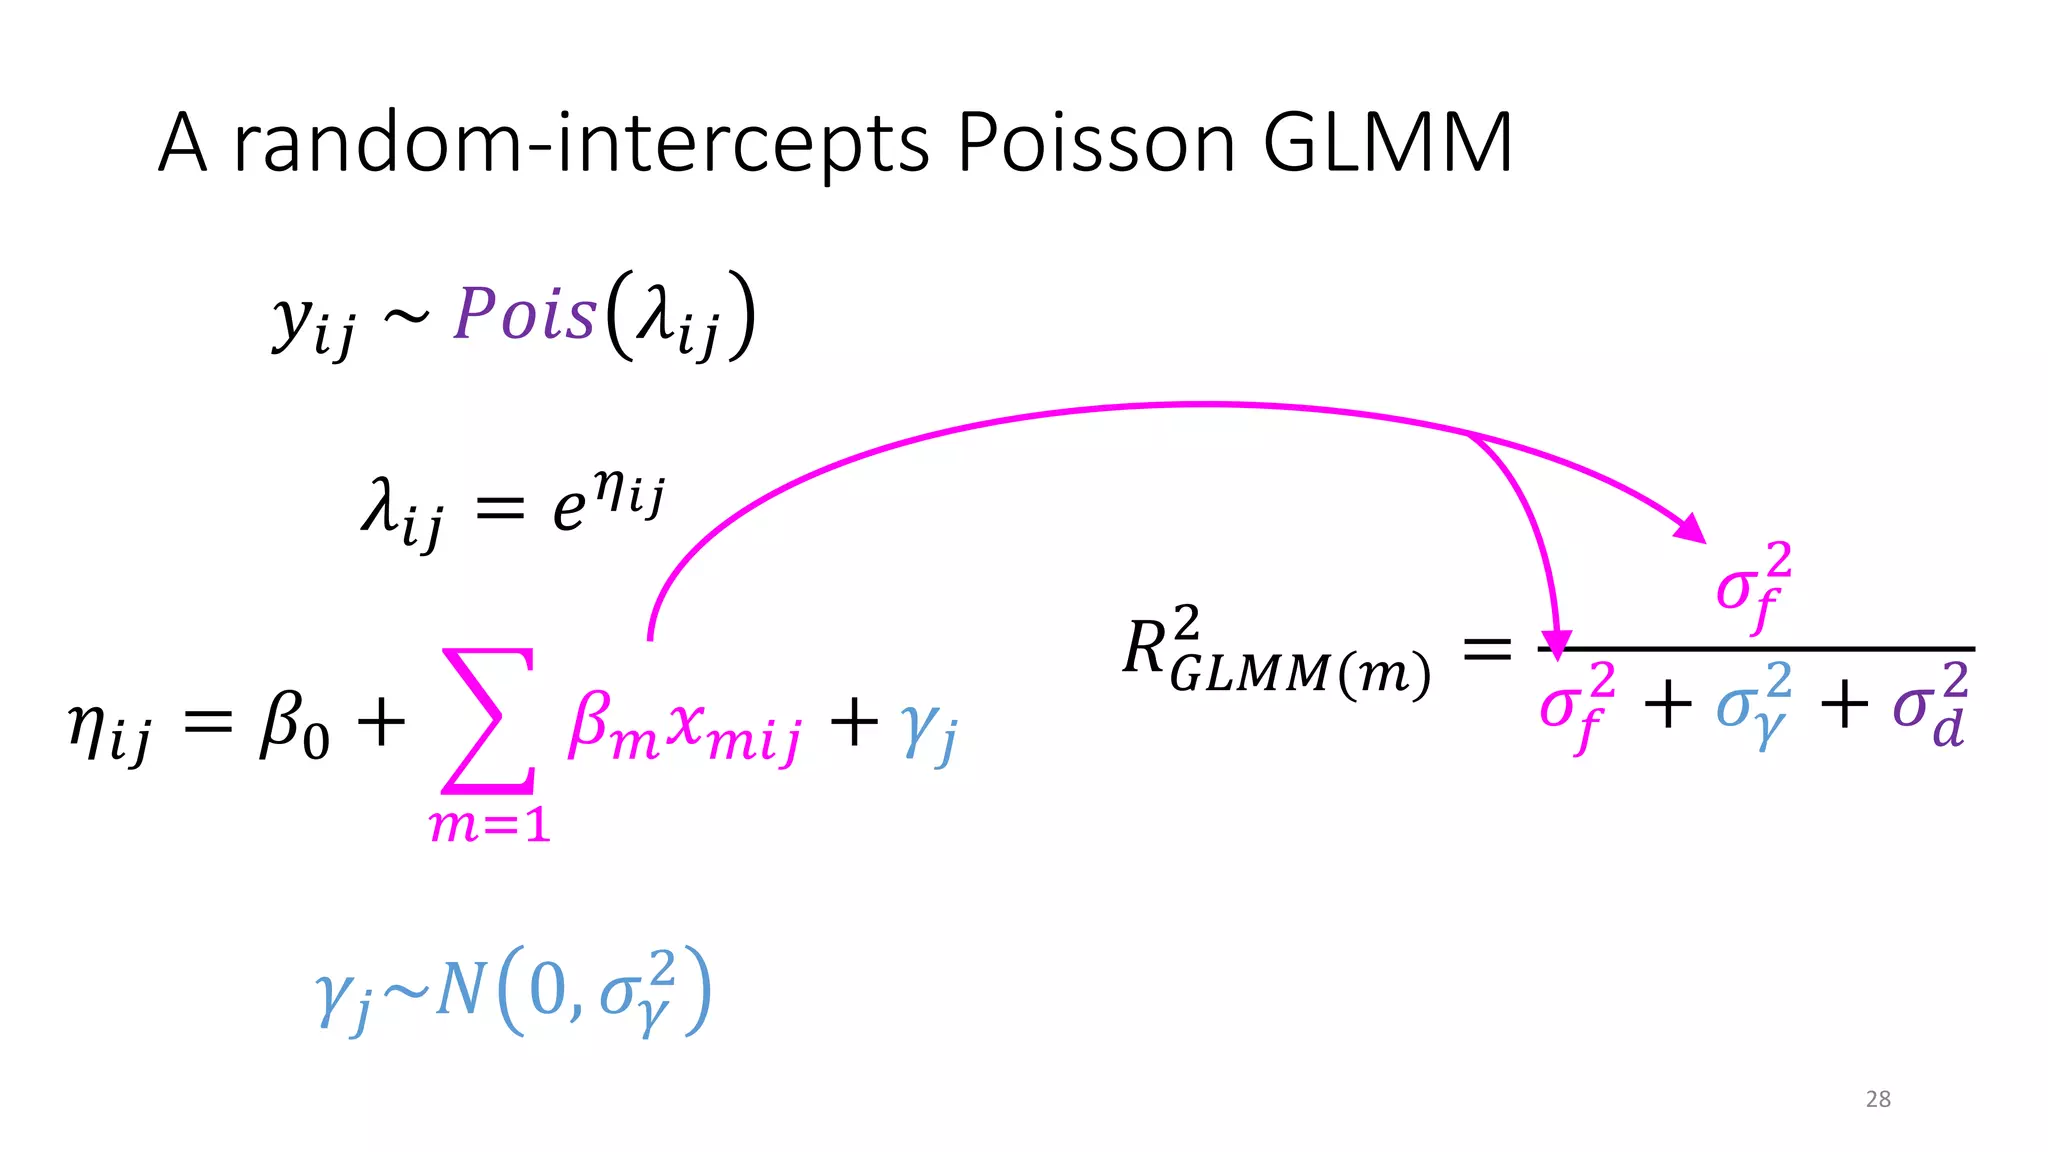
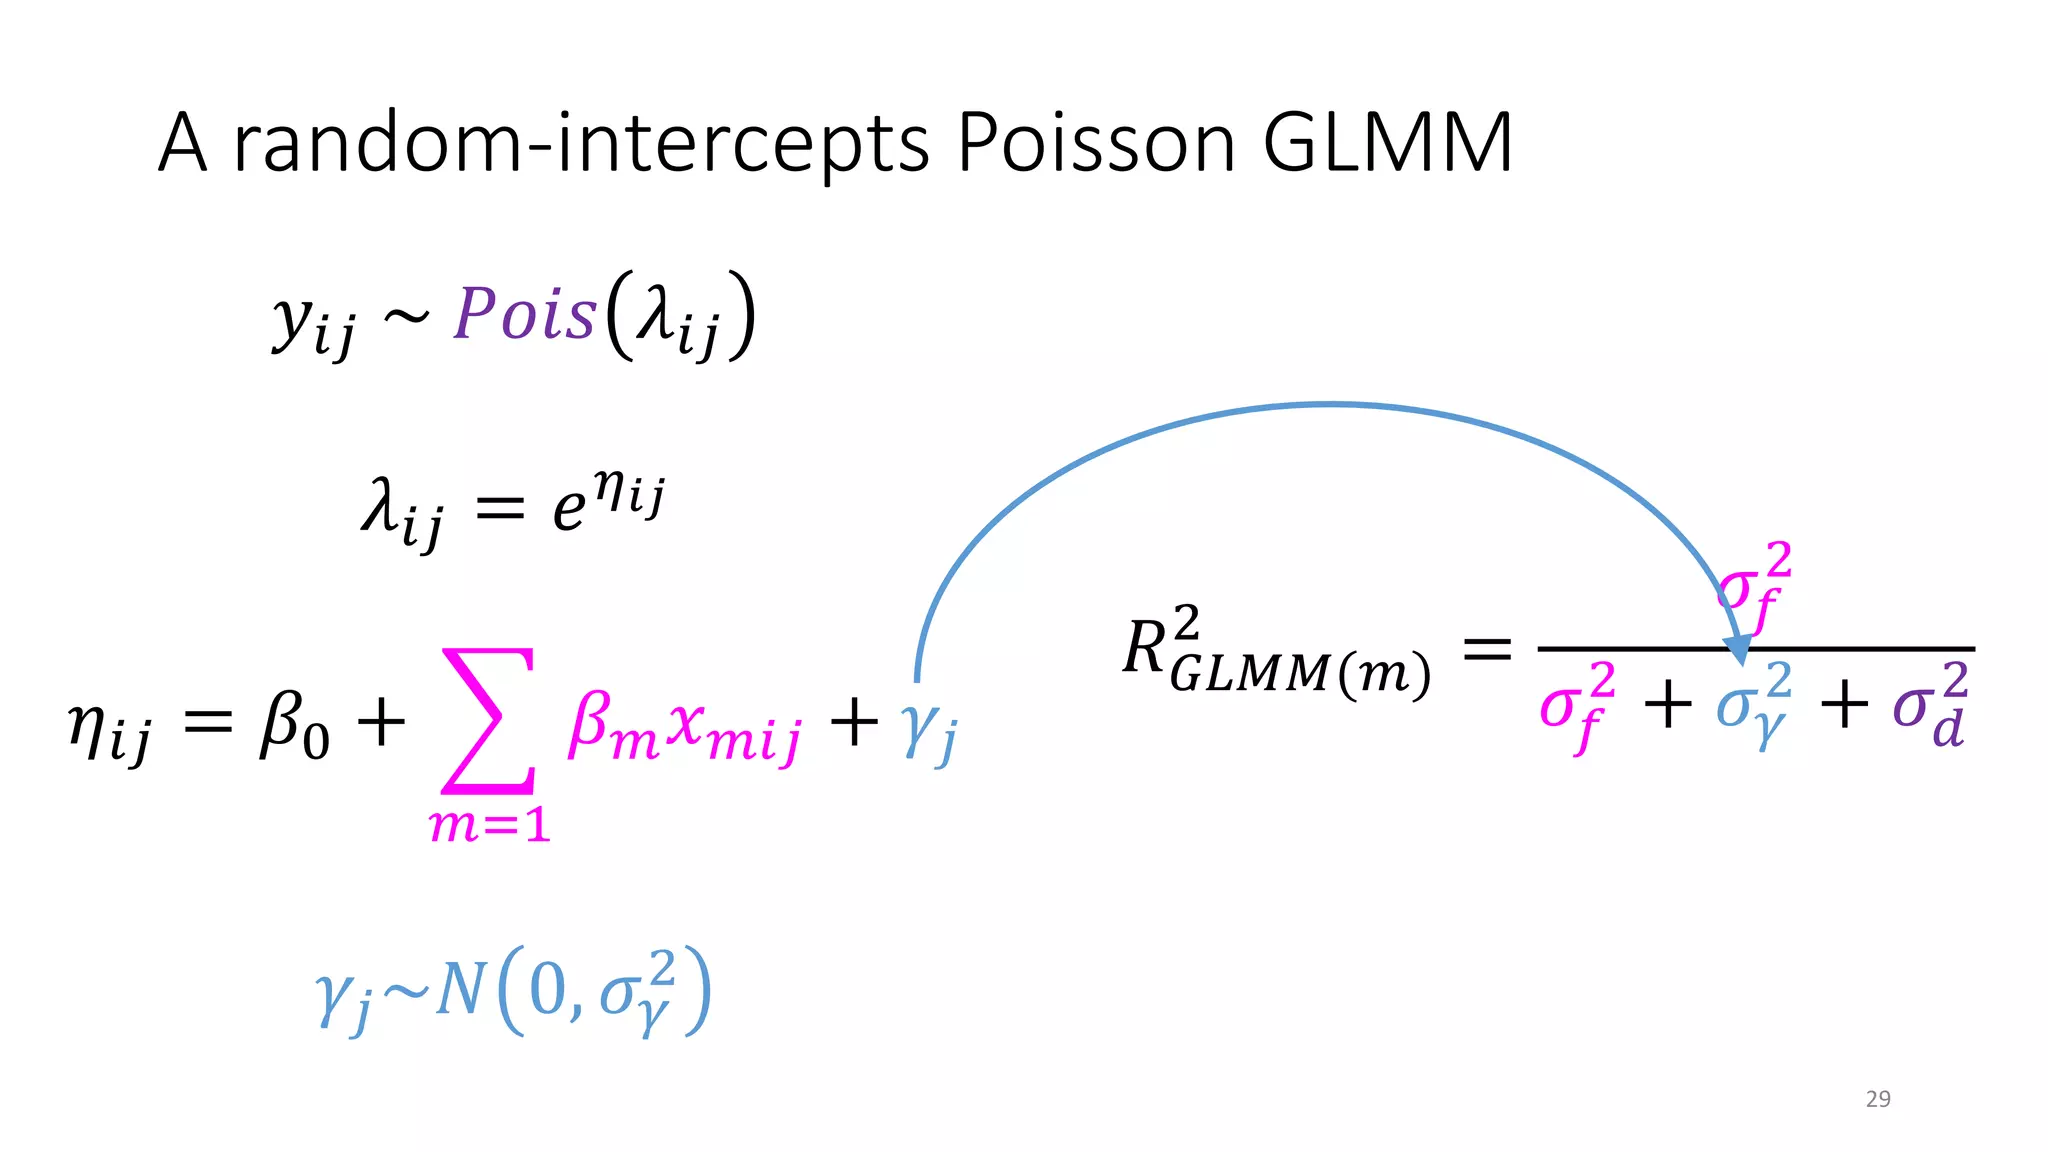
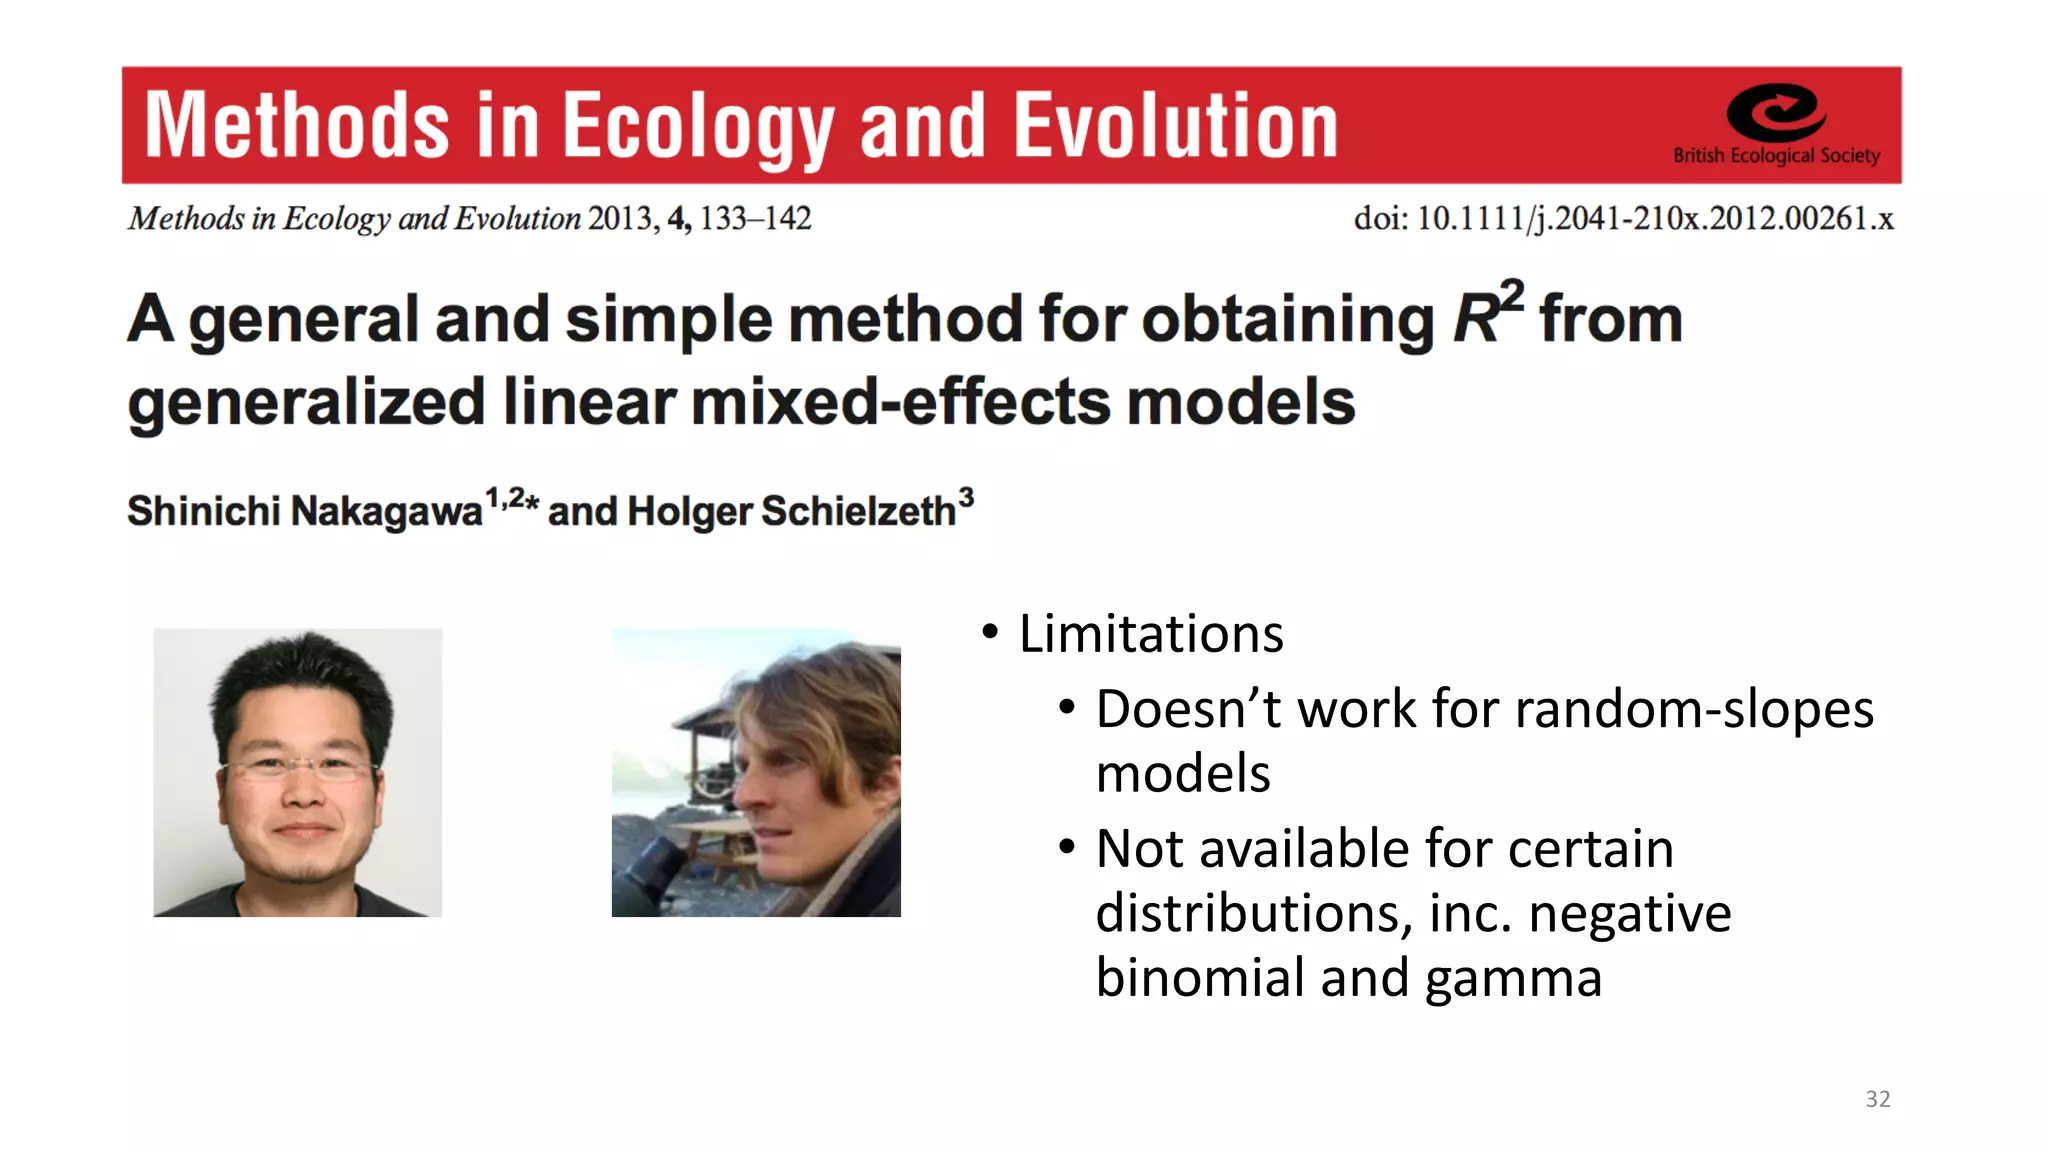
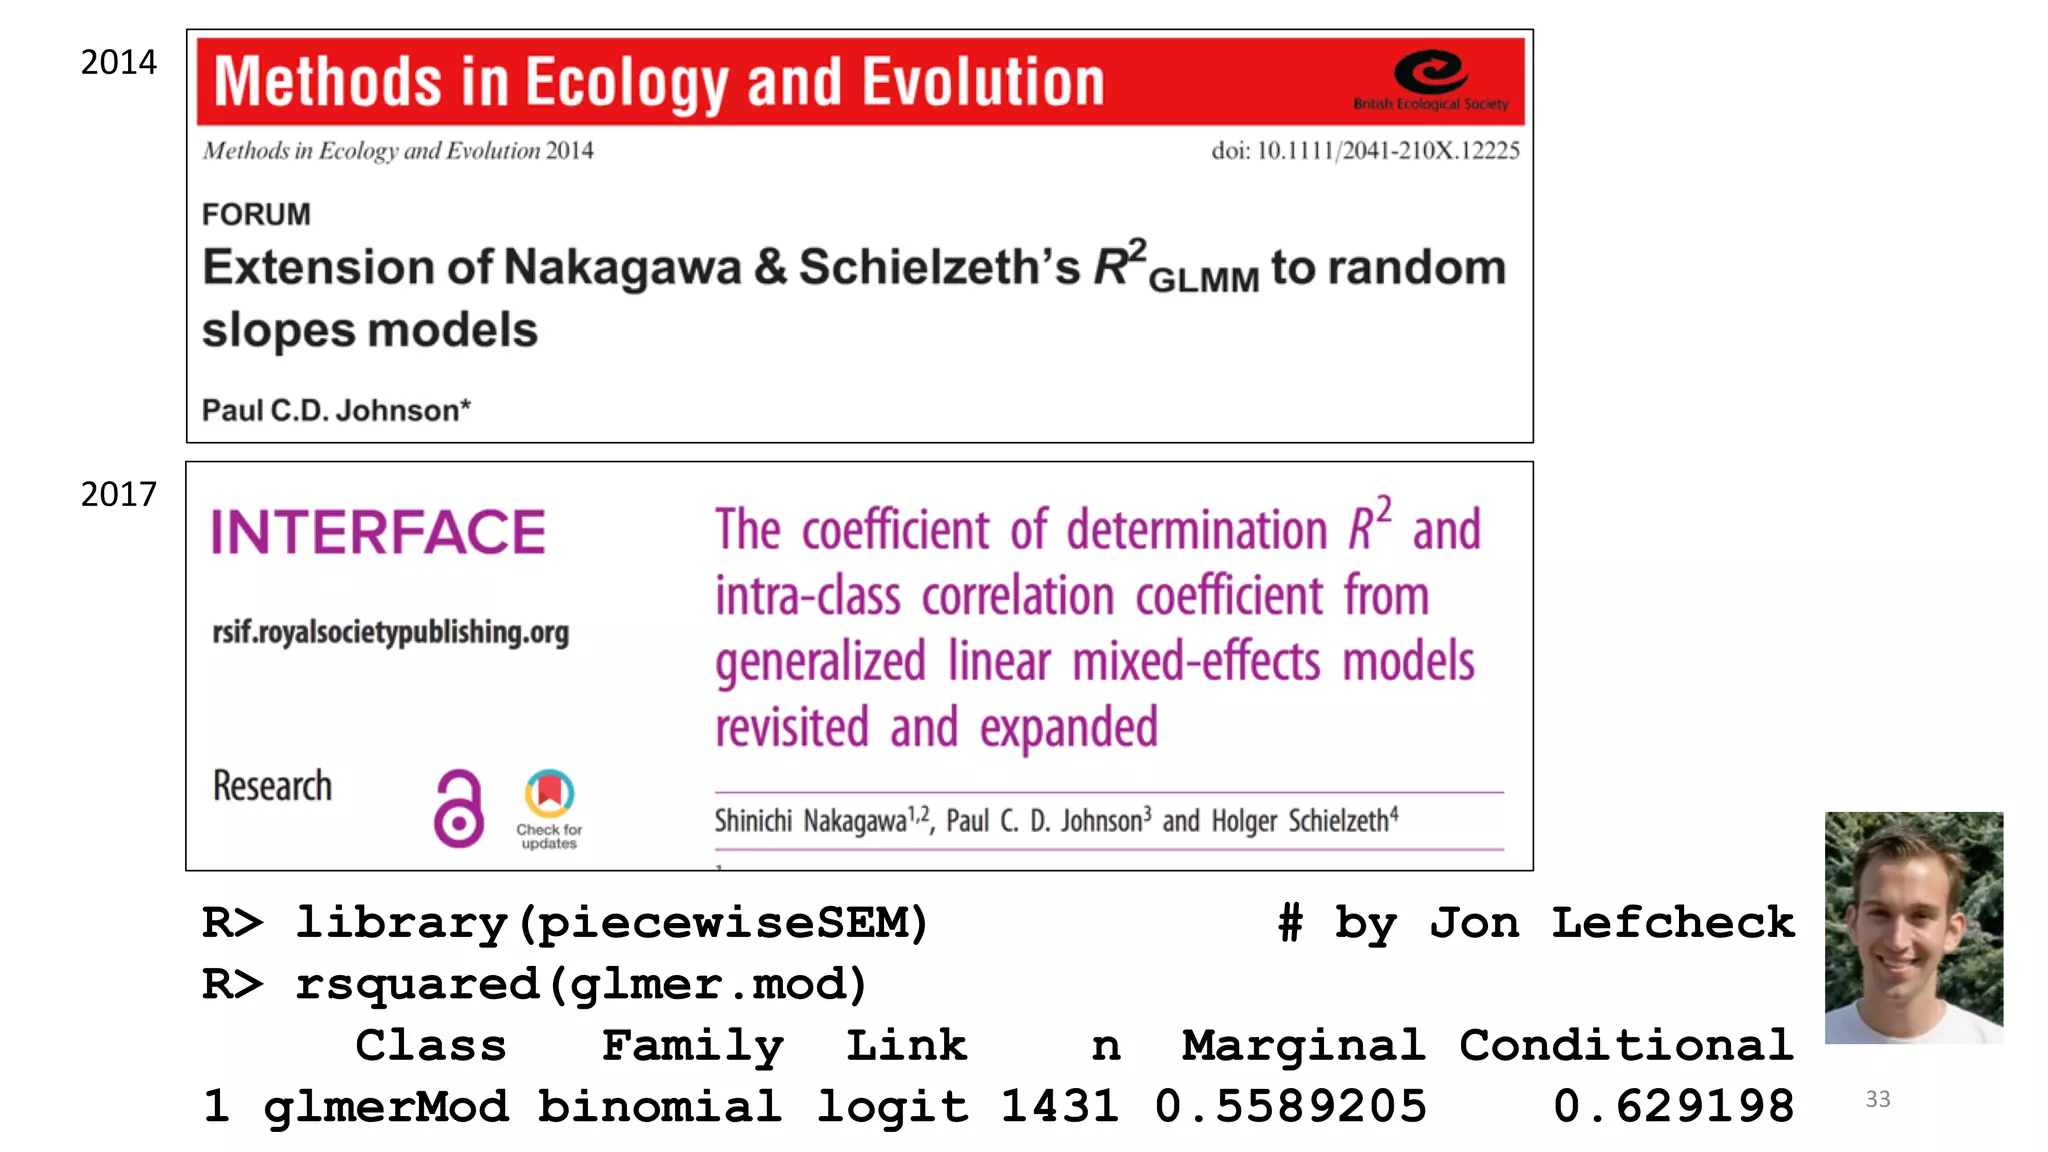
The document discusses the coefficient of determination, R², explaining its significance in assessing the goodness-of-fit of linear regression models, its limitations, and improvements in its application. It highlights the need for a focus on effect size measures over p-values and introduces frameworks for generalizing R² in generalized linear models and mixed-effects models. Overall, it emphasizes the importance of understanding R²'s limitations in predictive modeling and its adaptation for more complex statistical frameworks.
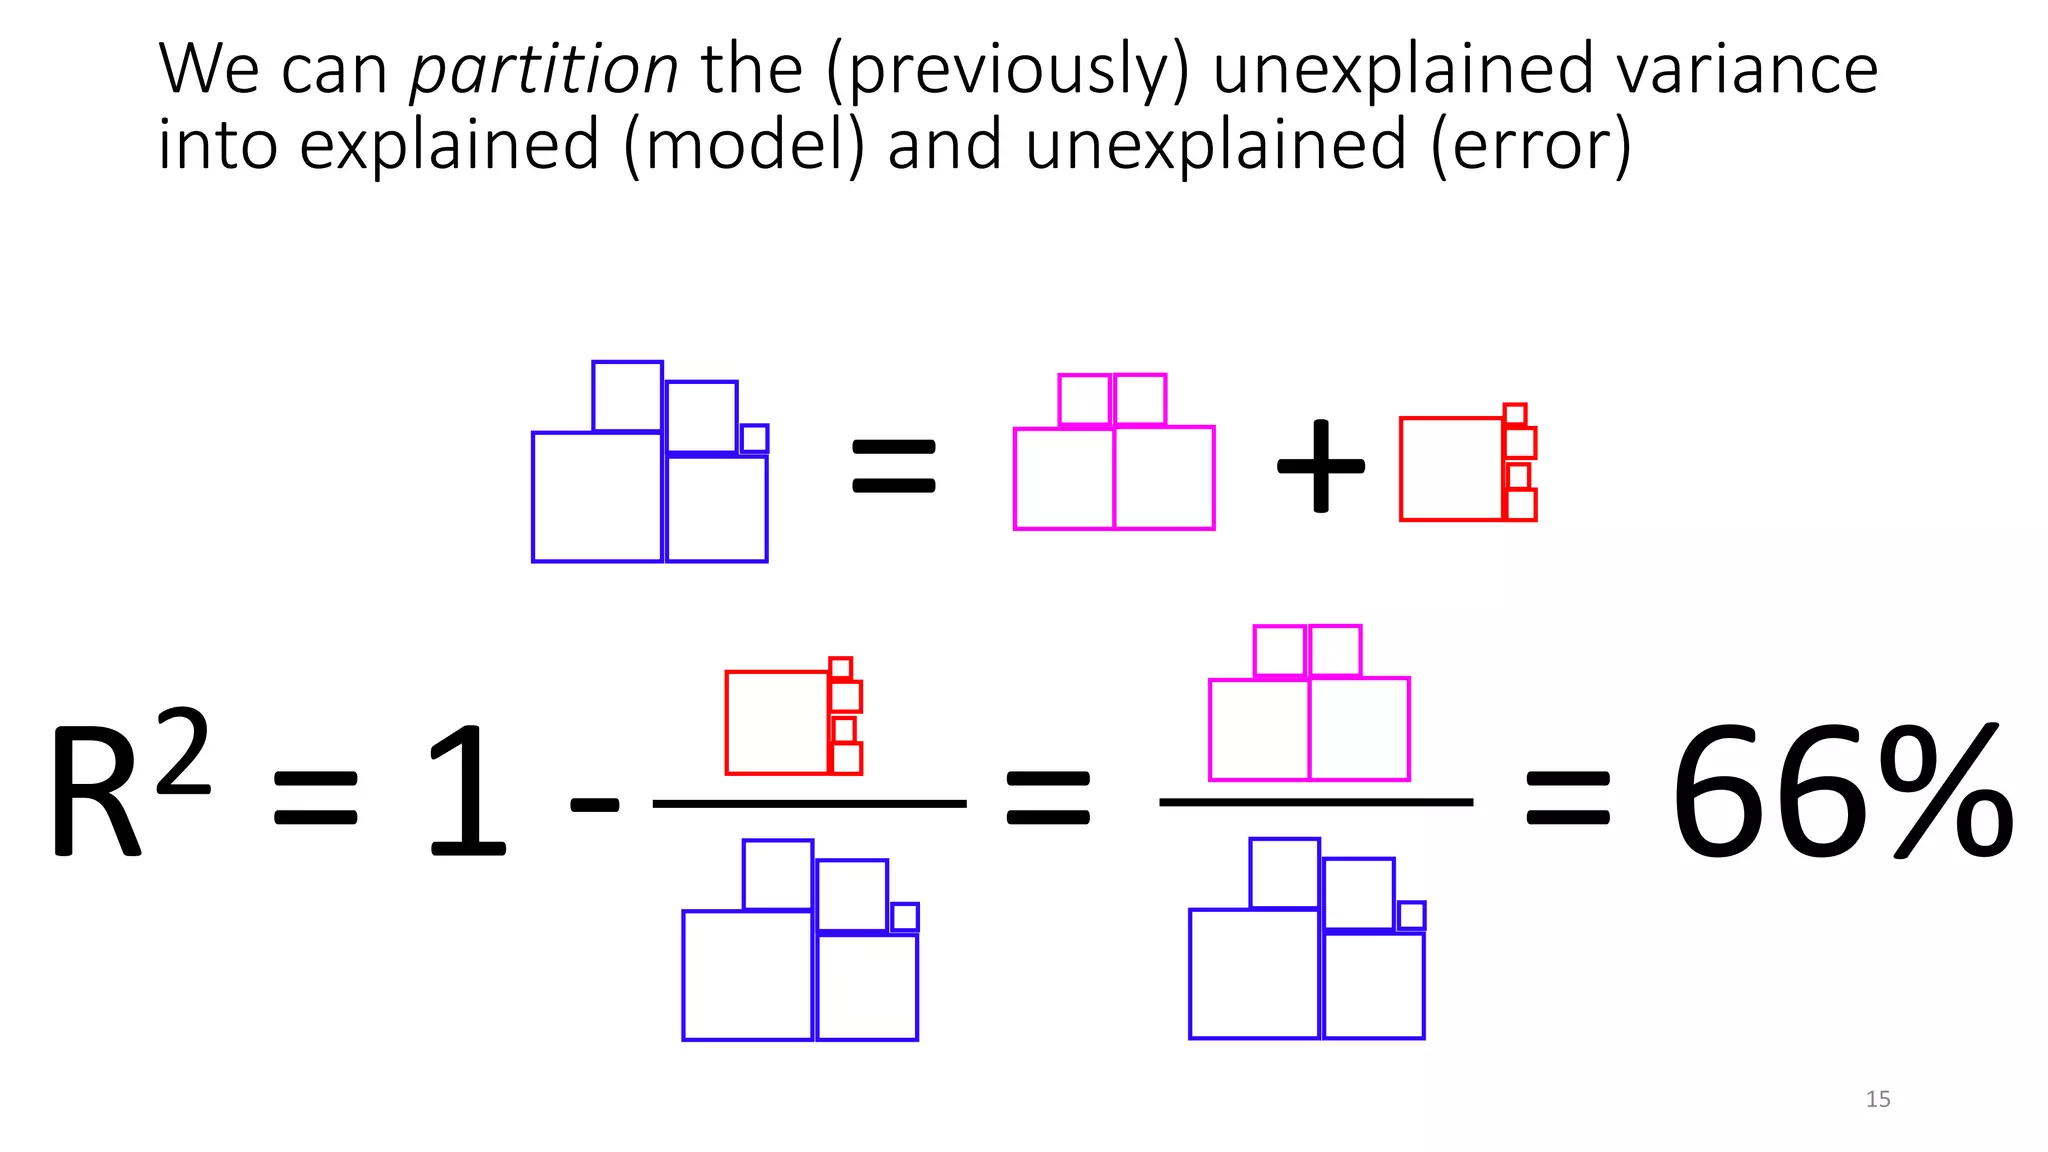
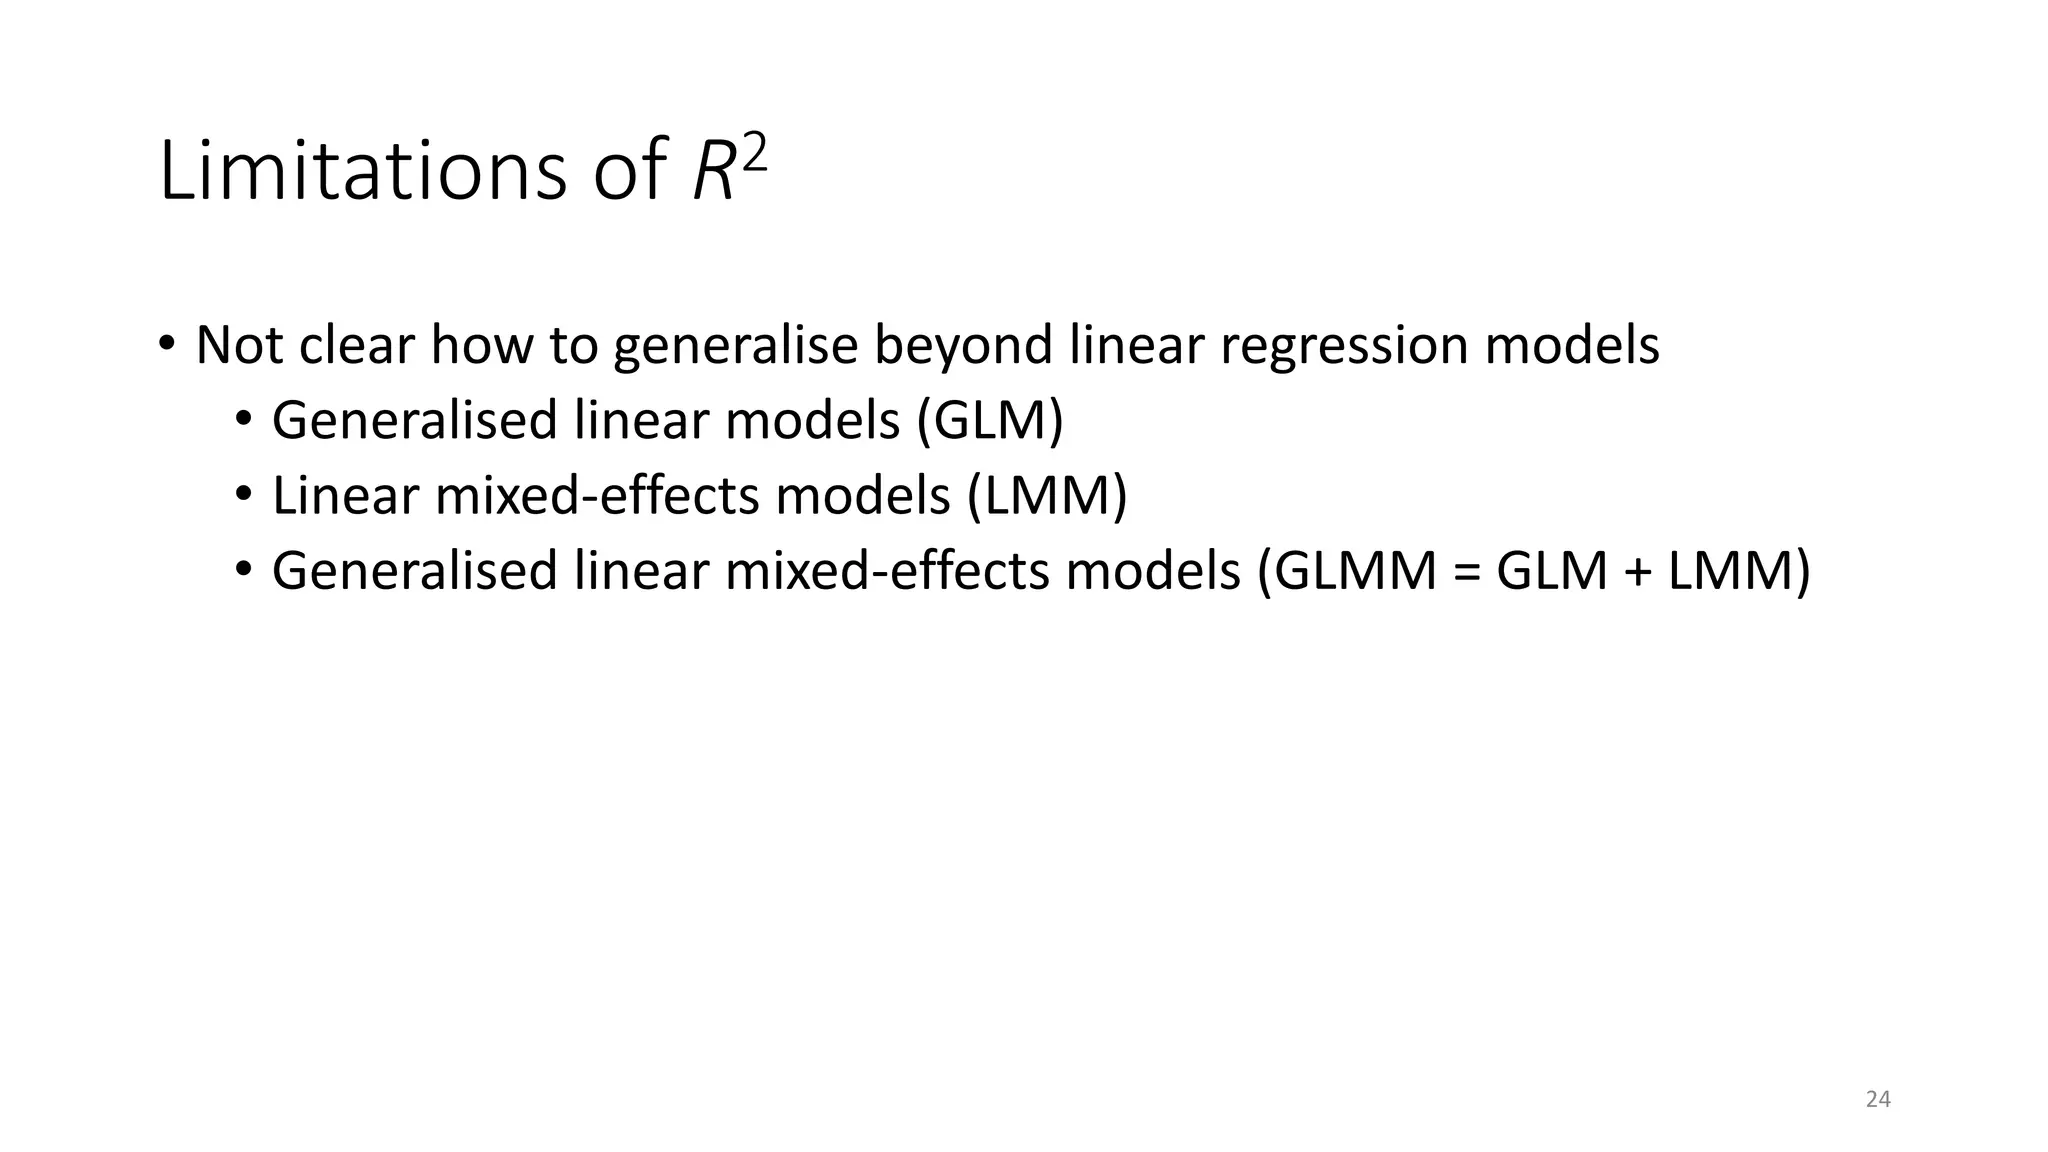
![Limitations of R2
• Gauges error in predicting your own data – not actually prediction
• Using R2 for model selection will always select the largest model
• Adjusted R2 penalises model complexity (here n = 5, p = 1):
• R2
adj = 1 – (1 – R2) (n – 1) / (n – p – 1)
• R2
adj = 100% – 34% x 4/3 = 54%
• Adjusted R2 still can’t be used for model selection (but still is)
• We want the “best” model also to have the maximum R2, similarly to
minimising AIC. This is “Final Prediction Error” R2 (Nicoleta & Goşoniu
2006):
• R2
FPE = [(n+p+1) x R2
adj - p] / (n + 1)
• R2
FPE = (7 x R2
adj – 1) / 6 = 46% (the most “honest” R2 , cf R2 = 66%!)
23](https://image.slidesharecdn.com/pjr2talkforslideshare-180504134358/75/Extending-R-squared-beyond-ordinary-least-squares-linear-regression-23-2048.jpg)


![[DSC Europe 25] Jim Sterne - Adopting Generative AI Capabilities Into the Ent...](https://cdn.slidesharecdn.com/ss_thumbnails/sxhpofuorcagxsaulkmt-3-251204082258-7e66bc48-thumbnail.jpg?width=640&height=640&fit=bounds)
![[DSC Europe 25] Boris Perkovic - Lost in performance.pptx](https://cdn.slidesharecdn.com/ss_thumbnails/uq5hrp7vsuahqkxzifux-1-251204082258-fd2ee09d-thumbnail.jpg?width=640&height=640&fit=bounds)


![[DSC Europe 25] Vid Stimac - Policy Parsimony: Between Oversimplifying and Ov...](https://cdn.slidesharecdn.com/ss_thumbnails/eqlepagzqp2rhg3gbluh-dsc-stimac-251120-251205090438-059e7f54-thumbnail.jpg?width=640&height=640&fit=bounds)


![[DSC Europe 25] Dusan Jovicic - AI Story: From on-prem to cloud and back agai...](https://cdn.slidesharecdn.com/ss_thumbnails/8kp49m6uq22ifnbwhfnk-2-251205085715-964d11a6-thumbnail.jpg?width=640&height=640&fit=bounds)


![[DSC Europe 25] Bogdan Daniel Maruneac - AI - It starts with you.pptx](https://cdn.slidesharecdn.com/ss_thumbnails/odov3snhrcqs9hx5ny2n-4-251205085715-f1daacfe-thumbnail.jpg?width=640&height=640&fit=bounds)
![[DSC Europe 25] Marija Vlajkovic & Andrea Radonjanin - Integration of AI tool...](https://cdn.slidesharecdn.com/ss_thumbnails/qf1jrglttoc3bm8s3aop-final-integration-of-ai-tools-251208151905-394f3a6a-thumbnail.jpg?width=640&height=640&fit=bounds)
![[DSC Europe 25] Max Talanov - Non digital NNs.pptx](https://cdn.slidesharecdn.com/ss_thumbnails/wif8tr3gtua74qvtopke-non-digital-nns-251205090438-26b0eea6-thumbnail.jpg?width=640&height=640&fit=bounds)
